Senate Banking advanced the Clarity Act 15-9 Thursday. BTC, XRP, ETH and DOGE all sit below their 200 EMAs on Friday, May 15.
Bitcoin at $79.6K, XRP $1.42, ETH $2.25K, DOGE $0.114. Every major sits inside tight consolidation despite the bullish vote.
Polymarket prices 62-73% odds of 2026 passage. Citi targets $143K BTC and Standard Chartered $8 XRP if the bill becomes law.
Bitcoin,
XRP, Ethereum and Dogecoin all trade lower on Friday, May 15, 2026, the morning
after the US Senate Banking Committee voted
15-9 to advance the Digital Asset Market Clarity Act. BTC sits at $79,611, down 1.48%, after closing
above $81,000 on Thursday. XRP changes hands at $1.42, down 1.55%, after intraday strength to $1.55.
ETH trades
at $2,256, down 1.28%. DOGE holds near $0.1145. Every major asset remains
locked inside the tight consolidation ranges that defined the week.
The
bipartisan committee vote was the bullish catalyst the market had been waiting
on for months. The price reaction is not the breakout that catalyst implied. My
chart work shows all four assets pinned
below their respective 200-day exponential moving averages, with Thursday's
rally rejected at every relevant overhead level.
Follow
me on X for real-time crypto market analysis: @ChmielDk
Why Crypto Rallied? The
Clarity Act Unblocking
The Senate
Banking Committee cleared the 309-page Digital Asset Market Clarity Act on
Thursday, May 14, in a 15-9 bipartisan
vote at 10:30 AM EST. Democrats Ruben Gallego and Angela Alsobrooks crossed
over to join all 13 Republicans, on a markup that the FinanceMagnates.com breaking
coverage detailed in full. The bill now moves to a full Senate floor vote requiring 60 votes,
then House reconciliation with H.R. 3633 passed in July 2025.
"The
upcoming legislation is likely to have three key effects," said Paul
Howard, Senior Director at Wincent. Howard expects regulatory clarity to act as
a "net positive for Bitcoin over the medium to long term," with
allowing yield-bearing stablecoins potentially driving a bullish second half.
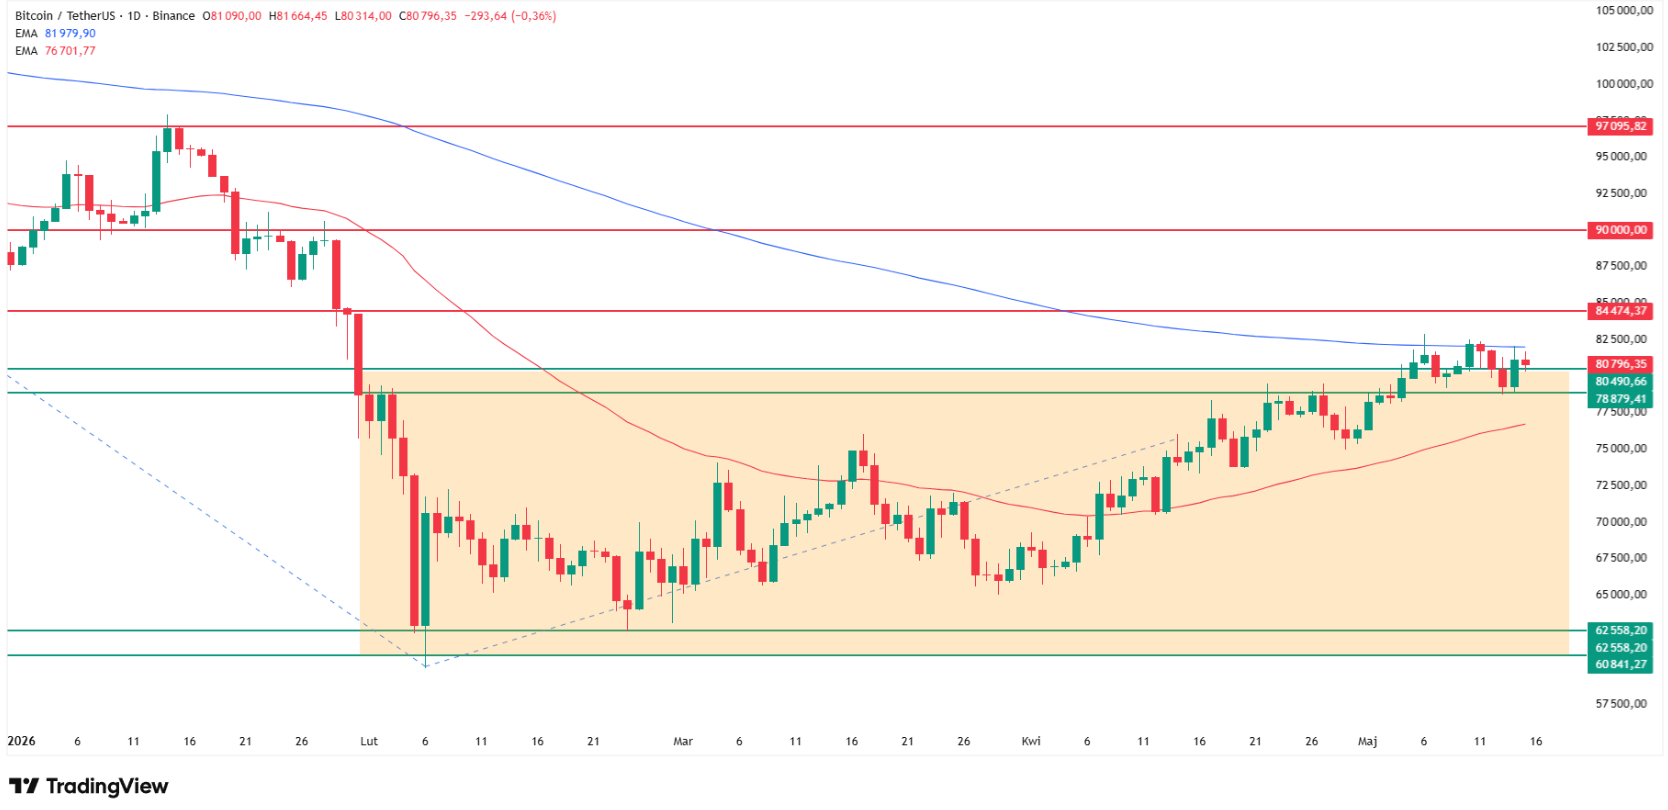
Bitcoin (BTC) Technical
Analysis: Cage Breaks at $82K or Returns to the 50 EMA
In 15 years
analyzing crypto and CFD markets, I've rarely seen four majors simultaneously
frozen this tight under their 200 EMAs on a bullish regulatory catalyst. As I
wrote in my Wednesday analysis on Bitcoin
stuck below the 200 EMA at $82,000, the volatility cage is the
dominant feature of this tape, not the Clarity Act headline.
Thursday's
session delivered a 2%+ gain that closed BTC above $81,000. Friday's 0.6%
pullback leaves price inside the same consolidation range that has defined
trading since early May. The 200 EMA
continues to act as the lid.
Why Bitcoin is going up? Source: Tradingview.com
A daily
close above opens the corridor to $85,000, which marked the November and
December 2024 lows. Below the current range, the 50 EMA at $77,000 is the next
test.
"We
are watching $82,000 most closely this
week," said Adam Haeems, Head of Asset Management at Tesseract Group.
He flagged it as the 200-day moving average and the top of the recent range. A daily close above opens a corridor to
$85,000 and then $90,000 in his framework, while failure brings $76,000, $73,000 and $70,000 back into the frame.
Howard
pegged technical support around $79,000 and resistance near $82,500, consistent
with my chart and with where the 200 EMA cluster sits.
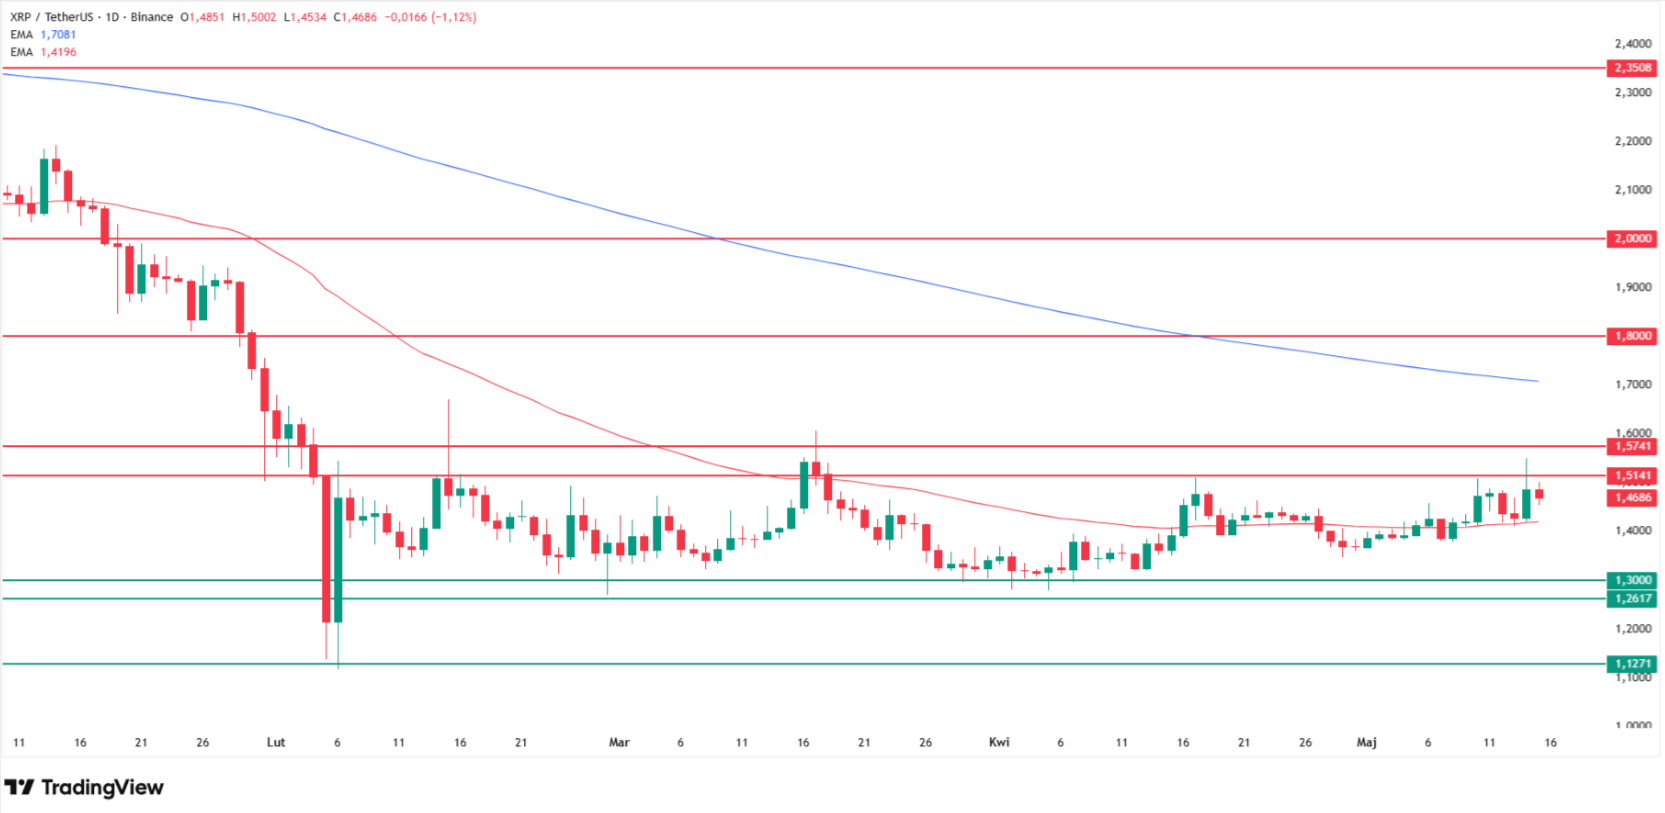
XRP Technical Analysis:
Biggest Reaction, Most Familiar Rejection
XRP was the
strongest reactor to Thursday's vote. The token climbed as much as 8% intraday and tested $1.55, the highest print
since March 17, before closing the session with a 4% gain. Friday brings a 1%
pullback to below $1.47.
That
intraday spike ran straight into the same supply zone that has rejected XRP four times since February.
As I
documented in my analysis published this Monday
before the markup vote, the $1.51 to $1.57 ceiling
has held in mid-February, mid-March, mid-April, and now mid-May. Every prior
contact with this level was followed by a return to the lower boundary of the
range near $1.30.
Why XRP is going up? Source: Tradingview.com
The chart
structure is unchanged by the headline. My downside reference remains the $1.30 floor, with the deeper $0.53
scenario active only on a clean break below it and a stalled bill. The
structural bull case still requires a clean
daily close above $1.57 to unlock the $1.70 short-term target cited by 24/7
Wall Street, with $3 to $5 conditional on full Senate passage and ETF inflows
scaling.
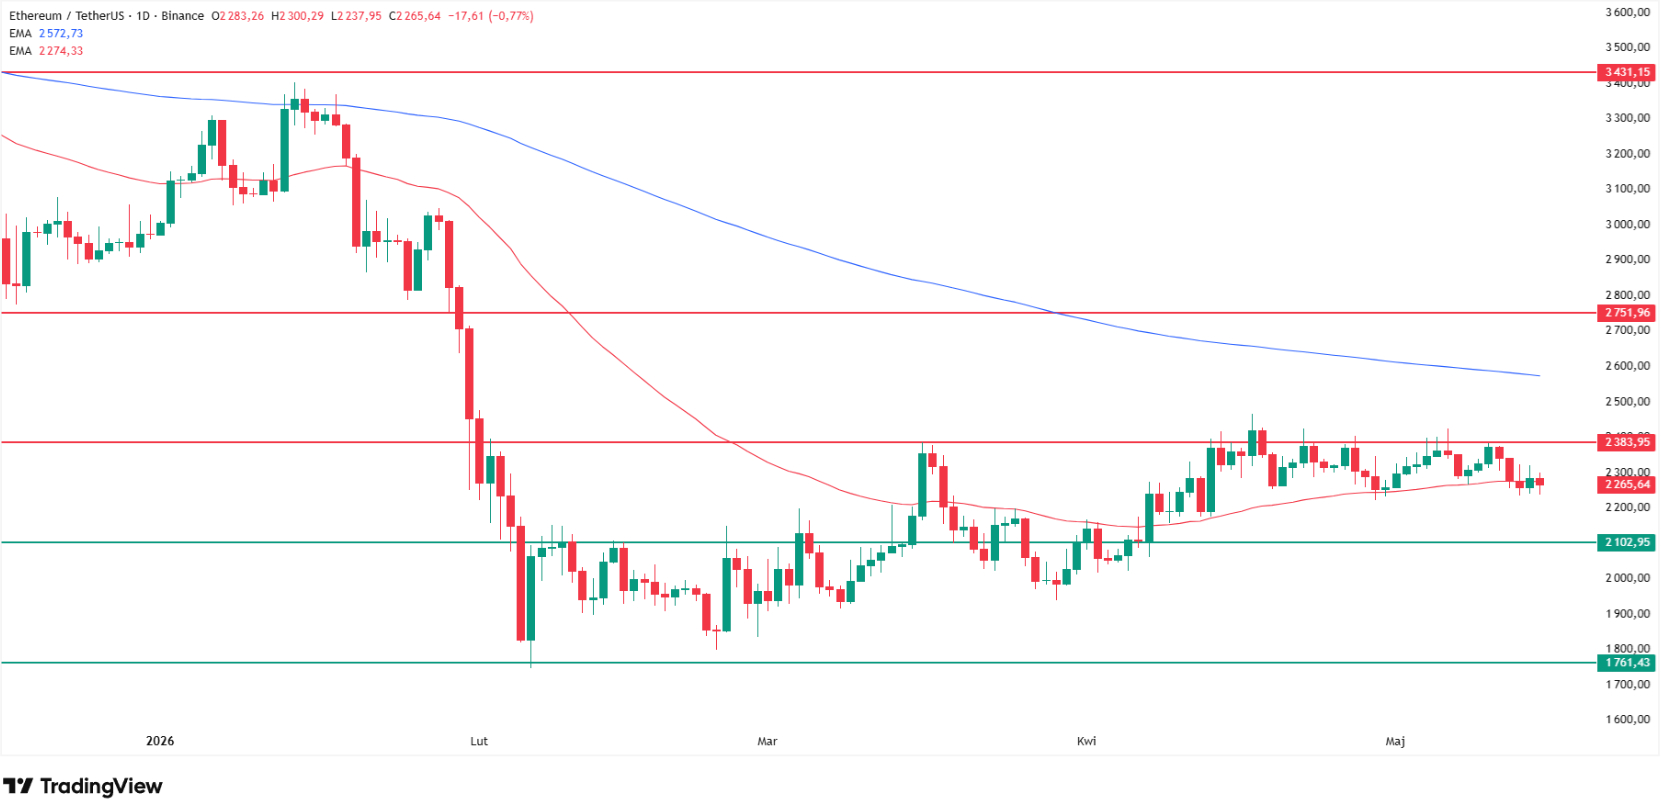
Ethereum (ETH) Technical
Analysis: Balancing on the 50 MA at One-Year Lows
Ethereum
took the Clarity Act vote with the smallest
reaction of the four majors. ETH climbed 3% intraday Thursday before
closing with a 1% gain. Friday brings a 1.2% pullback to $2,255, balancing on
the 50-day moving average.
The
structure is consolidation at the lowest levels in a year, not a base-building
setup. As my February analysis of the ETH
break below $2,000 detailed, the range between $1,760
support (February lows) and $2,380
resistance (March highs) has held intact through repeated tests in April
and May. The bears have rejected every upside attempt at $2,380.
Why Ethereum is going up? Source: Tradingview.com
Even a
clean break of $2,380 does not unlock a directional move. The 200 EMA sits at $2,600 as the next
ceiling, and the $2,750 area, which marked the November and December 2024 lows,
becomes the structural resistance above that. The trend remains down.
Standard
Chartered's $7,500 end-2026 target requires this entire ladder to be cleared,
and the chart shows no evidence that capacity yet exists.
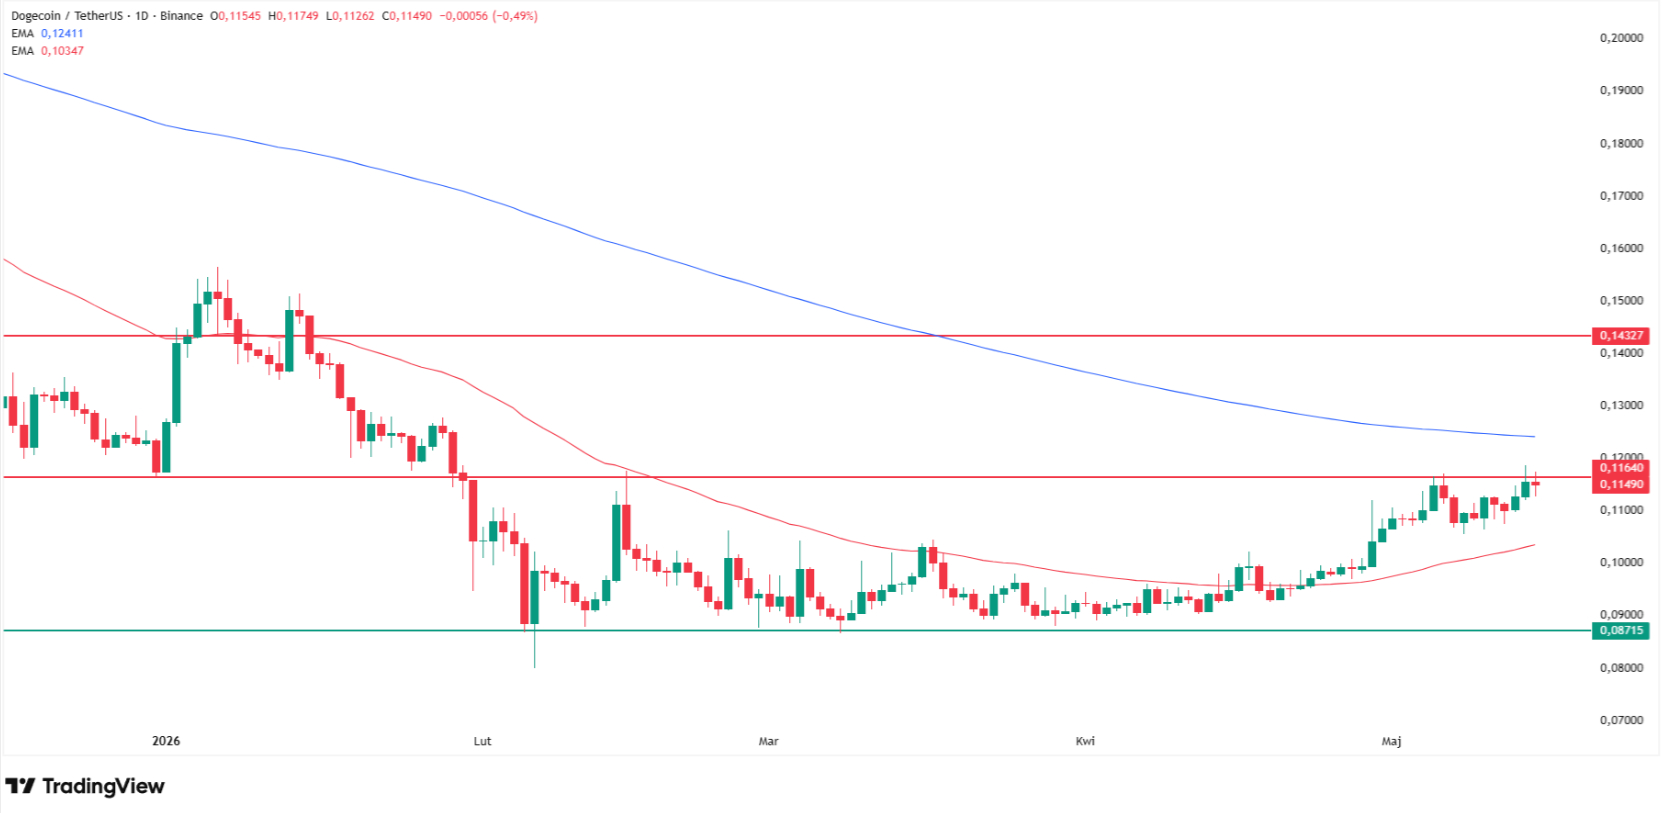
Dogecoin
briefly tested $0.12 on Thursday, the highest level since January, before
giving back 2.5% into the close. Friday brings further modest losses, with DOGE
trading near $0.1145. As my prior multi-asset crypto coverage
flagged, the upper
boundary of the current range has now been tested twice in May.
The main support sits just below $0.09,
marking the February, March and April lows. The chart structure is unambiguous:
tight range, lowest levels of 2024, no break of the downtrend. Of the four
majors, DOGE has the least technical
room for any directional move in either direction.
Why Dogecoin is going up? Source: Tradingview.com
That
structural weakness fits Haeems' point about ETF flow durability rather than
retail momentum being the marginal price setter in 2026. Meme tokens depend on
the retail bid that 2026 has not delivered. Without it, DOGE keeps grinding
inside this cage.
FAQ
Why did Bitcoin not break
out after the Clarity Act vote?
XRP's
primary overhead supply sits between $1.51 and $1.57. That band has rejected
price in mid-February, mid-March, mid-April, and again on May 14 after the
Thursday vote. A daily close above $1.57 would activate the $1.70 target cited
by 24/7 Wall Street, with Standard Chartered's $8.00 contingent on full Senate
passage and $10 billion in ETF inflows.
Will Ethereum recover
above $2,380 in 2026?
The $2,380
level marks the March highs and has been tested unsuccessfully in April and
May. Above it, the 200 EMA at $2,600 is the next ceiling, then the $2,750 area
from November and December 2024 lows. Standard Chartered's $7,500 end-2026
target requires this entire ladder to clear. The chart structure does not yet
show momentum for it.
What is the main support
for Dogecoin?
DOGE's main
support sits just below $0.09, which marked the February, March and April lows.
The current $0.1145 keeps price inside a narrow consolidation that has formed
at the lowest levels of 2024. The upper boundary near $0.12 has been tested
twice in May without a clean break. The structure remains a downtrend with no
upside resolution yet.
Bitcoin,
XRP, Ethereum and Dogecoin all trade lower on Friday, May 15, 2026, the morning
after the US Senate Banking Committee voted
15-9 to advance the Digital Asset Market Clarity Act. BTC sits at $79,611, down 1.48%, after closing
above $81,000 on Thursday. XRP changes hands at $1.42, down 1.55%, after intraday strength to $1.55.
ETH trades
at $2,256, down 1.28%. DOGE holds near $0.1145. Every major asset remains
locked inside the tight consolidation ranges that defined the week.
The
bipartisan committee vote was the bullish catalyst the market had been waiting
on for months. The price reaction is not the breakout that catalyst implied. My
chart work shows all four assets pinned
below their respective 200-day exponential moving averages, with Thursday's
rally rejected at every relevant overhead level.
Follow
me on X for real-time crypto market analysis: @ChmielDk
Why Crypto Rallied? The
Clarity Act Unblocking
The Senate
Banking Committee cleared the 309-page Digital Asset Market Clarity Act on
Thursday, May 14, in a 15-9 bipartisan
vote at 10:30 AM EST. Democrats Ruben Gallego and Angela Alsobrooks crossed
over to join all 13 Republicans, on a markup that the FinanceMagnates.com breaking
coverage detailed in full. The bill now moves to a full Senate floor vote requiring 60 votes,
then House reconciliation with H.R. 3633 passed in July 2025.
"The
upcoming legislation is likely to have three key effects," said Paul
Howard, Senior Director at Wincent. Howard expects regulatory clarity to act as
a "net positive for Bitcoin over the medium to long term," with
allowing yield-bearing stablecoins potentially driving a bullish second half.
Bitcoin (BTC) Technical
Analysis: Cage Breaks at $82K or Returns to the 50 EMA
In 15 years
analyzing crypto and CFD markets, I've rarely seen four majors simultaneously
frozen this tight under their 200 EMAs on a bullish regulatory catalyst. As I
wrote in my Wednesday analysis on Bitcoin
stuck below the 200 EMA at $82,000, the volatility cage is the
dominant feature of this tape, not the Clarity Act headline.
Thursday's
session delivered a 2%+ gain that closed BTC above $81,000. Friday's 0.6%
pullback leaves price inside the same consolidation range that has defined
trading since early May. The 200 EMA
continues to act as the lid.
Why Bitcoin is going up? Source: Tradingview.com
A daily
close above opens the corridor to $85,000, which marked the November and
December 2024 lows. Below the current range, the 50 EMA at $77,000 is the next
test.
"We
are watching $82,000 most closely this
week," said Adam Haeems, Head of Asset Management at Tesseract Group.
He flagged it as the 200-day moving average and the top of the recent range. A daily close above opens a corridor to
$85,000 and then $90,000 in his framework, while failure brings $76,000, $73,000 and $70,000 back into the frame.
Howard
pegged technical support around $79,000 and resistance near $82,500, consistent
with my chart and with where the 200 EMA cluster sits.
XRP Technical Analysis:
Biggest Reaction, Most Familiar Rejection
XRP was the
strongest reactor to Thursday's vote. The token climbed as much as 8% intraday and tested $1.55, the highest print
since March 17, before closing the session with a 4% gain. Friday brings a 1%
pullback to below $1.47.
That
intraday spike ran straight into the same supply zone that has rejected XRP four times since February.
As I
documented in my analysis published this Monday
before the markup vote, the $1.51 to $1.57 ceiling
has held in mid-February, mid-March, mid-April, and now mid-May. Every prior
contact with this level was followed by a return to the lower boundary of the
range near $1.30.
Why XRP is going up? Source: Tradingview.com
The chart
structure is unchanged by the headline. My downside reference remains the $1.30 floor, with the deeper $0.53
scenario active only on a clean break below it and a stalled bill. The
structural bull case still requires a clean
daily close above $1.57 to unlock the $1.70 short-term target cited by 24/7
Wall Street, with $3 to $5 conditional on full Senate passage and ETF inflows
scaling.
Ethereum (ETH) Technical
Analysis: Balancing on the 50 MA at One-Year Lows
Ethereum
took the Clarity Act vote with the smallest
reaction of the four majors. ETH climbed 3% intraday Thursday before
closing with a 1% gain. Friday brings a 1.2% pullback to $2,255, balancing on
the 50-day moving average.
The
structure is consolidation at the lowest levels in a year, not a base-building
setup. As my February analysis of the ETH
break below $2,000 detailed, the range between $1,760
support (February lows) and $2,380
resistance (March highs) has held intact through repeated tests in April
and May. The bears have rejected every upside attempt at $2,380.
Why Ethereum is going up? Source: Tradingview.com
Even a
clean break of $2,380 does not unlock a directional move. The 200 EMA sits at $2,600 as the next
ceiling, and the $2,750 area, which marked the November and December 2024 lows,
becomes the structural resistance above that. The trend remains down.
Standard
Chartered's $7,500 end-2026 target requires this entire ladder to be cleared,
and the chart shows no evidence that capacity yet exists.
Dogecoin
briefly tested $0.12 on Thursday, the highest level since January, before
giving back 2.5% into the close. Friday brings further modest losses, with DOGE
trading near $0.1145. As my prior multi-asset crypto coverage
flagged, the upper
boundary of the current range has now been tested twice in May.
The main support sits just below $0.09,
marking the February, March and April lows. The chart structure is unambiguous:
tight range, lowest levels of 2024, no break of the downtrend. Of the four
majors, DOGE has the least technical
room for any directional move in either direction.
Why Dogecoin is going up? Source: Tradingview.com
That
structural weakness fits Haeems' point about ETF flow durability rather than
retail momentum being the marginal price setter in 2026. Meme tokens depend on
the retail bid that 2026 has not delivered. Without it, DOGE keeps grinding
inside this cage.
FAQ
Why did Bitcoin not break
out after the Clarity Act vote?
XRP's
primary overhead supply sits between $1.51 and $1.57. That band has rejected
price in mid-February, mid-March, mid-April, and again on May 14 after the
Thursday vote. A daily close above $1.57 would activate the $1.70 target cited
by 24/7 Wall Street, with Standard Chartered's $8.00 contingent on full Senate
passage and $10 billion in ETF inflows.
Will Ethereum recover
above $2,380 in 2026?
The $2,380
level marks the March highs and has been tested unsuccessfully in April and
May. Above it, the 200 EMA at $2,600 is the next ceiling, then the $2,750 area
from November and December 2024 lows. Standard Chartered's $7,500 end-2026
target requires this entire ladder to clear. The chart structure does not yet
show momentum for it.
What is the main support
for Dogecoin?
DOGE's main
support sits just below $0.09, which marked the February, March and April lows.
The current $0.1145 keeps price inside a narrow consolidation that has formed
at the lowest levels of 2024. The upper boundary near $0.12 has been tested
twice in May without a clean break. The structure remains a downtrend with no
upside resolution yet.
Damian Chmiel is a Senior Analyst & Editor at Finance Magnates with more than 15 years of experience in the CFD and online trading industry. Active as both a trader and journalist since 2010, he focuses on broker coverage, fintech innovation, and regulatory developments across Europe, the Middle East, and Asia.
His work includes interviews with C-level leaders at major brokerages and fintech platforms, as well as co-authoring Finance Magnates’ quarterly industry benchmarking reports. Damian’s reporting is data-driven, market-aware, and grounded in direct industry engagement. His analysis and commentary have also been cited by external media outlets, including Investing.com, Binance, The Asset, Stockhead, and Dispatch.
Education:
MA in Finance and Accounting, Cracow University of Economics
How Low Can Silver Price Go? The New XAG/USD Analysis Suggests -50% Bearish Targer
Featured Videos
Base Markets CEO: Why Trust Matters More Than Bonuses | Alex Kolpokchi Interview
Base Markets CEO: Why Trust Matters More Than Bonuses | Alex Kolpokchi Interview
Base Markets CEO: Why Trust Matters More Than Bonuses | Alex Kolpokchi Interview
Base Markets CEO: Why Trust Matters More Than Bonuses | Alex Kolpokchi Interview
Is it still possible to build a successful brokerage by putting clients first instead of relying on flashy promotions?
In this exclusive Finance Magnates Executive Interview, Yam Yehoshua, Chief Editor at Finance Magnates, sits down with Alex Kolpokchi, Co-Founder & CEO of Base Markets, to discuss the company's vision, the lessons learned from leading brokers, and why trust, transparency and real client value are at the centre of its strategy.
During the interview, Alex shares:
- How his experience at IG and Pepperstone shaped Base Markets
- Why the company describes itself as a "no-nonsense broker"
- The importance of trust, execution and client service
- How real client feedback helped build the platform
- Why Base Markets avoided a traditional public launch
- The company's long-term plans for regulation and growth
What makes Base Markets different in today's competitive brokerage industry
💬 What do you think matters most when choosing a broker—pricing, execution, regulation or customer service? Let us know in the comments.
#BaseMarkets #Forex #CFDTrading #OnlineTrading #Brokerage #Trading #FinanceMagnates #Fintech #CEOInterview #TradingIndustry
Today's Wednesday, the 15th of July 2026, and these are our main stories: CMC Markets expands 24/5 US trading to more than 5,000 shares and ETFs, Tickmill UK partners with Interactive Brokers, and Revolut moves closer to launching crypto services in the UAE.
Today's Wednesday, the 15th of July 2026, and these are our main stories: CMC Markets expands 24/5 US trading to more than 5,000 shares and ETFs, Tickmill UK partners with Interactive Brokers, and Revolut moves closer to launching crypto services in the UAE.
Today's Wednesday, the 15th of July 2026, and these are our main stories: CMC Markets expands 24/5 US trading to more than 5,000 shares and ETFs, Tickmill UK partners with Interactive Brokers, and Revolut moves closer to launching crypto services in the UAE.
Today's Wednesday, the 15th of July 2026, and these are our main stories: CMC Markets expands 24/5 US trading to more than 5,000 shares and ETFs, Tickmill UK partners with Interactive Brokers, and Revolut moves closer to launching crypto services in the UAE.
Today's Wednesday, the 15th of July 2026, and these are our main stories: CMC Markets expands 24/5 US trading to more than 5,000 shares and ETFs, Tickmill UK partners with Interactive Brokers, and Revolut moves closer to launching crypto services in the UAE.
Today's Wednesday, the 15th of July 2026, and these are our main stories: CMC Markets expands 24/5 US trading to more than 5,000 shares and ETFs, Tickmill UK partners with Interactive Brokers, and Revolut moves closer to launching crypto services in the UAE.
FM Daily Brief – 14 July 2026
FM Daily Brief – 14 July 2026
FM Daily Brief – 14 July 2026
FM Daily Brief – 14 July 2026
FM Daily Brief – 14 July 2026
FM Daily Brief – 14 July 2026
Today's Tuesday, the 14th of July 2026, and these are our main stories: NinjaTrader cuts ties with Alpha Futures, Russia opens regulated crypto CFDs, and ActivTrades reshapes its group structure.
Today's Tuesday, the 14th of July 2026, and these are our main stories: NinjaTrader cuts ties with Alpha Futures, Russia opens regulated crypto CFDs, and ActivTrades reshapes its group structure.
Today's Tuesday, the 14th of July 2026, and these are our main stories: NinjaTrader cuts ties with Alpha Futures, Russia opens regulated crypto CFDs, and ActivTrades reshapes its group structure.
Today's Tuesday, the 14th of July 2026, and these are our main stories: NinjaTrader cuts ties with Alpha Futures, Russia opens regulated crypto CFDs, and ActivTrades reshapes its group structure.
Today's Tuesday, the 14th of July 2026, and these are our main stories: NinjaTrader cuts ties with Alpha Futures, Russia opens regulated crypto CFDs, and ActivTrades reshapes its group structure.
Today's Tuesday, the 14th of July 2026, and these are our main stories: NinjaTrader cuts ties with Alpha Futures, Russia opens regulated crypto CFDs, and ActivTrades reshapes its group structure.
What's the one piece of advice that's shaped your success?
We asked finance leaders at iFX EXPO International, and their answers couldn't have been more different.
Scott Chiriaco shares why discipline is everything, while Charles Savva believes success starts with balance.
Which perspective do you agree with?
#FinanceMagnates #iFXEXPO #Leadership #Business #Fintech #Shorts
FM Daily Brief – 13 July 2026
FM Daily Brief – 13 July 2026
FM Daily Brief – 13 July 2026
FM Daily Brief – 13 July 2026
FM Daily Brief – 13 July 2026
FM Daily Brief – 13 July 2026
Today is Monday, the 13th of July 2026, and these are our main stories: Plus500 reports stronger first-half revenue, Asic cuts retail CFD levies in, and Pepperstone expands its perpetual CFD plans.
Today is Monday, the 13th of July 2026, and these are our main stories: Plus500 reports stronger first-half revenue, Asic cuts retail CFD levies in, and Pepperstone expands its perpetual CFD plans.
Today is Monday, the 13th of July 2026, and these are our main stories: Plus500 reports stronger first-half revenue, Asic cuts retail CFD levies in, and Pepperstone expands its perpetual CFD plans.
Today is Monday, the 13th of July 2026, and these are our main stories: Plus500 reports stronger first-half revenue, Asic cuts retail CFD levies in, and Pepperstone expands its perpetual CFD plans.
Today is Monday, the 13th of July 2026, and these are our main stories: Plus500 reports stronger first-half revenue, Asic cuts retail CFD levies in, and Pepperstone expands its perpetual CFD plans.
Today is Monday, the 13th of July 2026, and these are our main stories: Plus500 reports stronger first-half revenue, Asic cuts retail CFD levies in, and Pepperstone expands its perpetual CFD plans.