Bitcoin traded below $73,000 on Monday, June 1, 2026, down more than 1% and holding near its weakest level since mid-April's swing low.
My Fibonacci extension targets the $45,000 area, almost 40% below current prices and the 100% extension level, while the downtrend holds.
Let's check the current Bitcoin price predictions
Bitcoin (BTC) traded below
$73,000 on Monday, June 1, 2026, down more than 1% as it opened the week near
its lowest level since mid-April, roughly a month and a half of price erosion.
The move keeps BTC under both the 50 and 200 exponential moving averages and
back inside the consolidation that has capped the market since February.
My read has
not changed: the primary trend points lower, and the next measured objective
sits near $45,000, almost 40% below current levels.
Follow
me on X for real-time market analysis: @ChmielDk
Bitcoin Technical
Analysis: The BTC/USD Trend Stays Down
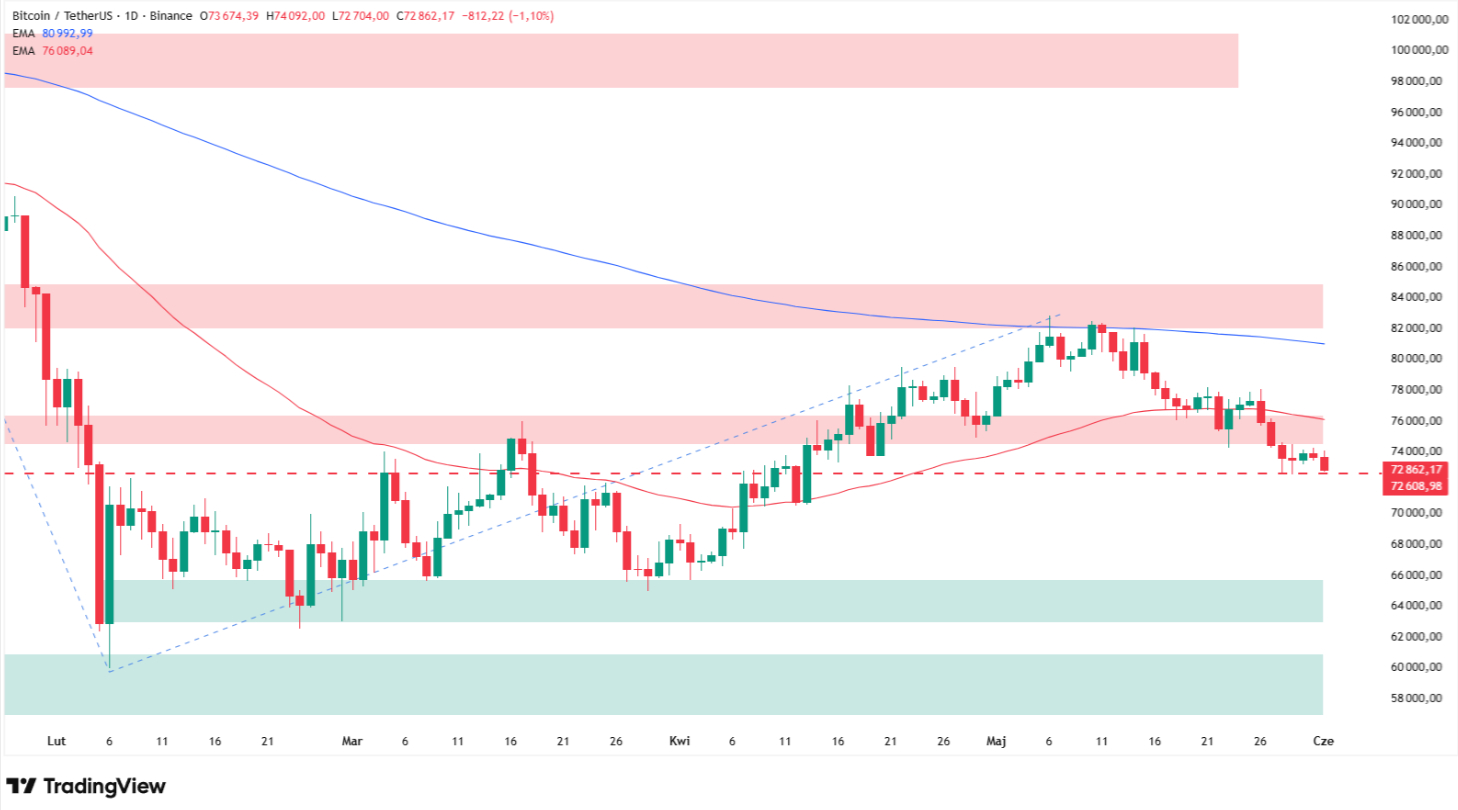
Bitcoin
slipped back below the 50-day exponential moving average at $76,088 and remains
well under the 200 EMA at $80,993, a configuration that has defined the tape
since the February breakdown.
On my chart
I marked the local resistance with a dashed line drawn across the lows of
recent sessions. That ceiling rarely survives in the medium term, and my
analysis points to BTC drifting toward the $63,000-$65,000 support zone, the
February-to-April floor.
In 15 years
covering crypto and metals, I have learned that the 200 EMA rarely lies about
trend regime, and right now it sits above price as resistance rather than
support. You can follow my full archive on my analyst page, Damian Chmiel.
BTC/USDT daily, consolidation since February with price pinned under the 50 EMA. Source: TradingView
To pull
pressure off the bulls, price needs to reclaim the $74,000-$76,000 band,
reinforced by that same 50 EMA. Even then, a heavier wall arrives fast at the
$81,000-$85,000 zone, built by the 200 EMA together with the November-December
2025 lows.
That band
is the real divider between the broken uptrend and the active downtrend, and
until it gives way, every rally is a sell candidate in my framework. As I
argued in my March analysis, the burden of proof stays with the
bears while these levels cap the market.
Level
Type
Notes
$45,000
Target / 100% Fib extension
Measured downside objective, 2024 structure
$63,000-$65,000
Support
February-April
floor, next downside stop
$74,000-$76,000
Resistance / 50 EMA
Reclaim
needed to ease pressure
$81,000-$85,000
Resistance / 200 EMA
November-December
2025 lows, trend divider
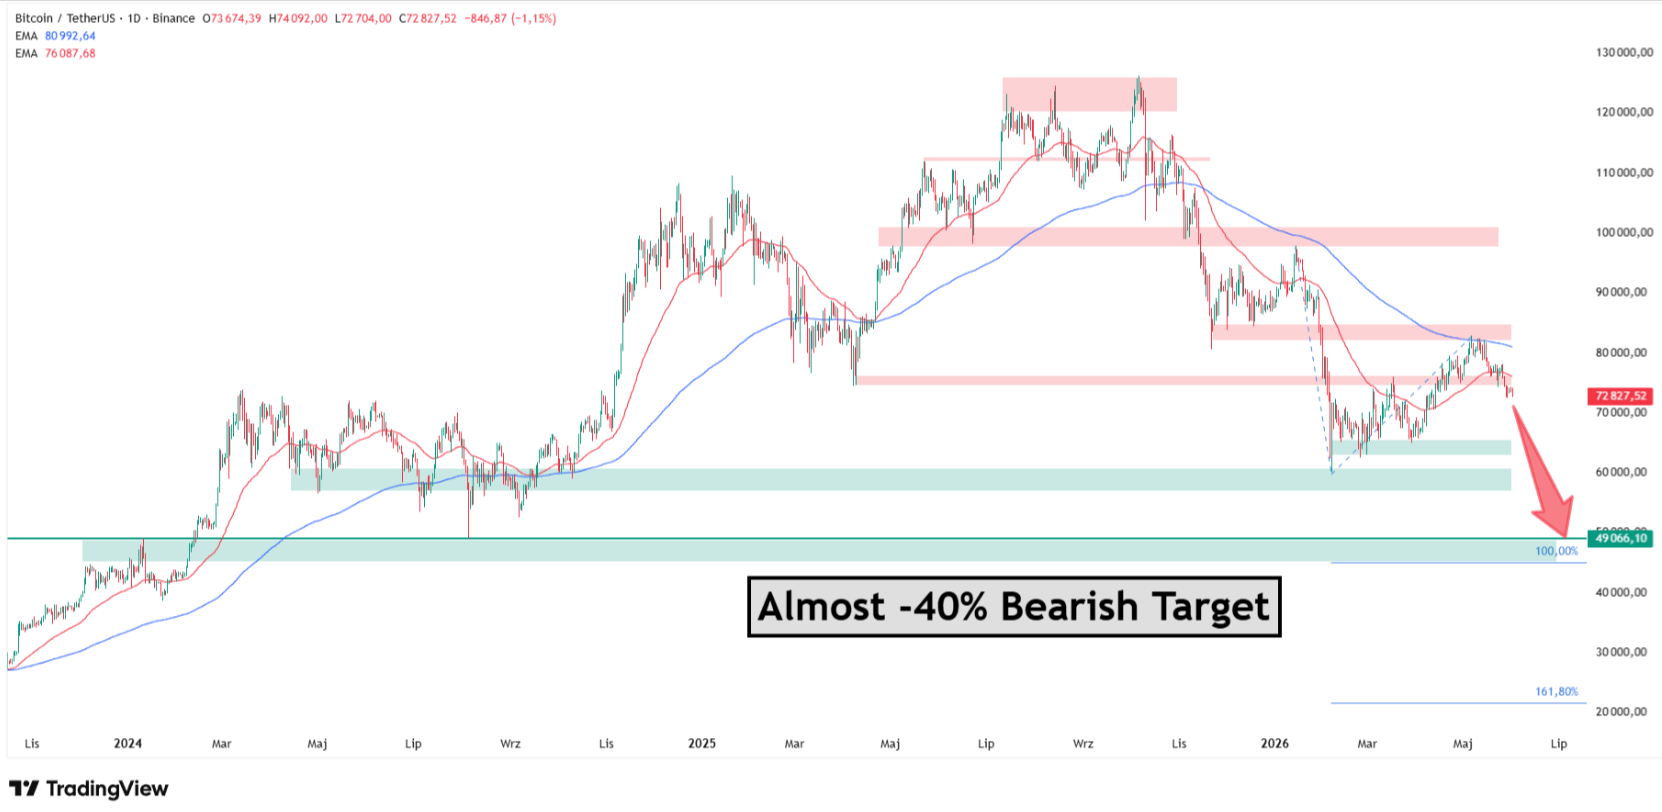
How Low Can Bitcoin Go? Fibonacci
Extension to $45,000
Stretching
a Fibonacci extension grid across the bearish impulse from January and then
over the correction that ran from February to early May, the 100% extension
lands near $45,000.
That zone
overlaps the structure built in 2024, where the $50,000 area first acted as a
local top and later as a floor. From current prices, that leaves Bitcoin almost
40% of room to fall, and it stays my long-term bearish bet while the primary
trend points lower.
BTC/USDT daily, Fibonacci extension projecting a bear target toward the $45-50K. Source: TradingView
I am not
ruling out a deeper slide if conditions allow, since the 161.8% extension
projects toward the low-$20,000s on the same grid. As my earlier Fibonacci extension work mapped the upside targets, the same
tool inverted now points down, and a full 100% retracement of the year's move
reads as the base case for the bears, not a tail risk.
Why It Is Happening
The selling
has a clear macro spine. Bitcoin spot ETFs shed $2.30 billion in May, the
biggest monthly outflow of 2026 and the steepest since November 2025, as April
CPI hit 3.8% and PPI jumped to 6%, the kind of prints that knocked Fed rate-cut
bets off the table.
Joel
Kruger, cryptocurrency strategist at LMAX Group, offers the counter-case.
"May delivered a healthy reality check for crypto markets," Kruger
said. He noted Bitcoin fell 3.58% in May and Ethereum dropped 11.17%, yet the
weakness arrived while US equities held near record highs, pointing to a
crypto-specific capital problem rather than broad risk-off.
The
pullback triggered no mass liquidation, and Kruger argues much of the leverage
that amplified past selloffs has already cleared, leaving positioning healthier
and the asset class more mature.
Key
drivers behind the move:
May ETF outflows of $2.30
billion, the largest monthly exit of 2026
April CPI at 3.8% and PPI at
6%, erasing 2026 rate-cut expectations
10-year Treasury yield near
4.7%, strengthening the dollar
Kevin Warsh confirmed as Fed
chair, keeping the policy outlook hawkish
US-Iran tensions and volatile
oil prices reinforcing inflation fears
Bitcoin Price Predictions:
Where I Stand Against the Street
External
forecasts span a wide gap, and most assume a macro turn I do not yet see on the
chart. Standard Chartered cut its target to $100,000 for year-end 2026 from
$300,000, a downgrade that still requires a recovery my levels do not support
while price sits under the 200 EMA.
Carol
Alexander projects a $75,000-$150,000 range centered on $110,000, credible only
if BTC first reclaims the $81,000-$85,000 band. On the bearish side, Benjamin
Cowen places a new cycle low as his base case for October 2026, which aligns
cleanly with my $45,000 objective.
Peter
Brandt flags one more investable low in September-October 2026 that may break
the $63,000 swing, and as my coverage of his forecast noted, that timing fits the
seasonal weakness. The $200,000-plus bull cases from Bit Mining and Nexo stay
parked until ETF flows turn positive, a point the January institutional roundup framed and the later report on cut targets confirmed when Goldman Sachs and
Standard Chartered trimmed their numbers.
Source
Target
Notes
Damian Chmiel
$45,000
100% Fib
extension, almost 40% downside while trend is down
Benjamin Cowen
New cycle low
Base case around October 2026
Peter Brandt
Low in Sep-Oct 2026
May break the $63,000 swing
Standard Chartered
$100,000 (YE 2026)
Cut from $300,000
Carol Alexander
$75,000-$150,000
$110,000 center
Bit Mining / Nexo
$200,000-$225,000
Bull
case, conditional on Fed cuts and ETF inflows
Bitcoin Price Analysis, FAQ
Why is Bitcoin falling in
June 2026?
Bitcoin
trades below $73,000 after spot ETFs lost $2.30 billion in May, the worst month
of 2026. April CPI at 3.8% and PPI at 6% erased Fed rate-cut bets, while the
10-year yield near 4.7% strengthened the dollar. Price sits under both the 50
and 200 EMAs, keeping the primary trend pointed lower.
How low can Bitcoin go in
2026?
My
Fibonacci extension across the January impulse and the February-to-May
correction projects a 100% target near $45,000, almost 40% below current prices
and inside the structure built in 2024. The first downside stop is the
$63,000-$65,000 support, the February-to-April floor. A deeper 161.8% extension
points toward the low-$20,000s if selling accelerates.
What is the key resistance
level for Bitcoin now?
The first
hurdle is the $74,000-$76,000 band, reinforced by the 50 EMA at $76,088. The
decisive level is the $81,000-$85,000 zone, built by the 200 EMA at $80,993 and
the November-December 2025 lows. In my framework, that band separates the
broken uptrend from the active downtrend, and rallies stay sells until it
breaks.
Will Bitcoin recover in
2026?
A recovery
needs Bitcoin to reclaim the $74,000-$76,000 band and close above the 200 EMA
near $81,000, neither of which has happened. Standard Chartered targets
$100,000 and Carol Alexander centers $110,000, but both assume a macro turn and
positive ETF flows after May's $2.30 billion exit. Until those align, my bias
stays lower.
What are analysts
predicting for Bitcoin in 2026?
Forecasts
span a wide range. Bit Mining and Nexo see $200,000-$225,000 in bull scenarios,
Standard Chartered cut to $100,000, and Carol Alexander projects
$75,000-$150,000. On the bearish side, Benjamin Cowen expects a new cycle low
around October, and Peter Brandt flags another low in September-October that
may break $63,000. My target sits at $45,000.
Bitcoin (BTC) traded below
$73,000 on Monday, June 1, 2026, down more than 1% as it opened the week near
its lowest level since mid-April, roughly a month and a half of price erosion.
The move keeps BTC under both the 50 and 200 exponential moving averages and
back inside the consolidation that has capped the market since February.
My read has
not changed: the primary trend points lower, and the next measured objective
sits near $45,000, almost 40% below current levels.
Follow
me on X for real-time market analysis: @ChmielDk
Bitcoin Technical
Analysis: The BTC/USD Trend Stays Down
Bitcoin
slipped back below the 50-day exponential moving average at $76,088 and remains
well under the 200 EMA at $80,993, a configuration that has defined the tape
since the February breakdown.
On my chart
I marked the local resistance with a dashed line drawn across the lows of
recent sessions. That ceiling rarely survives in the medium term, and my
analysis points to BTC drifting toward the $63,000-$65,000 support zone, the
February-to-April floor.
In 15 years
covering crypto and metals, I have learned that the 200 EMA rarely lies about
trend regime, and right now it sits above price as resistance rather than
support. You can follow my full archive on my analyst page, Damian Chmiel.
BTC/USDT daily, consolidation since February with price pinned under the 50 EMA. Source: TradingView
To pull
pressure off the bulls, price needs to reclaim the $74,000-$76,000 band,
reinforced by that same 50 EMA. Even then, a heavier wall arrives fast at the
$81,000-$85,000 zone, built by the 200 EMA together with the November-December
2025 lows.
That band
is the real divider between the broken uptrend and the active downtrend, and
until it gives way, every rally is a sell candidate in my framework. As I
argued in my March analysis, the burden of proof stays with the
bears while these levels cap the market.
Level
Type
Notes
$45,000
Target / 100% Fib extension
Measured downside objective, 2024 structure
$63,000-$65,000
Support
February-April
floor, next downside stop
$74,000-$76,000
Resistance / 50 EMA
Reclaim
needed to ease pressure
$81,000-$85,000
Resistance / 200 EMA
November-December
2025 lows, trend divider
How Low Can Bitcoin Go? Fibonacci
Extension to $45,000
Stretching
a Fibonacci extension grid across the bearish impulse from January and then
over the correction that ran from February to early May, the 100% extension
lands near $45,000.
That zone
overlaps the structure built in 2024, where the $50,000 area first acted as a
local top and later as a floor. From current prices, that leaves Bitcoin almost
40% of room to fall, and it stays my long-term bearish bet while the primary
trend points lower.
BTC/USDT daily, Fibonacci extension projecting a bear target toward the $45-50K. Source: TradingView
I am not
ruling out a deeper slide if conditions allow, since the 161.8% extension
projects toward the low-$20,000s on the same grid. As my earlier Fibonacci extension work mapped the upside targets, the same
tool inverted now points down, and a full 100% retracement of the year's move
reads as the base case for the bears, not a tail risk.
Why It Is Happening
The selling
has a clear macro spine. Bitcoin spot ETFs shed $2.30 billion in May, the
biggest monthly outflow of 2026 and the steepest since November 2025, as April
CPI hit 3.8% and PPI jumped to 6%, the kind of prints that knocked Fed rate-cut
bets off the table.
Joel
Kruger, cryptocurrency strategist at LMAX Group, offers the counter-case.
"May delivered a healthy reality check for crypto markets," Kruger
said. He noted Bitcoin fell 3.58% in May and Ethereum dropped 11.17%, yet the
weakness arrived while US equities held near record highs, pointing to a
crypto-specific capital problem rather than broad risk-off.
The
pullback triggered no mass liquidation, and Kruger argues much of the leverage
that amplified past selloffs has already cleared, leaving positioning healthier
and the asset class more mature.
Key
drivers behind the move:
May ETF outflows of $2.30
billion, the largest monthly exit of 2026
April CPI at 3.8% and PPI at
6%, erasing 2026 rate-cut expectations
10-year Treasury yield near
4.7%, strengthening the dollar
Kevin Warsh confirmed as Fed
chair, keeping the policy outlook hawkish
US-Iran tensions and volatile
oil prices reinforcing inflation fears
Bitcoin Price Predictions:
Where I Stand Against the Street
External
forecasts span a wide gap, and most assume a macro turn I do not yet see on the
chart. Standard Chartered cut its target to $100,000 for year-end 2026 from
$300,000, a downgrade that still requires a recovery my levels do not support
while price sits under the 200 EMA.
Carol
Alexander projects a $75,000-$150,000 range centered on $110,000, credible only
if BTC first reclaims the $81,000-$85,000 band. On the bearish side, Benjamin
Cowen places a new cycle low as his base case for October 2026, which aligns
cleanly with my $45,000 objective.
Peter
Brandt flags one more investable low in September-October 2026 that may break
the $63,000 swing, and as my coverage of his forecast noted, that timing fits the
seasonal weakness. The $200,000-plus bull cases from Bit Mining and Nexo stay
parked until ETF flows turn positive, a point the January institutional roundup framed and the later report on cut targets confirmed when Goldman Sachs and
Standard Chartered trimmed their numbers.
Source
Target
Notes
Damian Chmiel
$45,000
100% Fib
extension, almost 40% downside while trend is down
Benjamin Cowen
New cycle low
Base case around October 2026
Peter Brandt
Low in Sep-Oct 2026
May break the $63,000 swing
Standard Chartered
$100,000 (YE 2026)
Cut from $300,000
Carol Alexander
$75,000-$150,000
$110,000 center
Bit Mining / Nexo
$200,000-$225,000
Bull
case, conditional on Fed cuts and ETF inflows
Bitcoin Price Analysis, FAQ
Why is Bitcoin falling in
June 2026?
Bitcoin
trades below $73,000 after spot ETFs lost $2.30 billion in May, the worst month
of 2026. April CPI at 3.8% and PPI at 6% erased Fed rate-cut bets, while the
10-year yield near 4.7% strengthened the dollar. Price sits under both the 50
and 200 EMAs, keeping the primary trend pointed lower.
How low can Bitcoin go in
2026?
My
Fibonacci extension across the January impulse and the February-to-May
correction projects a 100% target near $45,000, almost 40% below current prices
and inside the structure built in 2024. The first downside stop is the
$63,000-$65,000 support, the February-to-April floor. A deeper 161.8% extension
points toward the low-$20,000s if selling accelerates.
What is the key resistance
level for Bitcoin now?
The first
hurdle is the $74,000-$76,000 band, reinforced by the 50 EMA at $76,088. The
decisive level is the $81,000-$85,000 zone, built by the 200 EMA at $80,993 and
the November-December 2025 lows. In my framework, that band separates the
broken uptrend from the active downtrend, and rallies stay sells until it
breaks.
Will Bitcoin recover in
2026?
A recovery
needs Bitcoin to reclaim the $74,000-$76,000 band and close above the 200 EMA
near $81,000, neither of which has happened. Standard Chartered targets
$100,000 and Carol Alexander centers $110,000, but both assume a macro turn and
positive ETF flows after May's $2.30 billion exit. Until those align, my bias
stays lower.
What are analysts
predicting for Bitcoin in 2026?
Forecasts
span a wide range. Bit Mining and Nexo see $200,000-$225,000 in bull scenarios,
Standard Chartered cut to $100,000, and Carol Alexander projects
$75,000-$150,000. On the bearish side, Benjamin Cowen expects a new cycle low
around October, and Peter Brandt flags another low in September-October that
may break $63,000. My target sits at $45,000.
Damian Chmiel is a Senior Analyst & Editor at Finance Magnates with more than 15 years of experience in the CFD and online trading industry. Active as both a trader and journalist since 2010, he focuses on broker coverage, fintech innovation, and regulatory developments across Europe, the Middle East, and Asia.
His work includes interviews with C-level leaders at major brokerages and fintech platforms, as well as co-authoring Finance Magnates’ quarterly industry benchmarking reports. Damian’s reporting is data-driven, market-aware, and grounded in direct industry engagement. His analysis and commentary have also been cited by external media outlets, including Investing.com, Binance, The Asset, Stockhead, and Dispatch.
Education:
MA in Finance and Accounting, Cracow University of Economics
From Crypto Fundraising to Prison: Exiled Chinese Tycoon Jailed 30 Years over $1B Fraud
Featured Videos
FM Daily Brief – 13 July 2026
FM Daily Brief – 13 July 2026
FM Daily Brief – 13 July 2026
FM Daily Brief – 13 July 2026
Today is Monday, the 13th of July 2026, and these are our main stories: Plus500 reports stronger first-half revenue, Asic cuts retail CFD levies in, and Pepperstone expands its perpetual CFD plans.
Today is Monday, the 13th of July 2026, and these are our main stories: Plus500 reports stronger first-half revenue, Asic cuts retail CFD levies in, and Pepperstone expands its perpetual CFD plans.
Today is Monday, the 13th of July 2026, and these are our main stories: Plus500 reports stronger first-half revenue, Asic cuts retail CFD levies in, and Pepperstone expands its perpetual CFD plans.
Today is Monday, the 13th of July 2026, and these are our main stories: Plus500 reports stronger first-half revenue, Asic cuts retail CFD levies in, and Pepperstone expands its perpetual CFD plans.
Freedom24 on the Future of Finance: Why Platforms & Ecosystems Are Becoming The Next Major Shift
Freedom24 on the Future of Finance: Why Platforms & Ecosystems Are Becoming The Next Major Shift
Freedom24 on the Future of Finance: Why Platforms & Ecosystems Are Becoming The Next Major Shift
Freedom24 on the Future of Finance: Why Platforms & Ecosystems Are Becoming The Next Major Shift
Freedom24 on the Future of Finance: Why Platforms & Ecosystems Are Becoming The Next Major Shift
Freedom24 on the Future of Finance: Why Platforms & Ecosystems Are Becoming The Next Major Shift
Is the future of financial services about brokers, banks, or something much bigger?
At iFX Expo International 2026, Adonis Adoni, News Editor at Finance Magnates, sits down with Valentin Shatalov, Head of Corporate Affairs at Freedom24, to discuss how financial services are changing and why integrated platforms could become the industry's next major shift.
In this interview, Valentin explains why access to financial markets is no longer enough, how customer expectations are changing, and why trust and local presence remain essential in an increasingly digital world.
In this interview:
- Why Freedom24 sees itself as more than a brokerage
- The move from financial products to platform ecosystems
- How AI is changing customer expectations
- Why trust matters more than technology alone
- The importance of local teams in a digital-first world
- What financial services could look like by 2030
- Lessons from Freedom's Super App success in Kazakhstan
If you're interested in fintech, online trading, brokerage innovation, or the future of investing, this interview offers valuable insights into where the industry is heading.
#Freedom24 #Fintech #Brokerage #Investing #Trading #FinancialServices #Banking #AI #DigitalTransformation #FinanceMagnates #iFXExpo #CapitalMarkets #Innovation #WealthManagement #FintechNews
FM Daily Brief – 10 July 2026
FM Daily Brief – 10 July 2026
FM Daily Brief – 10 July 2026
FM Daily Brief – 10 July 2026
FM Daily Brief – 10 July 2026
FM Daily Brief – 10 July 2026
Today is Friday, the 10th of July 2026, and here are our main stories: US brokers posted record trading volumes in June, Tradeify's co-founders detail the firm's rapid growth, and the Genius Act's stablecoin deadline is ten days out.
Today is Friday, the 10th of July 2026, and here are our main stories: US brokers posted record trading volumes in June, Tradeify's co-founders detail the firm's rapid growth, and the Genius Act's stablecoin deadline is ten days out.
Today is Friday, the 10th of July 2026, and here are our main stories: US brokers posted record trading volumes in June, Tradeify's co-founders detail the firm's rapid growth, and the Genius Act's stablecoin deadline is ten days out.
Today is Friday, the 10th of July 2026, and here are our main stories: US brokers posted record trading volumes in June, Tradeify's co-founders detail the firm's rapid growth, and the Genius Act's stablecoin deadline is ten days out.
Today is Friday, the 10th of July 2026, and here are our main stories: US brokers posted record trading volumes in June, Tradeify's co-founders detail the firm's rapid growth, and the Genius Act's stablecoin deadline is ten days out.
Today is Friday, the 10th of July 2026, and here are our main stories: US brokers posted record trading volumes in June, Tradeify's co-founders detail the firm's rapid growth, and the Genius Act's stablecoin deadline is ten days out.
FM Daily Brief – 9 July 2026
FM Daily Brief – 9 July 2026
FM Daily Brief – 9 July 2026
FM Daily Brief – 9 July 2026
FM Daily Brief – 9 July 2026
FM Daily Brief – 9 July 2026
Today is Thursday, the 9th of July 2026 and here’s our main stories: Capital dot com's trading volumes slipped, while average trade size jumped. Trive loses its Australian license. And European lawmakers eye new rules for DeFi and staking.
Today is Thursday, the 9th of July 2026 and here’s our main stories: Capital dot com's trading volumes slipped, while average trade size jumped. Trive loses its Australian license. And European lawmakers eye new rules for DeFi and staking.
Today is Thursday, the 9th of July 2026 and here’s our main stories: Capital dot com's trading volumes slipped, while average trade size jumped. Trive loses its Australian license. And European lawmakers eye new rules for DeFi and staking.
Today is Thursday, the 9th of July 2026 and here’s our main stories: Capital dot com's trading volumes slipped, while average trade size jumped. Trive loses its Australian license. And European lawmakers eye new rules for DeFi and staking.
Today is Thursday, the 9th of July 2026 and here’s our main stories: Capital dot com's trading volumes slipped, while average trade size jumped. Trive loses its Australian license. And European lawmakers eye new rules for DeFi and staking.
Today is Thursday, the 9th of July 2026 and here’s our main stories: Capital dot com's trading volumes slipped, while average trade size jumped. Trive loses its Australian license. And European lawmakers eye new rules for DeFi and staking.
Match2Pay on Crypto Payments, Stablecoins & Faster Broker Integrations
Match2Pay on Crypto Payments, Stablecoins & Faster Broker Integrations
Match2Pay on Crypto Payments, Stablecoins & Faster Broker Integrations
Match2Pay on Crypto Payments, Stablecoins & Faster Broker Integrations
Match2Pay on Crypto Payments, Stablecoins & Faster Broker Integrations
Match2Pay on Crypto Payments, Stablecoins & Faster Broker Integrations
Are crypto payments really risky for brokers, or is the industry working with outdated assumptions?
In this exclusive Finance Magnates interview from iFX Expo International 2026, Adonis Adoni, News Editor at Finance Magnates, speaks with Andrey Kalashnikov, Head of Match2Pay, about how brokers can improve payment efficiency, reduce costs, and simplify crypto payment infrastructure.
The conversation explores why many firms are paying more than necessary by using multiple crypto providers, how one-click wallet integrations are improving the client deposit experience, and why stablecoins are changing the way finance teams view crypto payments.
In this interview you'll learn:
- Why relying only on card payments could be limiting your business
- The hidden costs of using multiple crypto payment providers
- How one-click crypto payments improve conversion and user experience
- How Match2Pay enables integrations in as little as 24–48 hours
- Why stablecoins eliminate most volatility concerns for finance teams
- How blockchain analytics and AML screening help reduce payment risk
- What brokers should consider when choosing a crypto payment infrastructure
Key Quote:
"It's a mistake to completely rely on traditional payments and not look for alternative methods to optimize your payments." — Andrey Kalashnikov
If you're a broker, payment provider, fintech executive, or compliance professional, this interview offers practical insights into the future of crypto payments.
#FinanceMagnates #Match2Pay #CryptoPayments #Fintech #Forex #CFD #Brokerage #Stablecoins #Blockchain #Payments #iFXExpo #DigitalAssets