

XRP fell to $1.25 on Tuesday, June 2, 2026, its lowest level since February, as a 2.5% decline pushed the token back to the floor of the range that has contained it for four months. Bitcoin's slide below $70,000 the same day, its first since early April, dragged the broader crypto market lower.
My XRP price prediction has not moved through any of this. I remain a structural bear with a long-term downside target at $0.54, almost 60% below the current price.
Follow me on X for real-time market analysis: @ChmielDk
XRP/USDT Technical Analysis: Bearish Preassure
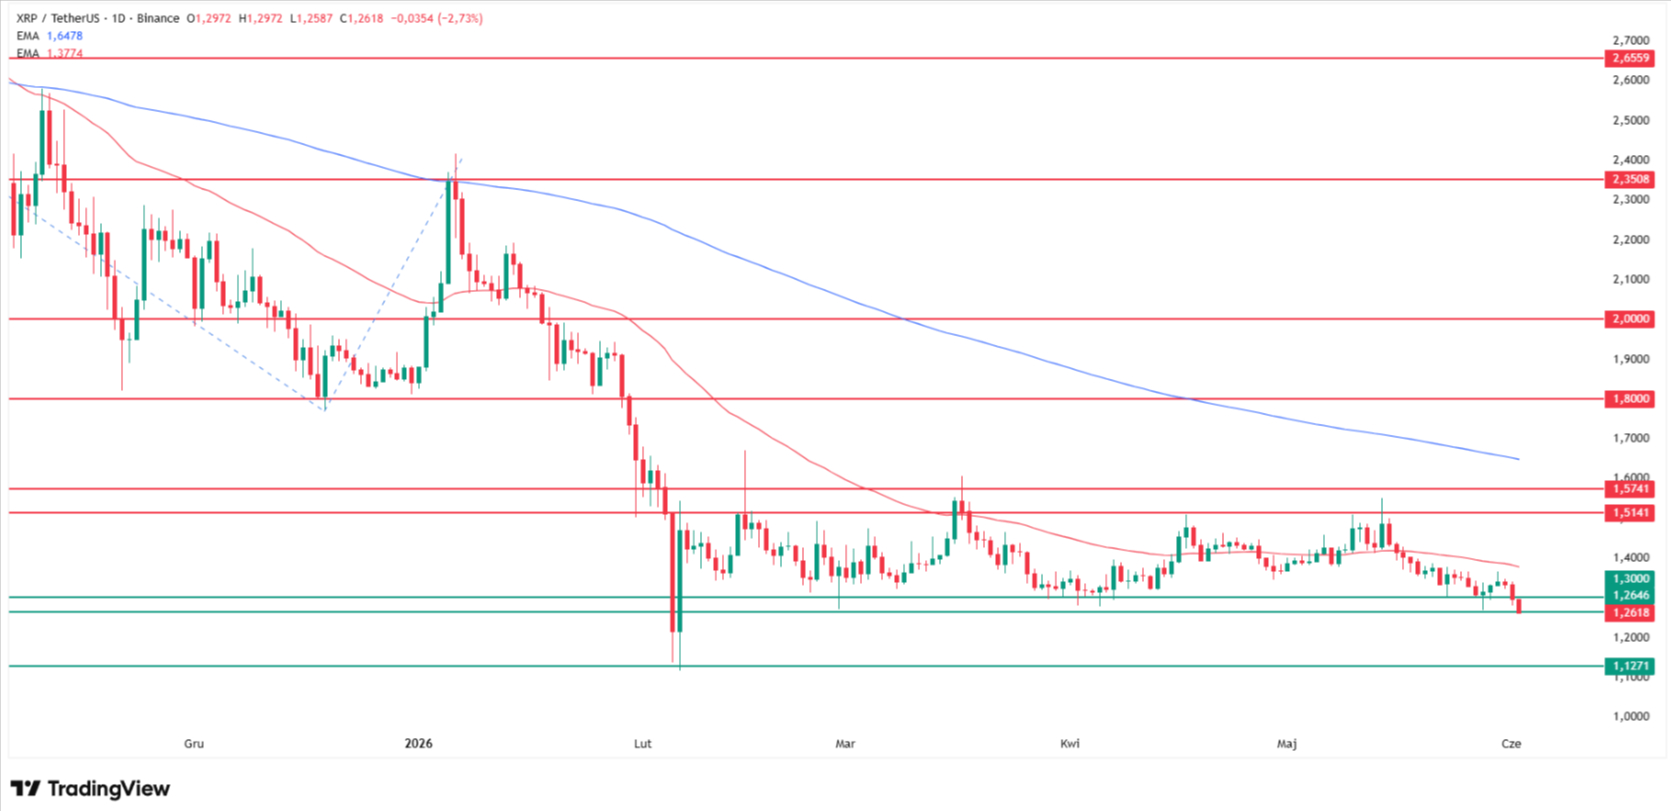
My chart shows XRP testing the lower boundary of a tight consolidation that has held since February, between $1.51-$1.70 on top and $1.26-$1.30 at the base. That is the same structure I mapped in March.
The upper edge has rejected price four separate times. The lower edge is now under attack for the third time in four months, and Tuesday's $1.25 intraday low printed just beneath it.
If that floor breaks, the path opens directly toward $1.11-$1.13, this year's low and the weakest level since November 2024. A daily close below $1.13 is the confirmation I am watching for the next leg down. A bounce that cannot reclaim $1.30 on a closing basis would simply set up a fourth, and probably final, test of the floor.
Having tracked XRP since the 2020 SEC suit, I have watched this token turn four years of regulatory wins into almost nothing on the chart, a record I keep on my analyst page. The 200-day exponential moving average sits far above price at $1.65, reinforced by the April 2025 lows. As long as XRP trades below it, my structural read stays bearish.
- Why Is XRP Price Rising? CLARITY Act Vote Looms as XRP Tests Monthly Highs
- How High Can XRP Go? XRP Price Prediction Shows $2.50 Target or $0.53 Risk
- How High Can XRP Go? XRP Price Prediction for 2026 Targets $315
My long-term target remains $0.54, the late-2024 lows and roughly 57% below Tuesday's level, unchanged since my March downside scenario. The upside is blocked by a dense resistance ladder: $1.80 at the December 2025 lows, the $2.00 psychological level, $2.35 at the January 2026 highs, and $2.66 at the May 2025 highs.
Only a break back above $1.65 would negate the bearish structure, and I am not looking past that ladder yet.
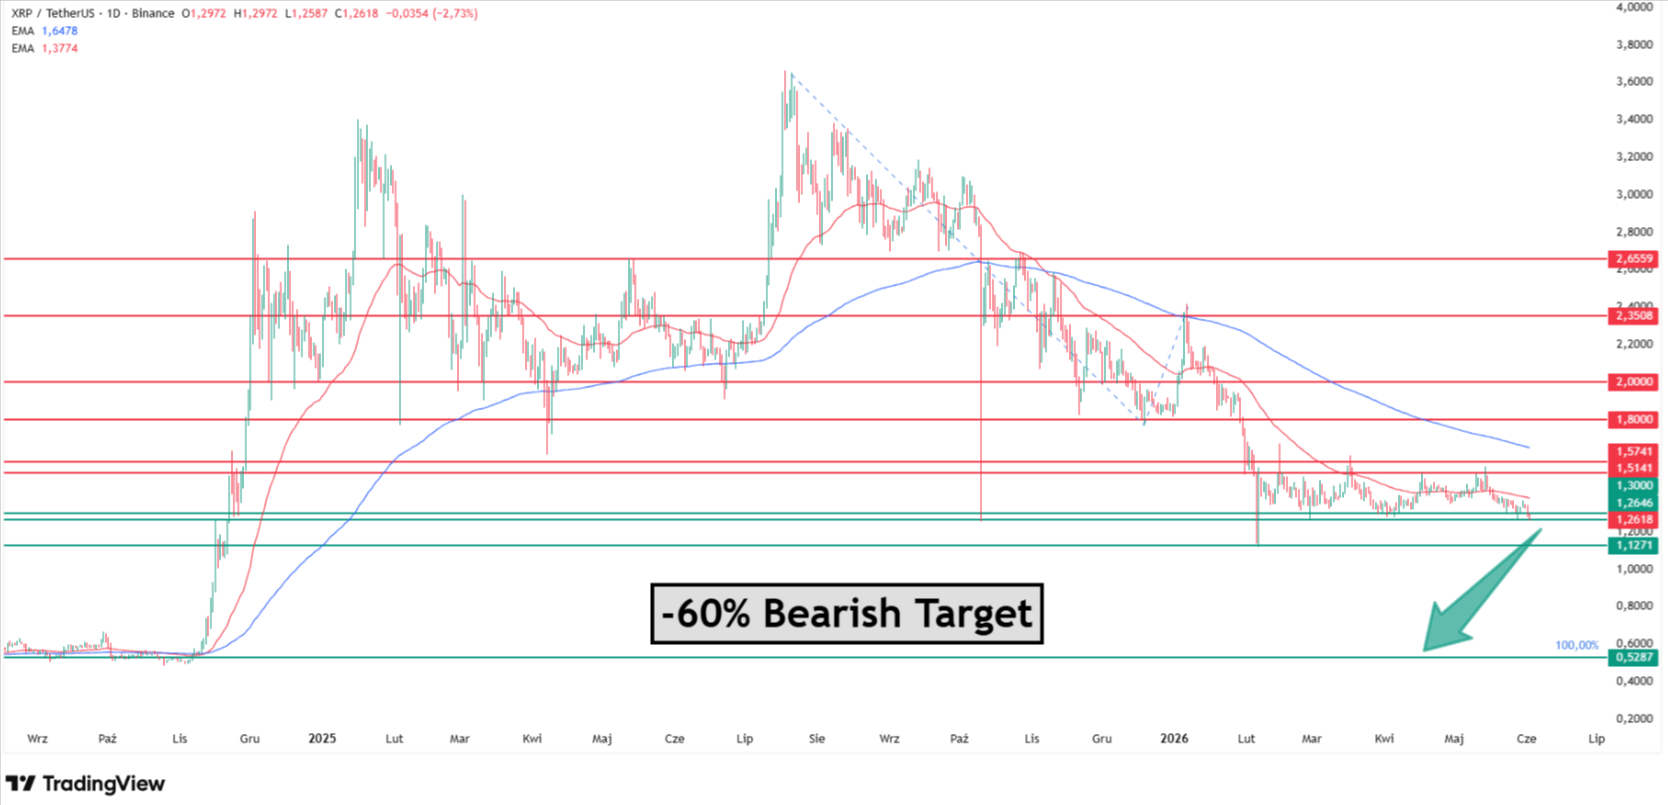
The $0.54 target is not arbitrary. It marks the convergence of the 100% Fibonacci extension of the July-to-October 2025 decline with the price shelf left at the late-2024 lows. A confirmed break of $1.13 would project the full height of the four-month range down into that zone. Support also tends to weaken on the third test, which is exactly where XRP sits now.
Level | Type | Notes |
$0.54 | Long-term target | Late-2024 lows, ~57% below current |
$1.11-$1.13 | Support / YTD low | Daily close below confirms next leg down |
$1.25 | Current | June 2 intraday low, lowest since February |
$1.26-$1.30 | Range floor | Attacked for the third time in four months |
$1.51-$1.70 | Range ceiling | Rejected four times since February |
$1.65 | 200 EMA | Invalidation level for the bearish view |
$1.80 / $2.00 / $2.35 / $2.66 | Resistance ladder | Dec 2025 / psychological / Jan 2026 / May 2025 |
Why XRP Is Falling Now?
The selling started with Bitcoin. BTC dropped below $70,000 on Tuesday for the first time since early April, after Strategy disclosed its first Bitcoin sale in four years, 32 coins for $2.5 million to fund preferred-stock dividends.
US spot Bitcoin ETFs bled $2.43 billion in May, the largest monthly outflow of 2026, while renewed US-Iran tensions and higher oil prices weighed on risk assets. As I wrote in my Bitcoin analysis, BTC itself risks a 40% drop toward $45,000, and XRP rarely escapes that gravity.
XRP's own problem is that good news has stopped working. The CLARITY Act cleared the Senate Banking Committee on May 14, yet the token has closed lower on most sessions since, and the post-vote rally has fully unwound, as my May coverage tracked.
May brought $118.29 million of XRP ETF inflows, the strongest month of 2026, and XRP still fell 6.19% over the period. June seasonality makes it worse, with a median return of -8.49% since 2014 and only three green Junes in more than a decade.
The pressure on XRP comes from four sources:
- Bitcoin below $70,000, its first break of the level since early April, pulling the whole complex down
- $2.43 billion in May US spot Bitcoin ETF outflows, the largest monthly exit of 2026
- Faded CLARITY Act momentum, with XRP lower on most sessions since the May 14 committee vote
- June seasonality running at a -8.49% median return since 2014
XRP Price Predictions: Where I Differ?
The bullish case on XRP rests almost entirely on institutional flows that have not yet shown up in price. Standard Chartered's Geoffrey Kendrick keeps an $8 target for end-2026, the most bullish credible call, but it assumes $10 billion in ETF inflows, and May's $118 million pace does not validate that math.
Bitrue Research Labs sees $2.25-$2.50, which first requires clearing the $1.51-$1.70 ceiling that has rejected price four times. The Motley Fool's $3.00 "realistic" target ignores that XRP has fallen on most sessions since its biggest 2026 regulatory win.
On the downside, Changelly's model averages $1.41 for June, still above the range floor I expect to break. DigitalCoinPrice's $0.44-$1.43 band is the only mainstream forecast whose low end overlaps my structural read. Not everyone shares my bias, and across our XRP coverage the targets run far higher.
As I covered recently, one trader on X is targeting $20 under very specific fundamental conditions, though my daily chart says the opposite.
Source | Target | Notes |
Standard Chartered (G. Kendrick) | $8.00 | End-2026, needs CLARITY Act plus $10B ETF inflows; $2.80 without legislation |
Bitrue Research Labs | $2.25-$2.50 | End-2026 |
The Motley Fool | $3.00 | 2026, framed as "realistic" |
Changelly (model) | $1.41 | June 2026 average, range $1.32-$1.50 |
DigitalCoinPrice | $0.44-$1.43 | 2026, with a June decline |
Damian Chmiel (my call) | $0.54 | Late-2024 lows, roughly 57% downside |
XRP Price Analysis FAQ
Why is XRP falling today?
XRP fell to $1.25 on June 2, 2026, its lowest since February, after Bitcoin broke below $70,000 for the first time since early April. Strategy's first Bitcoin sale in four years and $2.43 billion of May ETF outflows pushed the whole crypto market lower. XRP also sits at the bottom of a four-month range, with sellers attacking the $1.26-$1.30 floor for the third time.
What is the XRP price prediction for 2026?
Forecasts split sharply. Standard Chartered targets $8 by year-end on $10 billion of ETF inflows, while Bitrue sees $2.25-$2.50 and The Motley Fool $3. My own technical analysis runs the other way: I see a structural path toward $0.54, the late-2024 lows, almost 60% below the current $1.25. The gap reflects a flows-versus-chart disagreement that has defined XRP all year.
How low can XRP go?
My long-term downside target is $0.54, the late-2024 lows, roughly 57% below the June 2 price of $1.25. The nearer milestone is $1.11-$1.13, this year's low and the weakest level since November 2024. A daily close below $1.13 would confirm the breakdown from the four-month range and open the move toward $0.54.
What would invalidate the bearish XRP view?
A break back above the 200-day exponential moving average at $1.65 would negate my bearish structure. That level is reinforced by the April 2025 lows. Above it, XRP faces a dense resistance ladder at $1.80, $2.00, $2.35, and $2.66. Until the token reclaims $1.65, my read stays bearish regardless of regulatory headlines or ETF figures.
Are XRP ETF inflows helping the price?
Not yet. XRP ETFs drew $118.29 million in May, the strongest month of 2026, but the token still fell 6.19% over the period. That disconnect is the core of the bearish case: capital is entering the funds while the spot price keeps sliding. Until inflows outpace broader crypto selling, they have not been enough to lift XRP.


