

Bitcoin traded near $81,400 on Wednesday, May 13, 2026, stuck inside a 2% range just below the 200-day exponential moving average at roughly $82,000. The cryptocurrency cleared the upper boundary of its February–April consolidation in early May, breaking above the November 2025 lows around $80,500. That move was supposed to mark a regime change. Instead, BTC has spent the last two weeks pressed against the 200 EMA, the single technical line that still separates the current bear trend from a genuine recovery.
Follow me on X for real-time market analysis: @ChmielDk.
What's Pushing Bitcoin Right Now?
The recovery from the March crash lows near $61,000 has been a slow grind. April spot Bitcoin ETF flows hit $2.44 billion, total US spot BTC ETF assets crossed $100 billion, and BlackRock's IBIT alone now manages more than $63 billion.
The Strait of Hormuz reopened to US-escorted commercial traffic, and Fed Chair Jerome Powell hands the gavel to Kevin Warsh on Friday, May 15. The institutional forecast range, as the FinanceMagnates.com 2026 BTC outlook detailed, still spans $75,000 to $225,000.
- Can Bitcoin Hit $500K? Veteran Trader Peter Brandt's Bitcoin Price Prediction Targets $300K-$500K
- When Will Bitcoin Hit 100K Again; Japanese Firm Metaplanet Adds 330 BTC
- Why Bitcoin Is Going Down: MetaMask Plans BTC, Solana with Gas-Free Transactions
"Crypto majors such as Bitcoin, Solana, Ethereum, are proving resilient and have demonstrable long term value," said Paul Howard, Senior Director at Wincent. Howard noted that crypto majors are absorbing macro pressure better than tech equities under the weight of tariff headlines, energy costs, and China's grip on chip-grade rare earths.
Bitcoin Technical Read: A 2% Cage Below the 200 EMA
Bitcoin broke out of its February–April consolidation at the start of May, clearing the upper boundary near $80,500 that aligned with the November 2025 lows. The technical message looked clean: a multi-month accumulation range giving way. Then the chart hit its next wall almost immediately.
The 200-day exponential moving average is currently riding just above $82,000 (the 200-day SMA prints higher in the $83,000s depending on the data source). Since the breakout, BTC has been trapped between the broken consolidation top below and that moving average above, a band of roughly 2%.
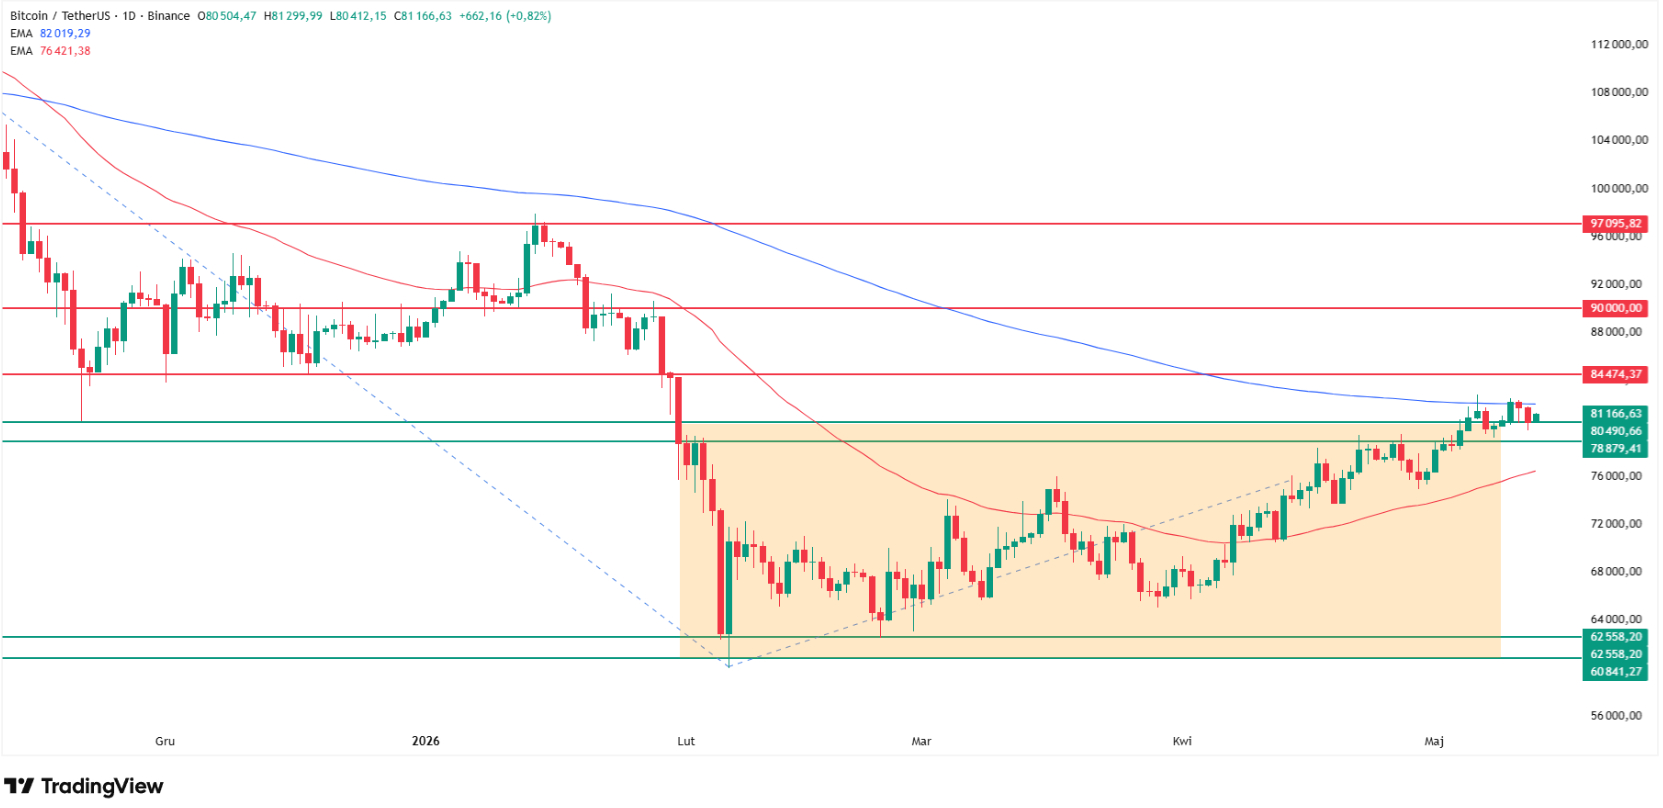
In line with the rules I've followed for 15-plus years as an analyst and trader at FinanceMagnates.com, I treat a market below its 200 EMA as bearish until proven otherwise. That blue line is the single technical divider between the current downtrend and a sustainable recovery.
Until BTC closes daily above it, the path of least resistance tilts down, and the lack of distance from the $80,500 breakout level means a failed retest is firmly on the table.
How Low Can Bitcoin Go?
If $80,500 cracks on a daily close, the structural target moves straight back to the consolidation floor near $61,000, where the February–March 2026 lows sit. As I wrote in my March 24 crash analysis, that band was where the bull-market framework was last defended; losing it on follow-through would be the deepest bear sequel since the April 2024 halving cycle began.
The bull scenario is technically possible but starved of room. A clean daily close above the 200 EMA opens a short corridor to the November–December 2025 lows just under $85,000, where buyers tried to defend the breakdown last quarter.
As I noted in my May 6 analysis when Bitcoin first tested this 200 EMA wall, the resistance ladder above $85,000 gets dense fast: $90,000, then $97,000 (the January peaks), the psychological $100,000 level, then $107,000 to $108,000 (the August–September 2025 lows that flipped to resistance), and finally the entire ATH resistance zone between $120,000 and $126,000 that defined July through October 2025.
Each of those steps is a sell-side magnet for trapped longs from earlier in the cycle. As my April 17 analysis of the Hormuz surge flagged, the $94,000 to $96,000 corridor was where the bullish path opened on a clean break above $80,000, and that view still holds only if the 200 EMA gives way.
My bias here is unchanged. The trend remains bearish, the cage is tightening, and I am still hunting for downside opportunities targeting a retest of this year's $61,000 lows. A daily close above $82,000 forces a rethink. A daily close below $80,500 confirms it.
Follow me on X for live BTC level updates: @ChmielDk.


