XRP rallied 6%+ Sunday May 10, biggest one-day move in two months, but rejected at the $1.45 supply zone Monday as the box ceiling holds.
Senate Banking scheduled the CLARITY Act markup for May 14 at 10:30 AM EST. $1.32B in XRP ETF inflows back the institutional bid.
XRP chart shows the $1.51 to $1.57 ceiling intact, with my prior $0.53 bearish thesis reactivating if the $1.30 floor cracks.
What is the current XRP price today? Let's check the technical analysis and the price predictions
XRP traded
at $1.43 on Monday, May 11, 2026, losing 1.6% and slipping back below the $1.45
supply zone after Sunday's session delivered a 6%+ rally, the strongest one-day
advance in roughly two months.
Why is XRP
price rising into the same overhead supply that has rejected price four times
since February? The answer is on Tim Scott's Senate Banking calendar. The
Senate Banking Committee scheduled the long-delayed CLARITY Act markup for
Thursday, May 14, ending months of legislative gridlock and pulling
institutional capital back off the sidelines.
XRP ETF
inflows now sit near $1.32 billion since the November 2025 launch.
Follow
me on X for real-time crypto market analysis: @ChmielDk
Why XRP Price Is Going Up
Today? CLARITY Act Markup Becomes the Setup
The Senate
Banking Committee, under Chairman Tim Scott, scheduled the CLARITY Act markup
for Thursday, May 14 at 10:30 AM EST, ending months of procedural delay. The
bill would lock XRP's commodity classification into federal law, a designation
the SEC and CFTC already granted jointly on March 17 but one no future agency
could reverse if Congress enacts it.
The
political calendar is unforgiving. If Tim Scott does not move the bill before
the Memorial Day recess on May 21, the next viable legislative window slides
into 2030, when a new Congress would have to restart the process. Polymarket
currently prices the probability of the CLARITY Act passing in 2026 at 62%. The
market is leaning bullish on Thursday's procedural vote.
Paul
Howard, Senior Director at Wincent, framed current XRP pricing as "an
opportunity for accumulation and strategic positioning" ahead of the May
14 markup. Howard cited $2.4 billion in monthly ETF inflows across crypto and
rising expectations of a favorable CLARITY Act outcome at the Consensus Miami
crypto conference as the institutional thesis.
Spot XRP
ETFs absorbed $28.1 million in net inflows across three days between May 4 and
May 6, and roughly $81.59 million across April. Cumulative inflows since the
November 2025 launch now sit near $1.32 billion, with positive weekly flows in
approximately 77% of weeks. The seven listed spot XRP ETFs hold a combined
$1.53 billion in assets under management.
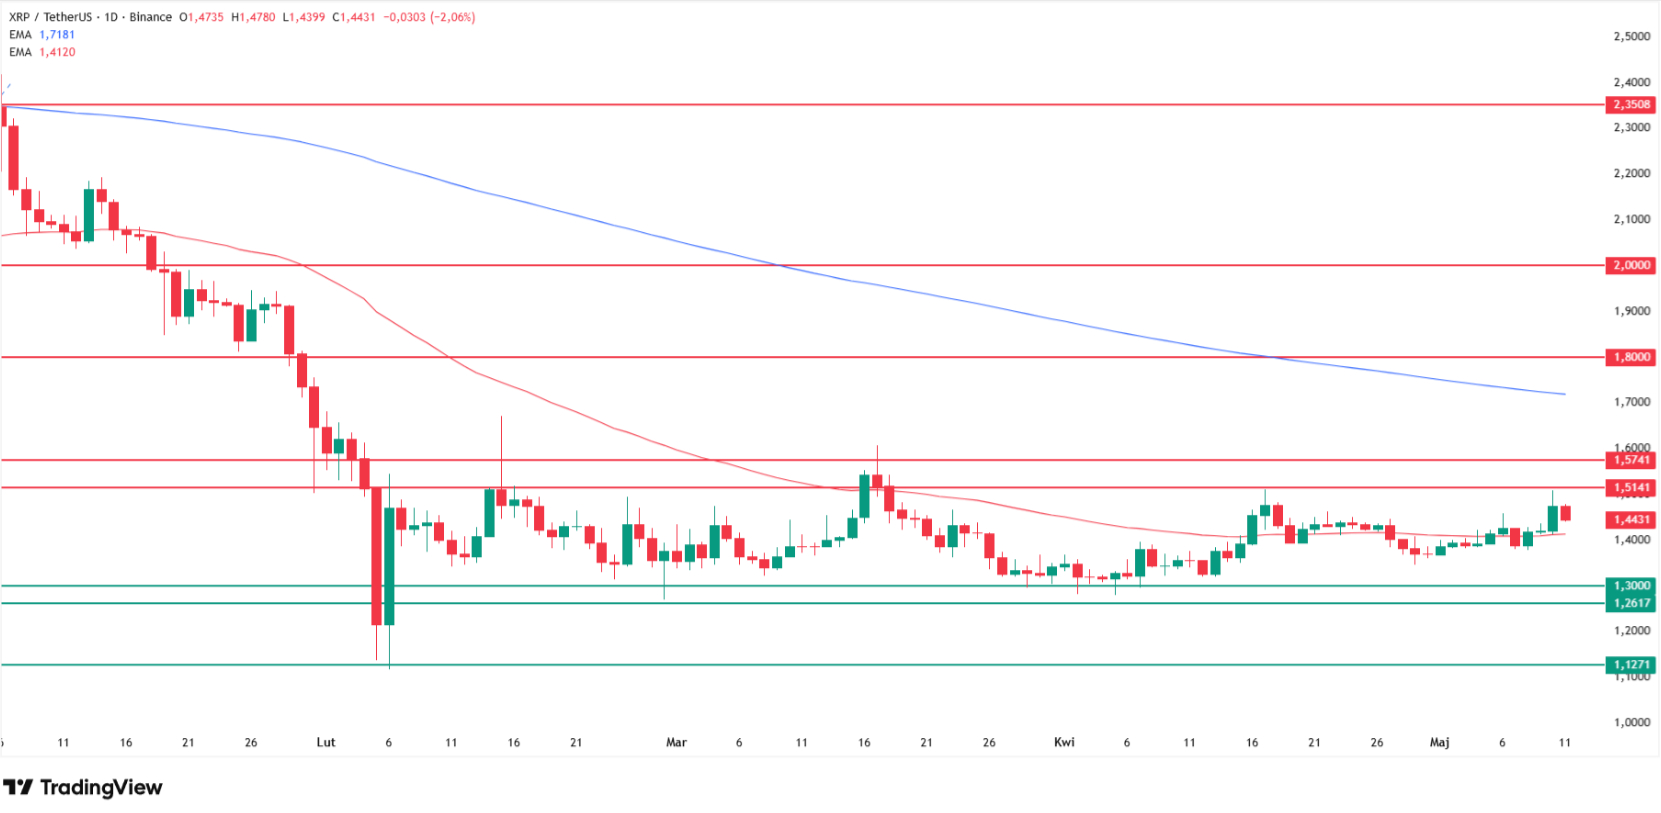
The
technical picture is what it has been for three months. XRP has traded in a
tight box since early February, with the upper boundary at $1.51 to $1.57 and
the lower boundary near $1.30. Sunday's rally pushed price toward the supply
zone at $1.45 before fading back below it Monday, where XRP is now losing 1.6%
on the session.
This is the
same range tested in February, March, briefly in April, and again on Sunday.
Every test of the upper boundary has been rejected, exactly as I mapped in my early-March analysis of the same
consolidation. The
chart pattern is consolidation, not breakout.
In over 15
years of trading and covering markets at FinanceMagnates.com, where you can
find my full coverage on my analyst page, I have learned that the biggest one-day moves
often come at the worst time for trend continuation, at the upper boundary of a
range, just before the rejection candle. Sunday's bounce fits that pattern. The
pin-bar style rejection at $1.45 on Monday confirms it.
Even if XRP
broke the $1.57 ceiling, the next overhead wall sits at the 200-day MA near
$1.72, followed by the late-2024 swing lows around $1.80. Both have rejected
price before. Below the box, the floor at $1.30 has held since February. A
daily close below $1.30 reopens the path toward $1.13, the November 2024 print.
As I outlined in my April analysis when Senate hopes briefly pushed
XRP toward $1.40, the broader bearish thesis suggesting a move toward $0.53
stays operative as long as the $1.30 floor remains the line of last defense.
How high (or low) can XRP price go? XRP technical analysis. Source: Tradingview.com
Howard told
FinanceMagnates.com that a modest pullback following the recent rally would not
be a surprise, with the broader institutional trend likely to persist into the
second half of the year. That view aligns with my chart read: a structural
floor under price, but no near-term breakout setup until the CLARITY Act
delivers.
Key XRP price levels (May
11, 2026):
Level
Type
Notes
$1.80
Resistance
Late-2024
swing lows, secondary overhead
$1.72
200-day MA
Bullish-bearish trend separator
$1.57
Resistance
Upper
consolidation boundary, multiple rejections since February
$1.51
Resistance
Lower
edge of the $1.51 to $1.57 supply zone
$1.45
Resistance
Monday's
rejection level, immediate ceiling
$1.30
Support
February
to April consolidation floor
$1.13
Support
November 2024 lows, deeper support
$0.53
Bear target
My prior
bearish thesis if $1.13 breaks
How High Can XRP Go? XRP
Price Predictions for 2026
Source
Target
My one-sentence view
Standard Chartered (Kendrick, bull)
$8.00 by end-2026
Needs
both CLARITY passage and $10B ETF inflows, both still binary
Standard Chartered (base case)
$2.80
More
credible given the actual ETF run-rate, even if CLARITY slips
24/7 Wall St. (committee pass)
$1.70 to $2.00
Aligns
with my $1.72 200 MA and $1.80 prior swing low resistance cluster
24/7 Wall St. (markup fails)
$1.00 to $1.30
Maps to
my prior bearish thesis territory
Bitrue Research Labs
$2.25 to $2.50
Requires
breaking the $1.57 ceiling first, which has held since February
My
bearish thesis (March 30 analysis)
$0.53
Operative
if $1.30 support fails and CLARITY shelves to 2030
XRP Frequently Asked
Questions
Why is XRP price going up
today?
XRP rallied
roughly 6% on Sunday, May 10, 2026, the largest one-day move in two months,
after the Senate Banking Committee scheduled the CLARITY Act markup for
Thursday, May 14. The bill would lock XRP's commodity classification into
federal law. Spot XRP ETF inflows of $28.1 million between May 4 and May 6
reinforced the bid, with cumulative inflows since launch now near $1.32
billion.
How high can XRP go in
2026?
The
credible 2026 range sits between $2.25 and $8.00, contingent on the CLARITY Act
passing Congress. Standard Chartered targets $8.00 if CLARITY passes and ETF
inflows reach $10 billion, falling to $2.80 in the base case. Bitrue Research
Labs targets $2.25 to $2.50 by year-end.
Can XRP fall to 50 cents
in 2026?
It is
possible but requires two conditions: a failed CLARITY Act markup (sending the
bill to 2030) and a daily close below the $1.30 consolidation floor. My bearish
thesis from the March 30 analysis targets $0.53, which aligns with the November
2024 lows. The base case absent legislation is sideways grind between $1.30 and
$1.40, with a tail risk toward $1.00 if Bitcoin weakens.
XRP traded
at $1.43 on Monday, May 11, 2026, losing 1.6% and slipping back below the $1.45
supply zone after Sunday's session delivered a 6%+ rally, the strongest one-day
advance in roughly two months.
Why is XRP
price rising into the same overhead supply that has rejected price four times
since February? The answer is on Tim Scott's Senate Banking calendar. The
Senate Banking Committee scheduled the long-delayed CLARITY Act markup for
Thursday, May 14, ending months of legislative gridlock and pulling
institutional capital back off the sidelines.
XRP ETF
inflows now sit near $1.32 billion since the November 2025 launch.
Follow
me on X for real-time crypto market analysis: @ChmielDk
Why XRP Price Is Going Up
Today? CLARITY Act Markup Becomes the Setup
The Senate
Banking Committee, under Chairman Tim Scott, scheduled the CLARITY Act markup
for Thursday, May 14 at 10:30 AM EST, ending months of procedural delay. The
bill would lock XRP's commodity classification into federal law, a designation
the SEC and CFTC already granted jointly on March 17 but one no future agency
could reverse if Congress enacts it.
The
political calendar is unforgiving. If Tim Scott does not move the bill before
the Memorial Day recess on May 21, the next viable legislative window slides
into 2030, when a new Congress would have to restart the process. Polymarket
currently prices the probability of the CLARITY Act passing in 2026 at 62%. The
market is leaning bullish on Thursday's procedural vote.
Paul
Howard, Senior Director at Wincent, framed current XRP pricing as "an
opportunity for accumulation and strategic positioning" ahead of the May
14 markup. Howard cited $2.4 billion in monthly ETF inflows across crypto and
rising expectations of a favorable CLARITY Act outcome at the Consensus Miami
crypto conference as the institutional thesis.
Spot XRP
ETFs absorbed $28.1 million in net inflows across three days between May 4 and
May 6, and roughly $81.59 million across April. Cumulative inflows since the
November 2025 launch now sit near $1.32 billion, with positive weekly flows in
approximately 77% of weeks. The seven listed spot XRP ETFs hold a combined
$1.53 billion in assets under management.
The
technical picture is what it has been for three months. XRP has traded in a
tight box since early February, with the upper boundary at $1.51 to $1.57 and
the lower boundary near $1.30. Sunday's rally pushed price toward the supply
zone at $1.45 before fading back below it Monday, where XRP is now losing 1.6%
on the session.
This is the
same range tested in February, March, briefly in April, and again on Sunday.
Every test of the upper boundary has been rejected, exactly as I mapped in my early-March analysis of the same
consolidation. The
chart pattern is consolidation, not breakout.
In over 15
years of trading and covering markets at FinanceMagnates.com, where you can
find my full coverage on my analyst page, I have learned that the biggest one-day moves
often come at the worst time for trend continuation, at the upper boundary of a
range, just before the rejection candle. Sunday's bounce fits that pattern. The
pin-bar style rejection at $1.45 on Monday confirms it.
Even if XRP
broke the $1.57 ceiling, the next overhead wall sits at the 200-day MA near
$1.72, followed by the late-2024 swing lows around $1.80. Both have rejected
price before. Below the box, the floor at $1.30 has held since February. A
daily close below $1.30 reopens the path toward $1.13, the November 2024 print.
As I outlined in my April analysis when Senate hopes briefly pushed
XRP toward $1.40, the broader bearish thesis suggesting a move toward $0.53
stays operative as long as the $1.30 floor remains the line of last defense.
How high (or low) can XRP price go? XRP technical analysis. Source: Tradingview.com
Howard told
FinanceMagnates.com that a modest pullback following the recent rally would not
be a surprise, with the broader institutional trend likely to persist into the
second half of the year. That view aligns with my chart read: a structural
floor under price, but no near-term breakout setup until the CLARITY Act
delivers.
Key XRP price levels (May
11, 2026):
Level
Type
Notes
$1.80
Resistance
Late-2024
swing lows, secondary overhead
$1.72
200-day MA
Bullish-bearish trend separator
$1.57
Resistance
Upper
consolidation boundary, multiple rejections since February
$1.51
Resistance
Lower
edge of the $1.51 to $1.57 supply zone
$1.45
Resistance
Monday's
rejection level, immediate ceiling
$1.30
Support
February
to April consolidation floor
$1.13
Support
November 2024 lows, deeper support
$0.53
Bear target
My prior
bearish thesis if $1.13 breaks
How High Can XRP Go? XRP
Price Predictions for 2026
Source
Target
My one-sentence view
Standard Chartered (Kendrick, bull)
$8.00 by end-2026
Needs
both CLARITY passage and $10B ETF inflows, both still binary
Standard Chartered (base case)
$2.80
More
credible given the actual ETF run-rate, even if CLARITY slips
24/7 Wall St. (committee pass)
$1.70 to $2.00
Aligns
with my $1.72 200 MA and $1.80 prior swing low resistance cluster
24/7 Wall St. (markup fails)
$1.00 to $1.30
Maps to
my prior bearish thesis territory
Bitrue Research Labs
$2.25 to $2.50
Requires
breaking the $1.57 ceiling first, which has held since February
My
bearish thesis (March 30 analysis)
$0.53
Operative
if $1.30 support fails and CLARITY shelves to 2030
XRP Frequently Asked
Questions
Why is XRP price going up
today?
XRP rallied
roughly 6% on Sunday, May 10, 2026, the largest one-day move in two months,
after the Senate Banking Committee scheduled the CLARITY Act markup for
Thursday, May 14. The bill would lock XRP's commodity classification into
federal law. Spot XRP ETF inflows of $28.1 million between May 4 and May 6
reinforced the bid, with cumulative inflows since launch now near $1.32
billion.
How high can XRP go in
2026?
The
credible 2026 range sits between $2.25 and $8.00, contingent on the CLARITY Act
passing Congress. Standard Chartered targets $8.00 if CLARITY passes and ETF
inflows reach $10 billion, falling to $2.80 in the base case. Bitrue Research
Labs targets $2.25 to $2.50 by year-end.
Can XRP fall to 50 cents
in 2026?
It is
possible but requires two conditions: a failed CLARITY Act markup (sending the
bill to 2030) and a daily close below the $1.30 consolidation floor. My bearish
thesis from the March 30 analysis targets $0.53, which aligns with the November
2024 lows. The base case absent legislation is sideways grind between $1.30 and
$1.40, with a tail risk toward $1.00 if Bitcoin weakens.
Damian Chmiel is a Senior Analyst & Editor at Finance Magnates with more than 15 years of experience in the CFD and online trading industry. Active as both a trader and journalist since 2010, he focuses on broker coverage, fintech innovation, and regulatory developments across Europe, the Middle East, and Asia.
His work includes interviews with C-level leaders at major brokerages and fintech platforms, as well as co-authoring Finance Magnates’ quarterly industry benchmarking reports. Damian’s reporting is data-driven, market-aware, and grounded in direct industry engagement. His analysis and commentary have also been cited by external media outlets, including Investing.com, Binance, The Asset, Stockhead, and Dispatch.
Education:
MA in Finance and Accounting, Cracow University of Economics
How Low Can Silver Price Go? The New XAG/USD Analysis Suggests -50% Bearish Targer
Featured Videos
Base Markets CEO: Why Trust Matters More Than Bonuses | Alex Kolpokchi Interview
Base Markets CEO: Why Trust Matters More Than Bonuses | Alex Kolpokchi Interview
Base Markets CEO: Why Trust Matters More Than Bonuses | Alex Kolpokchi Interview
Base Markets CEO: Why Trust Matters More Than Bonuses | Alex Kolpokchi Interview
Is it still possible to build a successful brokerage by putting clients first instead of relying on flashy promotions?
In this exclusive Finance Magnates Executive Interview, Yam Yehoshua, Chief Editor at Finance Magnates, sits down with Alex Kolpokchi, Co-Founder & CEO of Base Markets, to discuss the company's vision, the lessons learned from leading brokers, and why trust, transparency and real client value are at the centre of its strategy.
During the interview, Alex shares:
- How his experience at IG and Pepperstone shaped Base Markets
- Why the company describes itself as a "no-nonsense broker"
- The importance of trust, execution and client service
- How real client feedback helped build the platform
- Why Base Markets avoided a traditional public launch
- The company's long-term plans for regulation and growth
What makes Base Markets different in today's competitive brokerage industry
💬 What do you think matters most when choosing a broker—pricing, execution, regulation or customer service? Let us know in the comments.
#BaseMarkets #Forex #CFDTrading #OnlineTrading #Brokerage #Trading #FinanceMagnates #Fintech #CEOInterview #TradingIndustry
Today's Wednesday, the 15th of July 2026, and these are our main stories: CMC Markets expands 24/5 US trading to more than 5,000 shares and ETFs, Tickmill UK partners with Interactive Brokers, and Revolut moves closer to launching crypto services in the UAE.
Today's Wednesday, the 15th of July 2026, and these are our main stories: CMC Markets expands 24/5 US trading to more than 5,000 shares and ETFs, Tickmill UK partners with Interactive Brokers, and Revolut moves closer to launching crypto services in the UAE.
Today's Wednesday, the 15th of July 2026, and these are our main stories: CMC Markets expands 24/5 US trading to more than 5,000 shares and ETFs, Tickmill UK partners with Interactive Brokers, and Revolut moves closer to launching crypto services in the UAE.
Today's Wednesday, the 15th of July 2026, and these are our main stories: CMC Markets expands 24/5 US trading to more than 5,000 shares and ETFs, Tickmill UK partners with Interactive Brokers, and Revolut moves closer to launching crypto services in the UAE.
Today's Wednesday, the 15th of July 2026, and these are our main stories: CMC Markets expands 24/5 US trading to more than 5,000 shares and ETFs, Tickmill UK partners with Interactive Brokers, and Revolut moves closer to launching crypto services in the UAE.
Today's Wednesday, the 15th of July 2026, and these are our main stories: CMC Markets expands 24/5 US trading to more than 5,000 shares and ETFs, Tickmill UK partners with Interactive Brokers, and Revolut moves closer to launching crypto services in the UAE.
FM Daily Brief – 14 July 2026
FM Daily Brief – 14 July 2026
FM Daily Brief – 14 July 2026
FM Daily Brief – 14 July 2026
FM Daily Brief – 14 July 2026
FM Daily Brief – 14 July 2026
Today's Tuesday, the 14th of July 2026, and these are our main stories: NinjaTrader cuts ties with Alpha Futures, Russia opens regulated crypto CFDs, and ActivTrades reshapes its group structure.
Today's Tuesday, the 14th of July 2026, and these are our main stories: NinjaTrader cuts ties with Alpha Futures, Russia opens regulated crypto CFDs, and ActivTrades reshapes its group structure.
Today's Tuesday, the 14th of July 2026, and these are our main stories: NinjaTrader cuts ties with Alpha Futures, Russia opens regulated crypto CFDs, and ActivTrades reshapes its group structure.
Today's Tuesday, the 14th of July 2026, and these are our main stories: NinjaTrader cuts ties with Alpha Futures, Russia opens regulated crypto CFDs, and ActivTrades reshapes its group structure.
Today's Tuesday, the 14th of July 2026, and these are our main stories: NinjaTrader cuts ties with Alpha Futures, Russia opens regulated crypto CFDs, and ActivTrades reshapes its group structure.
Today's Tuesday, the 14th of July 2026, and these are our main stories: NinjaTrader cuts ties with Alpha Futures, Russia opens regulated crypto CFDs, and ActivTrades reshapes its group structure.
What's the one piece of advice that's shaped your success?
We asked finance leaders at iFX EXPO International, and their answers couldn't have been more different.
Scott Chiriaco shares why discipline is everything, while Charles Savva believes success starts with balance.
Which perspective do you agree with?
#FinanceMagnates #iFXEXPO #Leadership #Business #Fintech #Shorts
FM Daily Brief – 13 July 2026
FM Daily Brief – 13 July 2026
FM Daily Brief – 13 July 2026
FM Daily Brief – 13 July 2026
FM Daily Brief – 13 July 2026
FM Daily Brief – 13 July 2026
Today is Monday, the 13th of July 2026, and these are our main stories: Plus500 reports stronger first-half revenue, Asic cuts retail CFD levies in, and Pepperstone expands its perpetual CFD plans.
Today is Monday, the 13th of July 2026, and these are our main stories: Plus500 reports stronger first-half revenue, Asic cuts retail CFD levies in, and Pepperstone expands its perpetual CFD plans.
Today is Monday, the 13th of July 2026, and these are our main stories: Plus500 reports stronger first-half revenue, Asic cuts retail CFD levies in, and Pepperstone expands its perpetual CFD plans.
Today is Monday, the 13th of July 2026, and these are our main stories: Plus500 reports stronger first-half revenue, Asic cuts retail CFD levies in, and Pepperstone expands its perpetual CFD plans.
Today is Monday, the 13th of July 2026, and these are our main stories: Plus500 reports stronger first-half revenue, Asic cuts retail CFD levies in, and Pepperstone expands its perpetual CFD plans.
Today is Monday, the 13th of July 2026, and these are our main stories: Plus500 reports stronger first-half revenue, Asic cuts retail CFD levies in, and Pepperstone expands its perpetual CFD plans.