XRP traded at $1.125 on Friday, June 5, 2026, down 3.75% on its fifth straight losing session and a fresh four-month low for the token.
My first bear target, the $1.1271 February low, is under test right now, and a daily close below it would open the road toward $0.5287.
Why XRP price is going down today? Check the current XRP/USDT technical analysis
XRP traded
at $1.125 on Friday, June 5, 2026, down 3.75% on the session and printing a
fresh four-month low as the token logged its fifth consecutive daily decline.
The drop
extends a slide of roughly 20% from the $1.50 to $1.60 range that capped price
through May. More than $10 billion has left XRP's market capitalization in
days, and USDC has overtaken it as the fifth-largest cryptocurrency by that
metric.
In this
article I'm looking for an answer why XRP is falling for the 5th session in a
row and I'm showing you my latest XRP price prediction based on my more than 15
years of experience as an analyst and retail trader
Follow
me on X for real-time market analysis: @ChmielDk.
Why XRP Is Falling?
The
clearest driver runs through institutional product flows. XRP-linked spot ETFs
posted their longest net-inflow streak of 2026 through late April, a bid that
defended $1.40 as a floor, before that streak broke on April 30 and flipped
$1.40 into resistance within days.
XRP ETFs
still pulled a record $131.94 million in May, yet inflows no longer outpaced
spot selling. The result was a market that stopped reacting to bullish supply
data, a pattern that often appears late in downtrends.
As I noted
when the CLARITY vote first loomed, regulatory wins alone have not
sustained a bid. The SEC and CFTC already classified XRP as a digital commodity
on March 17, and price has fallen since.
The selling,
however, has not been matched by on-chain weakness. Active XRP Ledger addresses
hit a five-week high of 46,767 in mid-May, the same stretch when price was
rejected at $1.55, a divergence between rising usage and a capped quote.
XRP ETF
assets under management also set records in May while spot held near $1.43, a
basis compression that historically precedes a sharp move rather than a quiet
one.
The
selloff rests on three converging signals:
ETF demand reversed, with the longest 2026 inflow
streak ending April 30 and $1.40 flipping to resistance.
Macro risk-off deepened as Bitcoin fell
toward $67,000 and traders repriced Fed rate-cut odds after firm US labor
data.
Accumulation diverged from
price, as
whale wallets hit a record 332,230 addresses and 25 million XRP left
exchanges without lifting the spot bid.
XRP/USDT Technical
Analysis
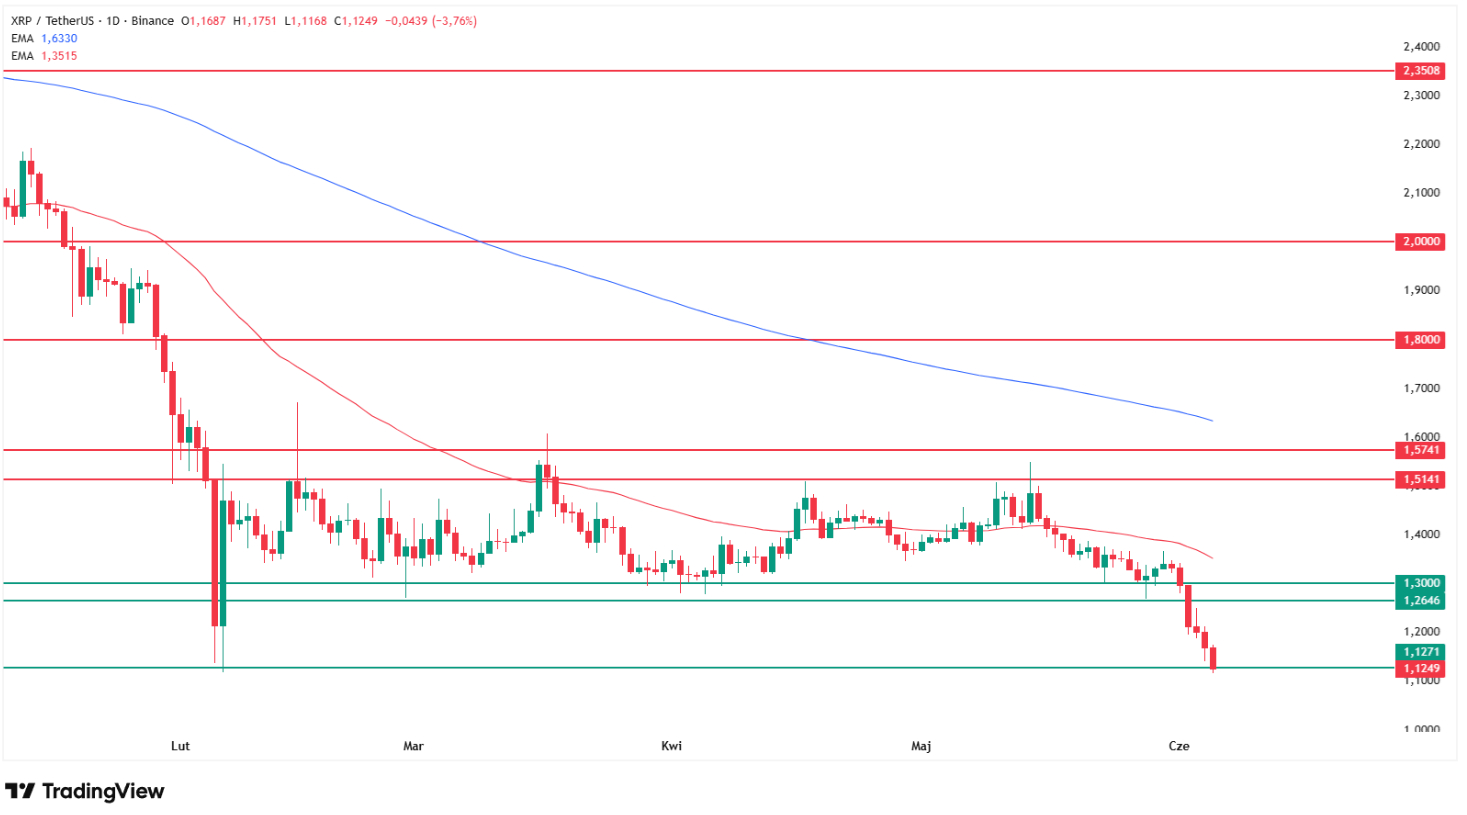
My chart
shows the first bear target being reached in real time. The $1.1271 February
low, the level I called as the initial downside marker, is under test on the
fifth straight red session.
In my March analysis I wrote that a break below the
$1.12 to $1.26 February band opens the path to $0.53, and price is now pressing
the bottom of that band. XRP now sits nearly 70% below its July 2025 cycle high
of $3.65, and each failed bounce since has carved a lower high.
In more
than 15 years reading these charts, documented on my analyst page, I have learned that a level tested four times
rarely holds the fifth. Structure backs the bias: XRP trades below both the
50-day EMA near $1.35 and the 200-day EMA near $1.63, and both averages slope
lower.
XRP/USDT daily chart. A fifth straight down session pushed XRP to $1.125. Source: TradingView.
Level
Type
Notes
$1.5741
Resistance
May
supply zone, below 200 EMA
$1.5141
Resistance
Prior consolidation cap
$1.30
Resistance
Broken support, now overhead
$1.2646
Resistance
First
reclaim level on any bounce
$1.1271
Support
February
low, first bear target under test
$0.5287
Support
100%
Fibonacci extension, ultra-bear target
How Low Can XRP GO?
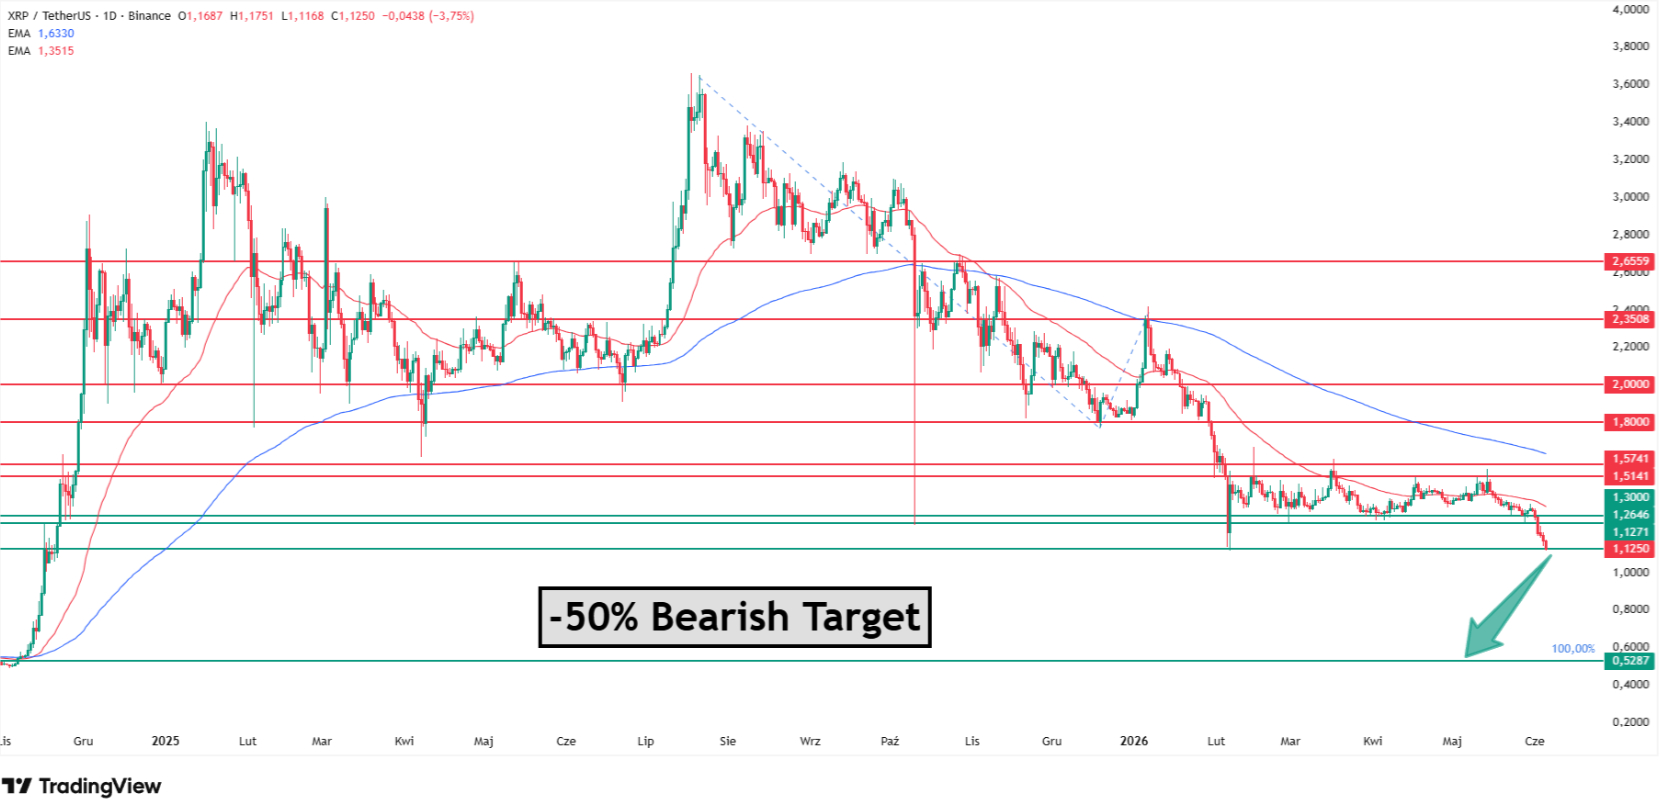
A daily
close below $1.1271 is the trigger I am watching. It would leave no meaningful
chart support until $0.5287, the 100% Fibonacci extension and a level last
traded in November 2024.
That is the
ultra-bearish target I have carried since late March, not a fresh call. On the upside,
reclaiming $1.2646 and then $1.30 would be the first sign the breakdown is
corrective rather than structural.
Volume
confirms the character of the move. Friday's decline ran on elevated volume
against the prior two weeks, consistent with a liquidation cascade rather than
orderly distribution, and roughly $30 million in leveraged positions were wiped
out during the slide.
Seasonality
compounds the pressure, with CryptoRank data showing XRP has closed June in the
red 81.8% of the time since 2014, at a median loss of 8.49%.
A daily close below the $1.1271 February low opens the path toward $0.5287. Source: TradingView.
Bear case:
Fifth straight red session with
no inflow bid to absorb selling.
$1.30 and $1.2646 flipped from
support to resistance.
The level
under test is $1.1271, the February low and my first bear target. A daily close
below it removes the last meaningful chart support before $0.5287, the 100%
Fibonacci extension. On the way down, there is little prior price memory
between those two zones to slow a decline.
Could XRP really fall to
$0.53?
$0.5287 is
the 100% Fibonacci extension and a price last traded in November 2024. My chart
treats it as the ultra-bearish target, valid only on a confirmed daily close
below the $1.1271 February low. It is a scenario with a defined trigger, not a
base case for every outcome.
Will the CLARITY Act push
XRP higher?
The bill
passed the Senate Banking Committee 15 to 9 on May 14 and reached the Senate
calendar on June 1. A floor vote before July 4 could trigger a squeeze given
heavy short positioning. So far in 2026, regulatory milestones have not
produced a sustained bid, and price kept falling after the March commodity
classification.
What would invalidate the
bearish XRP setup?
A daily
close back above $1.2646, followed by $1.30, would be the first evidence the
breakdown is corrective. Reclaiming the 50-day EMA near $1.35 would matter
more, since price has traded below it for the duration of this slide. Until
then, the structure of lower highs and lower lows stays intact.
XRP traded
at $1.125 on Friday, June 5, 2026, down 3.75% on the session and printing a
fresh four-month low as the token logged its fifth consecutive daily decline.
The drop
extends a slide of roughly 20% from the $1.50 to $1.60 range that capped price
through May. More than $10 billion has left XRP's market capitalization in
days, and USDC has overtaken it as the fifth-largest cryptocurrency by that
metric.
In this
article I'm looking for an answer why XRP is falling for the 5th session in a
row and I'm showing you my latest XRP price prediction based on my more than 15
years of experience as an analyst and retail trader
Follow
me on X for real-time market analysis: @ChmielDk.
Why XRP Is Falling?
The
clearest driver runs through institutional product flows. XRP-linked spot ETFs
posted their longest net-inflow streak of 2026 through late April, a bid that
defended $1.40 as a floor, before that streak broke on April 30 and flipped
$1.40 into resistance within days.
XRP ETFs
still pulled a record $131.94 million in May, yet inflows no longer outpaced
spot selling. The result was a market that stopped reacting to bullish supply
data, a pattern that often appears late in downtrends.
As I noted
when the CLARITY vote first loomed, regulatory wins alone have not
sustained a bid. The SEC and CFTC already classified XRP as a digital commodity
on March 17, and price has fallen since.
The selling,
however, has not been matched by on-chain weakness. Active XRP Ledger addresses
hit a five-week high of 46,767 in mid-May, the same stretch when price was
rejected at $1.55, a divergence between rising usage and a capped quote.
XRP ETF
assets under management also set records in May while spot held near $1.43, a
basis compression that historically precedes a sharp move rather than a quiet
one.
The
selloff rests on three converging signals:
ETF demand reversed, with the longest 2026 inflow
streak ending April 30 and $1.40 flipping to resistance.
Macro risk-off deepened as Bitcoin fell
toward $67,000 and traders repriced Fed rate-cut odds after firm US labor
data.
Accumulation diverged from
price, as
whale wallets hit a record 332,230 addresses and 25 million XRP left
exchanges without lifting the spot bid.
XRP/USDT Technical
Analysis
My chart
shows the first bear target being reached in real time. The $1.1271 February
low, the level I called as the initial downside marker, is under test on the
fifth straight red session.
In my March analysis I wrote that a break below the
$1.12 to $1.26 February band opens the path to $0.53, and price is now pressing
the bottom of that band. XRP now sits nearly 70% below its July 2025 cycle high
of $3.65, and each failed bounce since has carved a lower high.
In more
than 15 years reading these charts, documented on my analyst page, I have learned that a level tested four times
rarely holds the fifth. Structure backs the bias: XRP trades below both the
50-day EMA near $1.35 and the 200-day EMA near $1.63, and both averages slope
lower.
XRP/USDT daily chart. A fifth straight down session pushed XRP to $1.125. Source: TradingView.
Level
Type
Notes
$1.5741
Resistance
May
supply zone, below 200 EMA
$1.5141
Resistance
Prior consolidation cap
$1.30
Resistance
Broken support, now overhead
$1.2646
Resistance
First
reclaim level on any bounce
$1.1271
Support
February
low, first bear target under test
$0.5287
Support
100%
Fibonacci extension, ultra-bear target
How Low Can XRP GO?
A daily
close below $1.1271 is the trigger I am watching. It would leave no meaningful
chart support until $0.5287, the 100% Fibonacci extension and a level last
traded in November 2024.
That is the
ultra-bearish target I have carried since late March, not a fresh call. On the upside,
reclaiming $1.2646 and then $1.30 would be the first sign the breakdown is
corrective rather than structural.
Volume
confirms the character of the move. Friday's decline ran on elevated volume
against the prior two weeks, consistent with a liquidation cascade rather than
orderly distribution, and roughly $30 million in leveraged positions were wiped
out during the slide.
Seasonality
compounds the pressure, with CryptoRank data showing XRP has closed June in the
red 81.8% of the time since 2014, at a median loss of 8.49%.
A daily close below the $1.1271 February low opens the path toward $0.5287. Source: TradingView.
Bear case:
Fifth straight red session with
no inflow bid to absorb selling.
$1.30 and $1.2646 flipped from
support to resistance.
The level
under test is $1.1271, the February low and my first bear target. A daily close
below it removes the last meaningful chart support before $0.5287, the 100%
Fibonacci extension. On the way down, there is little prior price memory
between those two zones to slow a decline.
Could XRP really fall to
$0.53?
$0.5287 is
the 100% Fibonacci extension and a price last traded in November 2024. My chart
treats it as the ultra-bearish target, valid only on a confirmed daily close
below the $1.1271 February low. It is a scenario with a defined trigger, not a
base case for every outcome.
Will the CLARITY Act push
XRP higher?
The bill
passed the Senate Banking Committee 15 to 9 on May 14 and reached the Senate
calendar on June 1. A floor vote before July 4 could trigger a squeeze given
heavy short positioning. So far in 2026, regulatory milestones have not
produced a sustained bid, and price kept falling after the March commodity
classification.
What would invalidate the
bearish XRP setup?
A daily
close back above $1.2646, followed by $1.30, would be the first evidence the
breakdown is corrective. Reclaiming the 50-day EMA near $1.35 would matter
more, since price has traded below it for the duration of this slide. Until
then, the structure of lower highs and lower lows stays intact.
Damian Chmiel is a Senior Analyst & Editor at Finance Magnates with more than 15 years of experience in the CFD and online trading industry. Active as both a trader and journalist since 2010, he focuses on broker coverage, fintech innovation, and regulatory developments across Europe, the Middle East, and Asia.
His work includes interviews with C-level leaders at major brokerages and fintech platforms, as well as co-authoring Finance Magnates’ quarterly industry benchmarking reports. Damian’s reporting is data-driven, market-aware, and grounded in direct industry engagement. His analysis and commentary have also been cited by external media outlets, including Investing.com, Binance, The Asset, Stockhead, and Dispatch.
Education:
MA in Finance and Accounting, Cracow University of Economics
How Low Can Silver Price Go? The New XAG/USD Analysis Suggests -50% Bearish Targer
Featured Videos
Base Markets CEO: Why Trust Matters More Than Bonuses | Alex Kolpokchi Interview
Base Markets CEO: Why Trust Matters More Than Bonuses | Alex Kolpokchi Interview
Base Markets CEO: Why Trust Matters More Than Bonuses | Alex Kolpokchi Interview
Base Markets CEO: Why Trust Matters More Than Bonuses | Alex Kolpokchi Interview
Is it still possible to build a successful brokerage by putting clients first instead of relying on flashy promotions?
In this exclusive Finance Magnates Executive Interview, Yam Yehoshua, Chief Editor at Finance Magnates, sits down with Alex Kolpokchi, Co-Founder & CEO of Base Markets, to discuss the company's vision, the lessons learned from leading brokers, and why trust, transparency and real client value are at the centre of its strategy.
During the interview, Alex shares:
- How his experience at IG and Pepperstone shaped Base Markets
- Why the company describes itself as a "no-nonsense broker"
- The importance of trust, execution and client service
- How real client feedback helped build the platform
- Why Base Markets avoided a traditional public launch
- The company's long-term plans for regulation and growth
What makes Base Markets different in today's competitive brokerage industry
💬 What do you think matters most when choosing a broker—pricing, execution, regulation or customer service? Let us know in the comments.
#BaseMarkets #Forex #CFDTrading #OnlineTrading #Brokerage #Trading #FinanceMagnates #Fintech #CEOInterview #TradingIndustry
Today's Wednesday, the 15th of July 2026, and these are our main stories: CMC Markets expands 24/5 US trading to more than 5,000 shares and ETFs, Tickmill UK partners with Interactive Brokers, and Revolut moves closer to launching crypto services in the UAE.
Today's Wednesday, the 15th of July 2026, and these are our main stories: CMC Markets expands 24/5 US trading to more than 5,000 shares and ETFs, Tickmill UK partners with Interactive Brokers, and Revolut moves closer to launching crypto services in the UAE.
Today's Wednesday, the 15th of July 2026, and these are our main stories: CMC Markets expands 24/5 US trading to more than 5,000 shares and ETFs, Tickmill UK partners with Interactive Brokers, and Revolut moves closer to launching crypto services in the UAE.
Today's Wednesday, the 15th of July 2026, and these are our main stories: CMC Markets expands 24/5 US trading to more than 5,000 shares and ETFs, Tickmill UK partners with Interactive Brokers, and Revolut moves closer to launching crypto services in the UAE.
Today's Wednesday, the 15th of July 2026, and these are our main stories: CMC Markets expands 24/5 US trading to more than 5,000 shares and ETFs, Tickmill UK partners with Interactive Brokers, and Revolut moves closer to launching crypto services in the UAE.
Today's Wednesday, the 15th of July 2026, and these are our main stories: CMC Markets expands 24/5 US trading to more than 5,000 shares and ETFs, Tickmill UK partners with Interactive Brokers, and Revolut moves closer to launching crypto services in the UAE.
FM Daily Brief – 14 July 2026
FM Daily Brief – 14 July 2026
FM Daily Brief – 14 July 2026
FM Daily Brief – 14 July 2026
FM Daily Brief – 14 July 2026
FM Daily Brief – 14 July 2026
Today's Tuesday, the 14th of July 2026, and these are our main stories: NinjaTrader cuts ties with Alpha Futures, Russia opens regulated crypto CFDs, and ActivTrades reshapes its group structure.
Today's Tuesday, the 14th of July 2026, and these are our main stories: NinjaTrader cuts ties with Alpha Futures, Russia opens regulated crypto CFDs, and ActivTrades reshapes its group structure.
Today's Tuesday, the 14th of July 2026, and these are our main stories: NinjaTrader cuts ties with Alpha Futures, Russia opens regulated crypto CFDs, and ActivTrades reshapes its group structure.
Today's Tuesday, the 14th of July 2026, and these are our main stories: NinjaTrader cuts ties with Alpha Futures, Russia opens regulated crypto CFDs, and ActivTrades reshapes its group structure.
Today's Tuesday, the 14th of July 2026, and these are our main stories: NinjaTrader cuts ties with Alpha Futures, Russia opens regulated crypto CFDs, and ActivTrades reshapes its group structure.
Today's Tuesday, the 14th of July 2026, and these are our main stories: NinjaTrader cuts ties with Alpha Futures, Russia opens regulated crypto CFDs, and ActivTrades reshapes its group structure.
What's the one piece of advice that's shaped your success?
We asked finance leaders at iFX EXPO International, and their answers couldn't have been more different.
Scott Chiriaco shares why discipline is everything, while Charles Savva believes success starts with balance.
Which perspective do you agree with?
#FinanceMagnates #iFXEXPO #Leadership #Business #Fintech #Shorts
FM Daily Brief – 13 July 2026
FM Daily Brief – 13 July 2026
FM Daily Brief – 13 July 2026
FM Daily Brief – 13 July 2026
FM Daily Brief – 13 July 2026
FM Daily Brief – 13 July 2026
Today is Monday, the 13th of July 2026, and these are our main stories: Plus500 reports stronger first-half revenue, Asic cuts retail CFD levies in, and Pepperstone expands its perpetual CFD plans.
Today is Monday, the 13th of July 2026, and these are our main stories: Plus500 reports stronger first-half revenue, Asic cuts retail CFD levies in, and Pepperstone expands its perpetual CFD plans.
Today is Monday, the 13th of July 2026, and these are our main stories: Plus500 reports stronger first-half revenue, Asic cuts retail CFD levies in, and Pepperstone expands its perpetual CFD plans.
Today is Monday, the 13th of July 2026, and these are our main stories: Plus500 reports stronger first-half revenue, Asic cuts retail CFD levies in, and Pepperstone expands its perpetual CFD plans.
Today is Monday, the 13th of July 2026, and these are our main stories: Plus500 reports stronger first-half revenue, Asic cuts retail CFD levies in, and Pepperstone expands its perpetual CFD plans.
Today is Monday, the 13th of July 2026, and these are our main stories: Plus500 reports stronger first-half revenue, Asic cuts retail CFD levies in, and Pepperstone expands its perpetual CFD plans.