
How High Can XRP Go? This Trader New Price Prediction Targets $20 Level

Tuesday, 26/05/2026 | 20:01 GMT by Damian Chmiel
  • XRP trades at $1.33 on Tuesday, May 26, 2026, down 1.3% as the post-CLARITY Act rally fades back to the May 23 range floor.
  • My chart shows price below the 50 EMA ($1.40) and 200 EMA ($1.67), with a break of $1.26 opening the path toward $1.11.
  • A trader on X targets $20 stretch and $5 primary on a weekly Fibonacci structure, against a daily setup my analysis reads as bearish.
Two xrp tokens standing in the front of candle chart
What is the current XRP price today? Let's check the technical analysis and the price predictions

XRP traded at $1.33 on Tuesday, May 26, 2026, down 1.3% on the session as the post-CLARITY Act rally that lifted the token through early May has fully unwound. The price has returned to the lower bound of the consolidation range that has defined the chart since February, with the May 23 test of $1.26 to $1.30 still the most recent floor.

Despite the Senate Banking Committee advancing the Digital Asset Market Clarity Act on May 14, XRP has closed weaker on most sessions that followed. A trader on X named Ninedex has just published a $20 stretch target on the weekly chart. My daily setup says something else.

Follow me on X for real-time market analysis: @ChmielDk.

XRP Price Analysis: CLARITY Passed, the Rally Didn't

The CLARITY Act passed the Senate Banking Committee on Thursday, May 14, 2026, in a vote that should have repriced XRP higher. The bill would lock the SEC and CFTC's March 17 digital commodity classification into federal law, removing a layer of regulatory risk that has shadowed the token since the 2020 SEC lawsuit.

XRP rallied roughly 6% on the Sunday before the vote, as my pre-vote analysis detailed. Twelve sessions later, the token has given back the entire move and more.

The miss is a flow story, not a news story. Paul Howard, Senior Director at Wincent, framed the broader crypto regime in commentary focused on Bitcoin and large-cap altcoins .

"Crypto sentiment has broadly weakened since October 10, 2025, and the market is currently operating in a low-liquidity environment with limited new catalysts," he said. The same low-liquidity dynamic explains why even a binding regulatory win cannot sustain a bid in XRP.

The drivers behind the failure to hold:

  • Senate Banking Committee passed CLARITY Act May 14, 2026; bill needs 60 floor votes next
  • Spot XRP ETF cumulative inflows above $1.3 billion since the November 2025 launch
  • Crypto-wide sentiment weakened since October 10, 2025, per Howard
  • Order-book depth at major venues insufficient to absorb headline-driven flow
  • XRP price below all major daily moving averages for the third consecutive month

Adam Haemms, Head of Asset Management at Tesseract Group, made a parallel point on Bitcoin's reaction to geopolitical headlines. "Geopolitical headlines move Bitcoin on the day, but they rarely set the regime," he said, adding that thin order books mean "every macro headline moves price further than the underlying flow would justify."

The same dynamic applies to XRP's book this month. The CLARITY pop got faded into the same supply zone that has rejected price four times since February. The FinanceMagnates.com CLARITY Act explainer details what changes if the bill clears the full Senate.

My XRP Chart Shows the Range Floor Bending

My chart shows XRP locked in a structural downtrend that has held since the $3.65 cycle high in October 2025. Tuesday's $1.33 print puts price below the 50 EMA at $1.40 and well under the 200 EMA at $1.67.

The main range that has defined trading since early February runs from $1.26 to $1.30 on the floor and $1.51 to $1.57 on the ceiling. May 15 was the last upper test. May 23 was the last lower test. Tuesday's leg lower puts the floor back under pressure.

Over my 15+ years covering retail-driven crypto flows at FinanceMagnates.com, I have seen viral weekly targets attached to XRP charts before. They rarely survive a bearish daily setup in this kind of consolidation structure.

The trigger to watch is $1.26. A clean break opens $1.11, the year-to-date low set in earlier 2026 sessions. A flush from there activates my March $0.53 ultra-bearish thesis, based on the 100% Fibonacci extension of the July-October 2025 range.
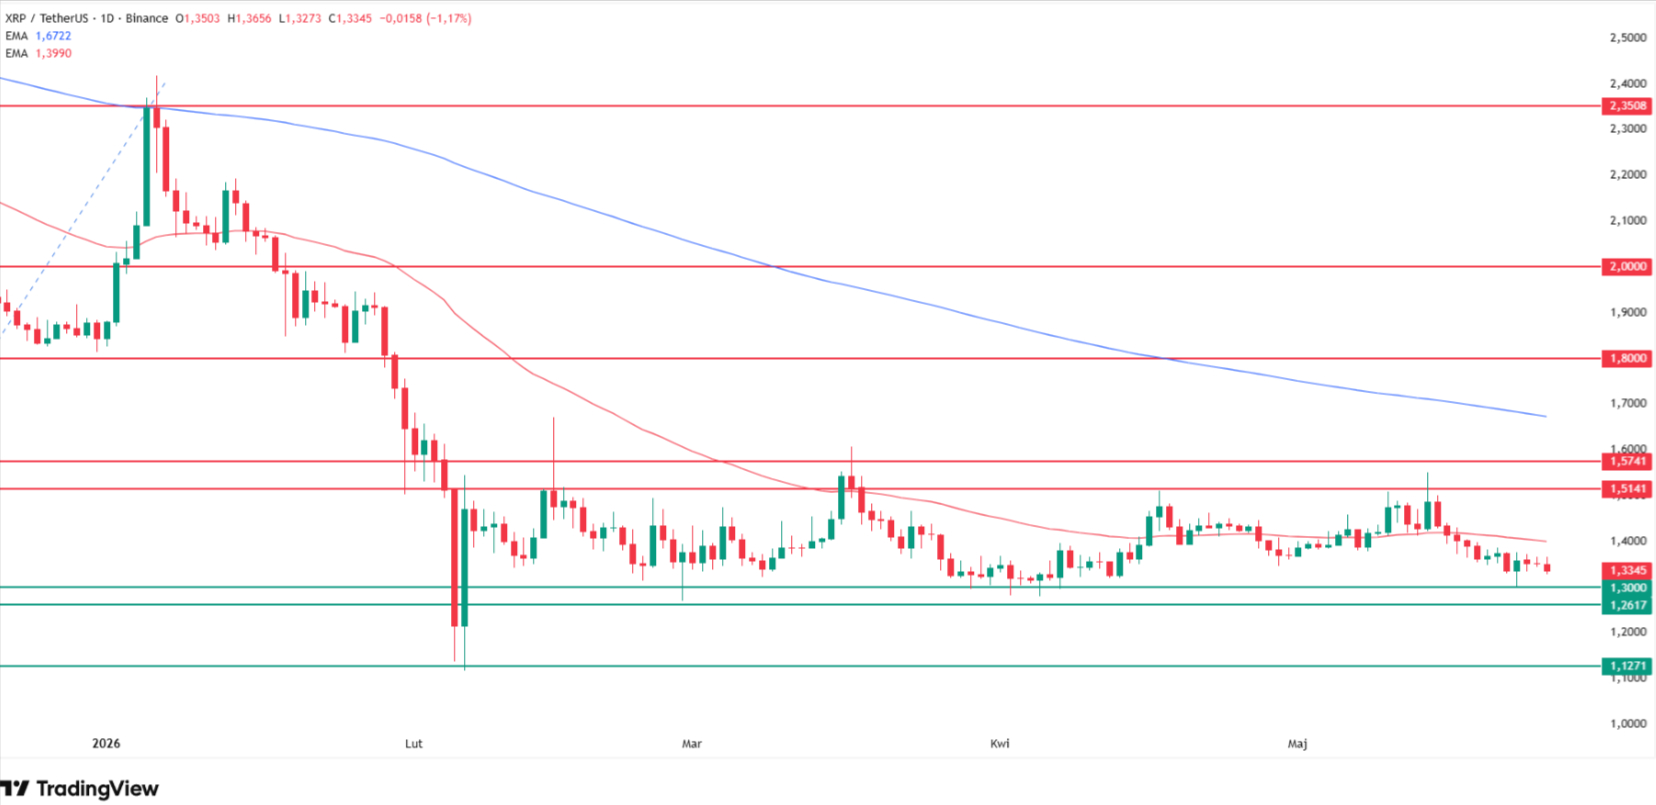
XRP price technical analysis. Source: Tradingview.com

The opposite case requires reclaiming $1.57 first, then the 200 EMA at $1.67, then the December 2025 swing low at $1.80 which now reads as resistance on the way back up. Until then the bias on my chart stays bearish.

Level

Type

Notes

$1.80

Resistance

December 2025 swing low, now ceiling

$1.67

200 EMA

Major trend resistance

$1.51 to $1.57

Range high

Last tested May 15, four prior rejections

$1.40

50 EMA

Above current price, bearish bias

$1.33

Current

Down 1.3% intraday, May 26, 2026

$1.26 to $1.30

Range low

Tested May 23

$1.11

YTD low

Downside trigger on $1.26 break

$0.53

100% Fib extension

Ultra-bear scenario

A Trader on X Sees $20 on the XRP Weekly. How High Can XRP Go?

A trader on X with the handle @ninedex23 published a weekly XRP analysis on May 25, 2026, calling for a $5 primary target and a $20 stretch case based on a Fibonacci and channel framework. The post reached roughly 8,200 views, putting it well below institutional reach but inside the same retail board universe that drove the 2017 and 2021 XRP rallies.

The setup on the weekly leans on four signals:

  • Fibonacci 0.382 ("blue line") support that held the 2022 to 2024 base
  • Long-term Stochastic rebounding from 15 points to 20 points, which @ninedex23 described as historically rare oversold for XRP
  • MACD weekly golden cross with the oscillator turning positive
  • Year-over-year channel growth slope of 32% since the 2014 to 2016 reclassification from small altcoin to major altcoin

The $5 primary target sits at the upper edge of @ninedex23's green channel. The $20 stretch target requires what the trader called an "overshooting pattern like in 18," a reference to XRP's 2018 cycle peak that ran from a sub-$0.10 base above $3. Resistance at $2 has to crack first, with the supply zone built during the 2024 to 2025 highs as the next ceiling above.

My one-line view: this is a defensible weekly read, but the weekly does not pay rent on the daily. Until $1.57 reclaims, the structure remains bearish and any $5 path runs through at least eight months of basing, not weeks.

XRP Price Predictions: From $0.53 to $20

Forecasts on XRP for the rest of 2026 span a remarkable range, from sub-$1 ultra-bear scenarios to retail moonshots. The credible institutional bull anchor remains Standard Chartered's Geoffrey Kendrick at $8 by end-2026, conditional on the CLARITY Act passing the full Senate and ETF inflows reaching $10 billion.

My view: $8 is mathematically tight even on the bullish path, given XRP would need to clear $2 first and the post-Senate Banking pop already failed.

Bitrue Research Labs sits closer to the middle at $2.25 to $2.50 for year-end 2026. My view: this is more defensible than $8 but still requires reclaiming the entire range and clearing the 200 EMA at $1.67, a setup my chart does not currently support.

The Ripple Prime $200 million credit line confirms business-side traction, but as the FinanceMagnates.com post-CLARITY framework comparison detailed, regulatory wins alone have not been enough to move price in the current low-liquidity tape.

Source

Target

Notes

@ninedex23 (X)

$5 primary / $20 stretch

Weekly Fib 0.382, MACD cross, May 25, 2026 post

Standard Chartered (Geoffrey Kendrick)

$8 by end-2026

Conditional on CLARITY full Senate pass + $10B ETF inflows

Bitrue Research Labs

$2.25 to $2.50

Year-end 2026, ETF adoption base case

Changelly

$1.36 avg / $1.76 max

December 2026 range-bound projection

Damian Chmiel (FinanceMagnates.com)

$1.11 short-term, $0.53 ultra-bear

Below all major MAs, range floor under pressure

XRP Price Prediction FAQ

Why is XRP price falling on May 26, 2026?

XRP fell 1.3% to $1.33 on Tuesday, May 26, 2026, extending a multi-session decline that wiped out the rally tied to the CLARITY Act's Senate Banking Committee passage on May 14. Price is back at the lower band of the consolidation range tested on May 23. The move reflects faded post-regulatory momentum and weak crypto-wide liquidity, with the broader trend bearish since the $3.65 cycle high in October 2025.

What is the next major XRP support level?

The next confirmed support is $1.26 to $1.30, the range floor last tested on May 23, 2026. A break opens the path to $1.11, the year-to-date low established in earlier 2026 sessions. An ultra-bearish scenario based on the 100% Fibonacci extension of the July-October 2025 range targets $0.53, a level that would represent roughly a 60% decline from current price and would only activate on extreme broader-market weakness.

Could XRP reach $20 in 2026?

A trader on X targeted $20 in a May 25, 2026 post based on a weekly Fibonacci structure and a MACD golden cross. Standard Chartered's $8 institutional target is the highest credible 2026 forecast, conditional on CLARITY Act passage and $10 billion in ETF inflows. A $20 print in 2026 would require an overshoot pattern with no recent historical analog. The current daily chart structure does not support either target in the near term.

How will the CLARITY Act affect XRP price?

The CLARITY Act would lock XRP's digital commodity classification into federal law, removing residual regulatory risk. The Senate Banking Committee passed the bill on May 14, 2026, but the full Senate vote still requires 60 votes. Polymarket currently prices 2026 passage at roughly 62%. The 12 sessions since the committee vote show that absent fresh ETF demand, regulatory wins alone are not enough to sustain a bid in XRP.

XRP traded at $1.33 on Tuesday, May 26, 2026, down 1.3% on the session as the post-CLARITY Act rally that lifted the token through early May has fully unwound. The price has returned to the lower bound of the consolidation range that has defined the chart since February, with the May 23 test of $1.26 to $1.30 still the most recent floor.

Despite the Senate Banking Committee advancing the Digital Asset Market Clarity Act on May 14, XRP has closed weaker on most sessions that followed. A trader on X named Ninedex has just published a $20 stretch target on the weekly chart. My daily setup says something else.

Follow me on X for real-time market analysis: @ChmielDk.

XRP Price Analysis: CLARITY Passed, the Rally Didn't

The CLARITY Act passed the Senate Banking Committee on Thursday, May 14, 2026, in a vote that should have repriced XRP higher. The bill would lock the SEC and CFTC's March 17 digital commodity classification into federal law, removing a layer of regulatory risk that has shadowed the token since the 2020 SEC lawsuit.

XRP rallied roughly 6% on the Sunday before the vote, as my pre-vote analysis detailed. Twelve sessions later, the token has given back the entire move and more.

The miss is a flow story, not a news story. Paul Howard, Senior Director at Wincent, framed the broader crypto regime in commentary focused on Bitcoin and large-cap altcoins .

"Crypto sentiment has broadly weakened since October 10, 2025, and the market is currently operating in a low-liquidity environment with limited new catalysts," he said. The same low-liquidity dynamic explains why even a binding regulatory win cannot sustain a bid in XRP.

The drivers behind the failure to hold:

  • Senate Banking Committee passed CLARITY Act May 14, 2026; bill needs 60 floor votes next
  • Spot XRP ETF cumulative inflows above $1.3 billion since the November 2025 launch
  • Crypto-wide sentiment weakened since October 10, 2025, per Howard
  • Order-book depth at major venues insufficient to absorb headline-driven flow
  • XRP price below all major daily moving averages for the third consecutive month

Adam Haemms, Head of Asset Management at Tesseract Group, made a parallel point on Bitcoin's reaction to geopolitical headlines. "Geopolitical headlines move Bitcoin on the day, but they rarely set the regime," he said, adding that thin order books mean "every macro headline moves price further than the underlying flow would justify."

The same dynamic applies to XRP's book this month. The CLARITY pop got faded into the same supply zone that has rejected price four times since February. The FinanceMagnates.com CLARITY Act explainer details what changes if the bill clears the full Senate.

My XRP Chart Shows the Range Floor Bending

My chart shows XRP locked in a structural downtrend that has held since the $3.65 cycle high in October 2025. Tuesday's $1.33 print puts price below the 50 EMA at $1.40 and well under the 200 EMA at $1.67.

The main range that has defined trading since early February runs from $1.26 to $1.30 on the floor and $1.51 to $1.57 on the ceiling. May 15 was the last upper test. May 23 was the last lower test. Tuesday's leg lower puts the floor back under pressure.

Over my 15+ years covering retail-driven crypto flows at FinanceMagnates.com, I have seen viral weekly targets attached to XRP charts before. They rarely survive a bearish daily setup in this kind of consolidation structure.

The trigger to watch is $1.26. A clean break opens $1.11, the year-to-date low set in earlier 2026 sessions. A flush from there activates my March $0.53 ultra-bearish thesis, based on the 100% Fibonacci extension of the July-October 2025 range.

XRP price technical analysis. Source: Tradingview.com

The opposite case requires reclaiming $1.57 first, then the 200 EMA at $1.67, then the December 2025 swing low at $1.80 which now reads as resistance on the way back up. Until then the bias on my chart stays bearish.

Level

Type

Notes

$1.80

Resistance

December 2025 swing low, now ceiling

$1.67

200 EMA

Major trend resistance

$1.51 to $1.57

Range high

Last tested May 15, four prior rejections

$1.40

50 EMA

Above current price, bearish bias

$1.33

Current

Down 1.3% intraday, May 26, 2026

$1.26 to $1.30

Range low

Tested May 23

$1.11

YTD low

Downside trigger on $1.26 break

$0.53

100% Fib extension

Ultra-bear scenario

A Trader on X Sees $20 on the XRP Weekly. How High Can XRP Go?

A trader on X with the handle @ninedex23 published a weekly XRP analysis on May 25, 2026, calling for a $5 primary target and a $20 stretch case based on a Fibonacci and channel framework. The post reached roughly 8,200 views, putting it well below institutional reach but inside the same retail board universe that drove the 2017 and 2021 XRP rallies.

The setup on the weekly leans on four signals:

  • Fibonacci 0.382 ("blue line") support that held the 2022 to 2024 base
  • Long-term Stochastic rebounding from 15 points to 20 points, which @ninedex23 described as historically rare oversold for XRP
  • MACD weekly golden cross with the oscillator turning positive
  • Year-over-year channel growth slope of 32% since the 2014 to 2016 reclassification from small altcoin to major altcoin

The $5 primary target sits at the upper edge of @ninedex23's green channel. The $20 stretch target requires what the trader called an "overshooting pattern like in 18," a reference to XRP's 2018 cycle peak that ran from a sub-$0.10 base above $3. Resistance at $2 has to crack first, with the supply zone built during the 2024 to 2025 highs as the next ceiling above.

My one-line view: this is a defensible weekly read, but the weekly does not pay rent on the daily. Until $1.57 reclaims, the structure remains bearish and any $5 path runs through at least eight months of basing, not weeks.

XRP Price Predictions: From $0.53 to $20

Forecasts on XRP for the rest of 2026 span a remarkable range, from sub-$1 ultra-bear scenarios to retail moonshots. The credible institutional bull anchor remains Standard Chartered's Geoffrey Kendrick at $8 by end-2026, conditional on the CLARITY Act passing the full Senate and ETF inflows reaching $10 billion.

My view: $8 is mathematically tight even on the bullish path, given XRP would need to clear $2 first and the post-Senate Banking pop already failed.

Bitrue Research Labs sits closer to the middle at $2.25 to $2.50 for year-end 2026. My view: this is more defensible than $8 but still requires reclaiming the entire range and clearing the 200 EMA at $1.67, a setup my chart does not currently support.

The Ripple Prime $200 million credit line confirms business-side traction, but as the FinanceMagnates.com post-CLARITY framework comparison detailed, regulatory wins alone have not been enough to move price in the current low-liquidity tape.

Source

Target

Notes

@ninedex23 (X)

$5 primary / $20 stretch

Weekly Fib 0.382, MACD cross, May 25, 2026 post

Standard Chartered (Geoffrey Kendrick)

$8 by end-2026

Conditional on CLARITY full Senate pass + $10B ETF inflows

Bitrue Research Labs

$2.25 to $2.50

Year-end 2026, ETF adoption base case

Changelly

$1.36 avg / $1.76 max

December 2026 range-bound projection

Damian Chmiel (FinanceMagnates.com)

$1.11 short-term, $0.53 ultra-bear

Below all major MAs, range floor under pressure

XRP Price Prediction FAQ

Why is XRP price falling on May 26, 2026?

XRP fell 1.3% to $1.33 on Tuesday, May 26, 2026, extending a multi-session decline that wiped out the rally tied to the CLARITY Act's Senate Banking Committee passage on May 14. Price is back at the lower band of the consolidation range tested on May 23. The move reflects faded post-regulatory momentum and weak crypto-wide liquidity, with the broader trend bearish since the $3.65 cycle high in October 2025.

What is the next major XRP support level?

The next confirmed support is $1.26 to $1.30, the range floor last tested on May 23, 2026. A break opens the path to $1.11, the year-to-date low established in earlier 2026 sessions. An ultra-bearish scenario based on the 100% Fibonacci extension of the July-October 2025 range targets $0.53, a level that would represent roughly a 60% decline from current price and would only activate on extreme broader-market weakness.

Could XRP reach $20 in 2026?

A trader on X targeted $20 in a May 25, 2026 post based on a weekly Fibonacci structure and a MACD golden cross. Standard Chartered's $8 institutional target is the highest credible 2026 forecast, conditional on CLARITY Act passage and $10 billion in ETF inflows. A $20 print in 2026 would require an overshoot pattern with no recent historical analog. The current daily chart structure does not support either target in the near term.

How will the CLARITY Act affect XRP price?

The CLARITY Act would lock XRP's digital commodity classification into federal law, removing residual regulatory risk. The Senate Banking Committee passed the bill on May 14, 2026, but the full Senate vote still requires 60 votes. Polymarket currently prices 2026 passage at roughly 62%. The 12 sessions since the committee vote show that absent fresh ETF demand, regulatory wins alone are not enough to sustain a bid in XRP.

About the Author: Damian Chmiel
Damian Chmiel
  • 3575 Articles
  • 111 Followers
About the Author: Damian Chmiel
Damian Chmiel is a Senior Analyst & Editor at Finance Magnates with more than 15 years of experience in the CFD and online trading industry. Active as both a trader and journalist since 2010, he focuses on broker coverage, fintech innovation, and regulatory developments across Europe, the Middle East, and Asia. His work includes interviews with C-level leaders at major brokerages and fintech platforms, as well as co-authoring Finance Magnates’ quarterly industry benchmarking reports. Damian’s reporting is data-driven, market-aware, and grounded in direct industry engagement. His analysis and commentary have also been cited by external media outlets, including Investing.com, Binance, The Asset, Stockhead, and Dispatch. Education: MA in Finance and Accounting, Cracow University of Economics
  • 3575 Articles
  • 111 Followers

More from the Author

Trending

!"#$%&'()*+,-./0123456789:;<=>?@ABCDEFGHIJKLMNOPQRSTUVWXYZ[\]^_`abcdefghijklmnopqrstuvwxyz{|} !"#$%&'()*+,-./0123456789:;<=>?@ABCDEFGHIJKLMNOPQRSTUVWXYZ[\]^_`abcdefghijklmnopqrstuvwxyz{|}