

Gold traded at $4,753 per ounce on Thursday, May 7, 2026, rising more than 1% and extending Wednesday's strongest single-session gain in over five weeks as XAU/USD tested the 50-day exponential moving average from below for the first time since the late-April selloff.
Spot now sits roughly 15% below the $5,595 January 29 all-time high but back inside the upper half of the multi-month consolidation that has defined trading since the Iran war began in late February.
The drivers are textbook: falling long-term Treasury yields, a softer dollar, and renewed optimism around US-Iran negotiations easing energy-shock concerns. This week's catalysts ahead include US employment data and any concrete progress on diplomatic talks.
Follow me on X for real-time market analysis: @ChmielDk.
Why Gold Is Surging? Treasuries, Dollar, Iran De-Escalation
The bid has three macro components, each independently weakening the headwind that has capped gold since the March crash. Ten-year Treasury yields softened from the 4.4% area, the dollar index slipped from above 98, and Brent crude dropped roughly 8% on Wednesday on US-Iran negotiation reports, reversing the inflation premium that had kept the Federal Reserve frozen.
- Why Is Gold Going Down Today? XAU/USD Price at Monthly Lows
- Why Is Gold Falling? Gold Price Risk Crash to $3,400
- How High Can Gold Go? UBP Rebuilds Bullion Positions and Reaffirms $6,000 Gold Price Prediction for 2026
"Gold advanced further on Thursday after surging in the previous session, supported by falling long-term Treasury yields and a softer US dollar," said Bas Kooijman, CEO and Asset Manager of DHF Capital S.A. Kooijman attributed the move to "growing optimism surrounding a potential agreement between the United States and Iran" easing fears of a prolonged energy shock.
Lower yields cut directly into the opportunity cost argument that drove the April selloff: when ten-year real rates compress, the cost of holding a non-yielding asset compresses with them.
The dollar's softness reinforces the move. Spot has gained more than 1% in dollar terms today but sits up roughly 1.5% to 2% in trade-weighted terms, a gap that signals the bid is not purely a currency reflex. As the FinanceMagnates.com report from Monday detailed, the same consolidation between the $4,300 EMA cluster and the $4,840 April highs that defined last week is now being tested from the bull side rather than the bear side.
Key macro drivers behind the surge:
- Ten-year Treasury yields softened from the 4.4% level, easing the opportunity-cost headwind on non-yielding assets
- US dollar index slipped below 98, reducing the FX drag on gold for non-dollar buyers
- Brent crude fell roughly 8% on Wednesday on US-Iran de-escalation signals, cooling the inflation premium
- Fed expectations marginally tilted back toward easier policy as the energy-shock pass-through fades
The Three-Phase Demand Thesis Behind the Bid
The macro story alone does not explain why gold has held above $4,300 through nine sessions of falling oil and rising yields in late March. BloFin Research's three-phase demand framework argues the floor under the cycle is not a single buyer but three structurally independent layers operating in sequence.
"Reserve allocation is strategic: driven by portfolio rebalancing and de-dollarisation, not price momentum," BloFin Research wrote in its three-phase thesis. Central bank buying ran above 1,000 tonnes annually for three consecutive years from 2022 to 2024 before moderating to 863 tonnes in 2025, per World Gold Council data.
Western institutional flows returned in 2025 with 801 tonnes of ETF inflows but remain structurally under-allocated: gold accounts for roughly 0.17% of US private financial assets versus a 1% to 2% historical norm.
The third phase is the underreported one. Tether's USDT reserves include approximately $20 billion in gold, roughly 10% of the stablecoin's $190 billion reserve pool. The GENIUS Act passed in May 2026 requires compliant US issuers to back stablecoins with cash or short-dated Treasuries, explicitly excluding gold, leaving offshore Tether free to keep accumulating physical metal that domestic competitors cannot.
Tokenized gold supply has doubled in the past six months to roughly 35-40 tonnes outstanding, a small absolute number but a 100% growth rate from a base that did not exist in any prior gold cycle.
Gold Technical Analysis: 50 EMA Resistance, 200 EMA Floor
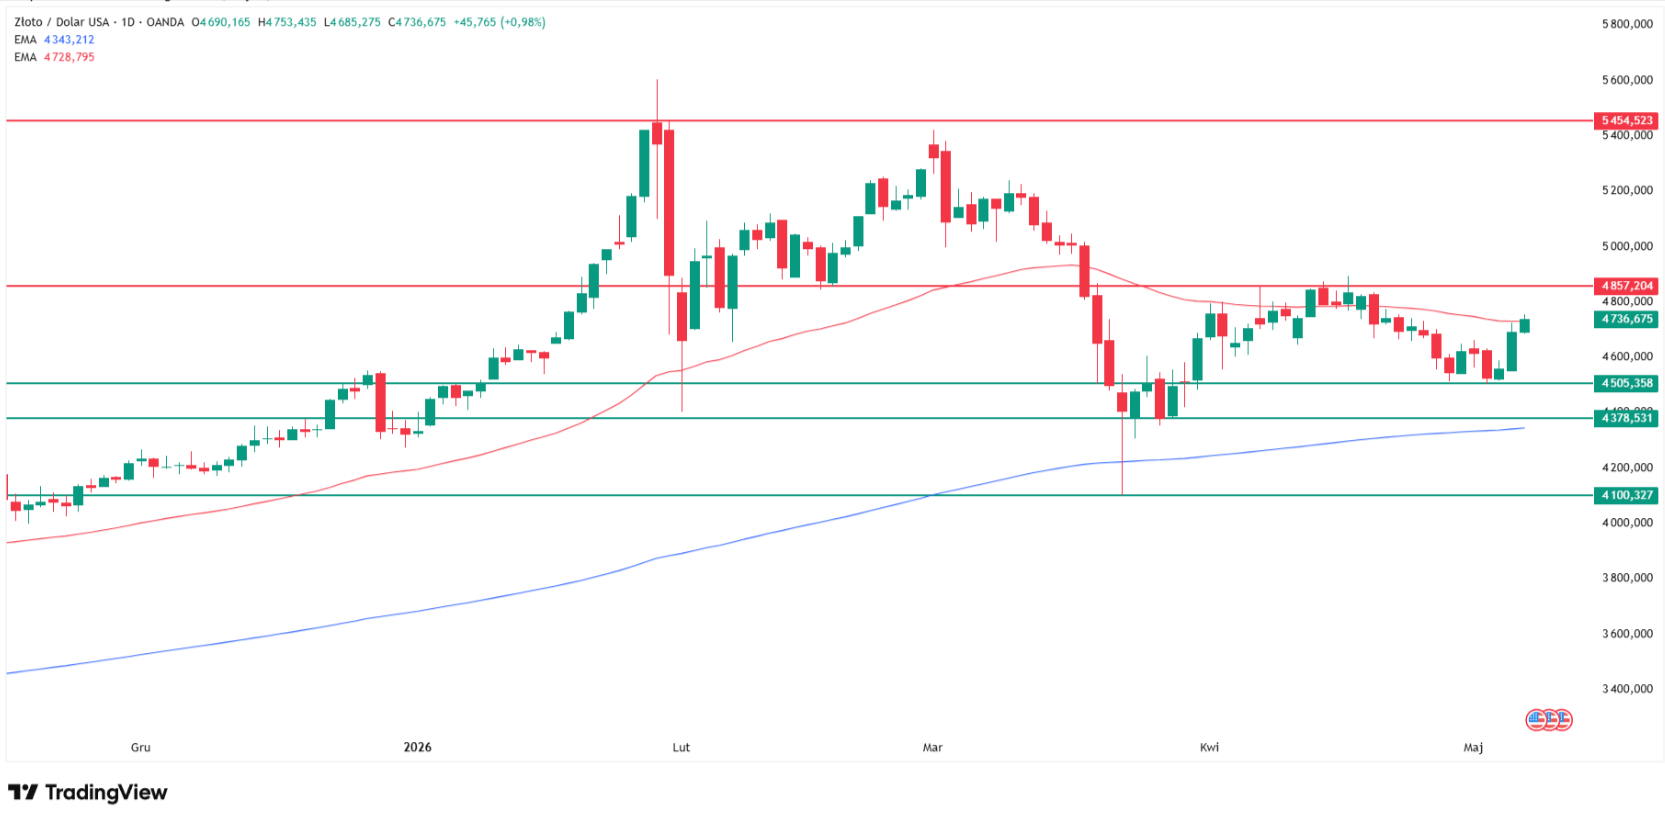
Spot is testing the 50-day exponential moving average at $4,753 from below for the first time since the late-April selloff. The session is the cleanest bull setup the daily chart has produced since the early-April US-Iran ceasefire bounce, but a single-day touch is not a confirmed break.
In the 15 years I have covered gold and forex markets, documented across my analyst page, two-EMA brackets like this one have a habit of releasing in one direction with momentum disproportionate to the trigger event.
Either the 50 EMA gives way to the upside or the 200 EMA gives way to the downside, and both averages combined with the horizontal levels are currently keeping price in consolidation. The same setup framed my March 25 reversal call at the 200 EMA pin bar that anchored the post-crash recovery.
The directional logic on my chart:
Level | Type | Notes |
$5,600 | Key resistance / January 29 ATH | Open price-discovery target on a clean break of $4,850 |
$4,850 | Resistance / February 17-18 lows cluster | Trigger for upside scenario; coincides with multi-week range top |
$4,753 | Dynamic resistance / 50 EMA | Tested today from below for the first time since late April |
$4,500 | Support / April-May lows + late-2025 highs | First downside cushion if 50 EMA caps the rally |
$4,400 | Support / February 2 lows | Secondary support on a rejection at the 50 EMA |
$4,350 | Major support / 200 EMA cluster + late-March lows | Bull-bear line; weekly close below opens $4,000 and $3,400 |
A daily close above $4,850 reopens the path toward the $5,600 record-high zone tested on January 29. A weekly close below $4,350 invalidates the consolidation and reactivates the $3,400 Fibonacci extension scenario detailed in my April 28 analysis.
My bias today is neutral-to-bullish inside the range, with the 50 EMA the trigger I am watching.
Gold Price Predictions: Where The Banks Stand
Wall Street year-end 2026 targets cluster between $5,000 and $6,300, a 5% to 32% upside from current spot. The dispersion narrowed after the March crash and has tightened further since the April-May consolidation held the 200 EMA.
"Any setback in negotiations could quickly reignite global inflation fears, driving yields higher and weighing on bullion," DHF Capital's Kooijman cautioned, framing every prediction in the table as path-dependent on Iran diplomacy and the Fed's tolerance for sticky inflation.
Source | Target | My one-sentence view |
JPMorgan (Shearer) | $5,000 base / $6,000 stretch | Achievable if Western ETF holdings drift back toward 0.5% of US private financial assets, per the bank's own diversification math |
Wells Fargo | $6,300 by year-end 2026 | Most aggressive mainstream call; needs Fed cuts plus sustained dollar weakness to land |
Goldman Sachs | $5,400 by year-end 2026 | Reasonable if the 50 EMA breaks and the consolidation resolves up rather than down |
UBP | $6,000 by year-end 2026 | UBP is already buying back the exposure it cut to 3% during the March slump, so positioning supports the call |
State Street (Doshi) | $4,750-$5,500 base case (50% probability) | Closest to the current chart; my preferred working range absent a fresh macro catalyst |
UBP's rebuild of bullion to roughly 6% of discretionary client portfolios, up from the 3% trough, is the kind of positioning data that confirms institutional flows are returning to the second of BloFin's three demand phases.
Gold Price, FAQ
Why is gold surging today?
Gold is rising more than 1% to $4,753 on Thursday, May 7, 2026, on three converging signals: ten-year Treasury yields softened from the 4.4% area, the dollar index slipped below 98, and Brent crude fell roughly 8% Wednesday on US-Iran de-escalation reports. Lower yields and a softer dollar reduce the opportunity cost of holding a non-yielding asset, while easing oil prices cool the inflation premium that kept the Fed frozen through April.
How high can gold go in 2026?
Wall Street year-end targets range from JPMorgan's $5,000 base case (with $6,000 as a stretch scenario tied to a 0.5% diversification of US foreign asset holdings) to Wells Fargo at $6,300 and UBP at $6,000. State Street assigns 50% probability to a $4,750-$5,500 base case. My chart targets a $5,600 retest if $4,850 breaks on the upside, leaving room for $6,000-$6,300 only with sustained Fed easing.
What is the next gold price target on the chart?
Immediate resistance is the 50 EMA at $4,753, which spot is testing today for the first time since late April. A daily close above $4,850 (the February 17-18 lows cluster) reopens the path toward the $5,600 January 29 all-time high. On the downside, $4,500, $4,400, and $4,350 (the 200 EMA cluster) are the sequential supports, with a weekly close below $4,350 the bull-bear trigger.
Will gold break $5,000 again?
Gold last traded above $5,000 in early February before the Iran-war-driven March crash. JPMorgan's base case has gold reclaiming $5,000 by year-end 2026. My chart sees $5,000 as a midpoint between the 50 EMA at $4,753 and the $5,600 record, reachable on a clean break of $4,850 with continued Fed dovishness and dollar softness. A weekly close below $4,350 would push that timeline into 2027.


