Bitcoin tests $76,500 support on Monday after Trump's "Clock Is Ticking" Iran warning, with $580M in long positions liquidated overnight.
BTC, ETH, XRP and DOGE all show four consecutive down sessions, with Bitcoin's $76.5K 50 EMA the decisive hinge for next 10-20% drop.
Why Bitcoin is going down today? Let's check current BTC price technical analysis and forecasts
Bitcoin (BTC) traded at
$76,959 on Monday, May 18, 2026, down 1.37% as the world's largest
cryptocurrency tested its 50-day exponential moving average for the fourth
consecutive losing session. Why is crypto going down? President Trump's Sunday
Truth Social post warning Iran the "clock is ticking" on stalled
ceasefire talks triggered $580 million in overnight liquidations on Coinglass,
$550 million of it from leveraged longs.
Ethereum
(ETH) slipped 3.24% to $2,110, XRP dropped 1.22% to $1.39, and Dogecoin (DOGE)
fell 2.14% to $0.1067. In this article I break down BTC, ETH, XRP and DOGE
technical analysis, the macro catalysts, and where each chart goes next.
Follow me
on X for real-time crypto market analysis: @ChmielDk.
Why Crypto Is Falling? Iran
Tensions, Bond Yields, and ETF Flow Swings
The crypto
sell-off has three converging drivers, none of them isolated to digital assets.
Trump
posted on Truth Social on Sunday: "For Iran, the Clock is Ticking, and
they better get moving, FAST." Brent crude futures jumped 1.98% to $111.42
per barrel on Monday and WTI cleared $107, with the Strait of Hormuz still
effectively shut since Operation Epic Fury launched in late February.
The
president has reportedly called a Tuesday Situation Room meeting to weigh
military options. The setup is a near-mirror of the April Strait of Hormuz shock that
FinanceMagnates.com covered, with the difference being crypto sat at higher levels then.
"The
macroeconomic backdrop could continue to exacerbate pressure on bitcoin and
other non-yield assets," said Joel Kruger, Crypto Strategist at LMAX.
Kruger noted that ETF flows continue to swing, with $131 million of net spot
Bitcoin ETF inflows on Thursday failing to reverse the impact of heavier
outflows on Tuesday and Wednesday.
Bitcoin Technical
Analysis: 50 EMA Decides the Next 20%
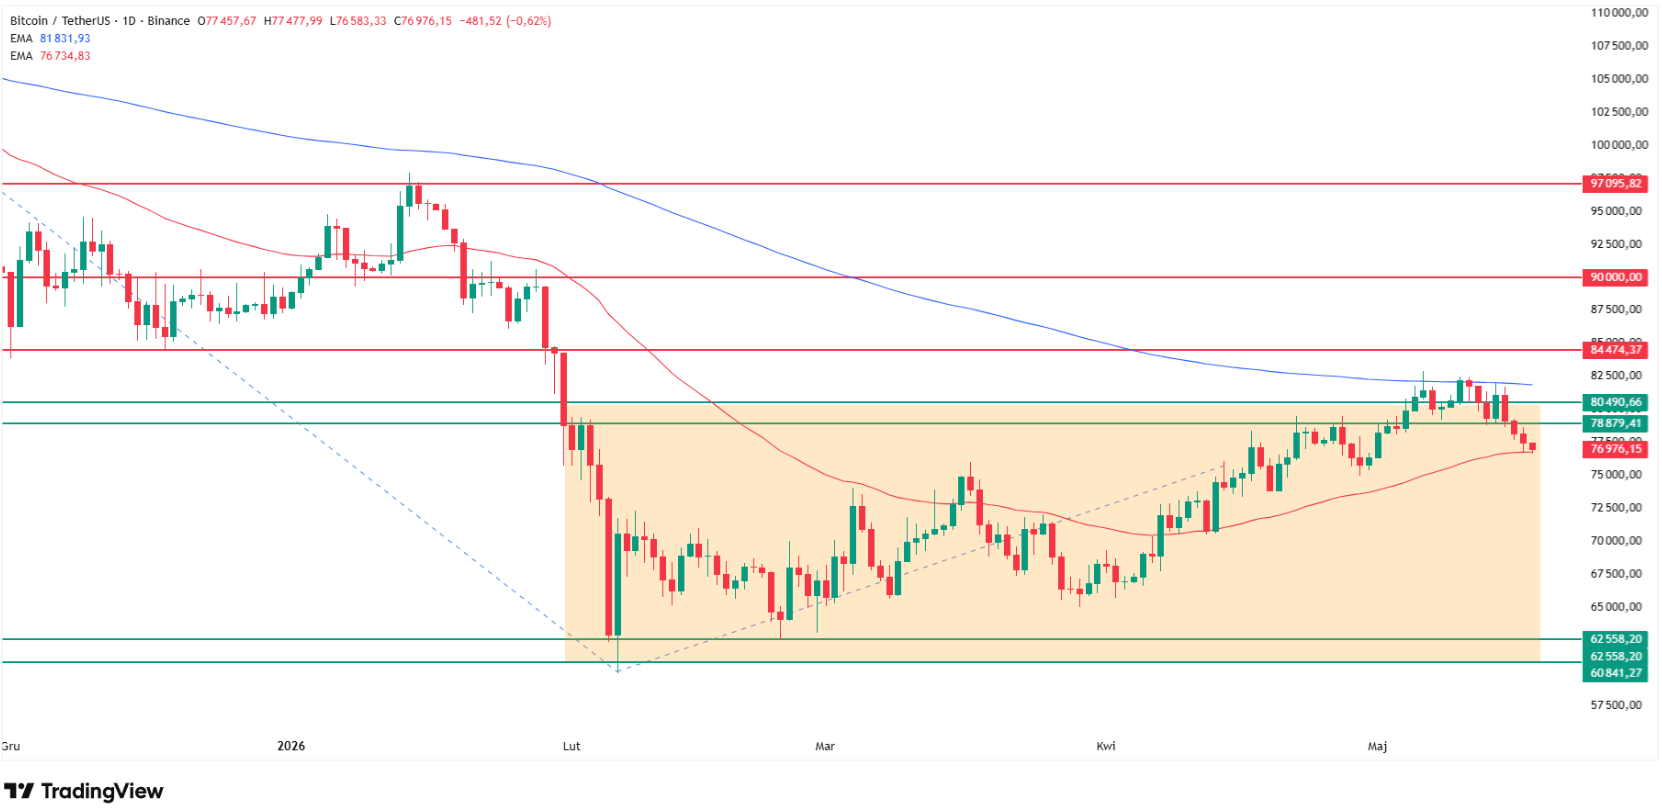
Bitcoin
fell 2.5% on Friday and continued lower into Monday, May 18, 2026, hitting an
intraday low of $76,690, the weakest print since the start of May. The fourth
consecutive down session pushed BTC directly back into the consolidation range
drawn from late January, retesting the 50-day exponential moving average that
has acted as dynamic support for the past six weeks.
In 15+
years analyzing crypto and CFD markets (full record on my analyst page), I've learned 50 EMAs as dynamic support are
decisive: when they fail, the cascade follows. As I wrote in my prior analysis on
Bitcoin, the
inability to break above the 200 EMA on the most recent rally meant a return to
consolidation and renewed bear pressure was the higher-probability path. That
scenario is now live.
Why is Bitcoin price going down today? Source: Tradingview.com
Not all
analyst commentary is bearish. Krisada Yoonaisil, Financial Markets Strategist
at Exness, told FinanceMagnates.com that "Bitcoin's break above the $76k
level was a technically significant development," framing the area as the
line between corrective pullback and structural breakdown. With BTC now
retesting that exact level, the question is no longer academic.
Bitcoin
key levels
Level
Type
Notes
$76,500
50 EMA / Dynamic support
Tested in 4 consecutive sessions
$82,000
200 EMA / Resistance
Last
week's rally failed here
$60,000-$63,000
Range floor
February-March
lows, -20% from current
Ethereum Mirrors Bitcoin
With One Critical Difference
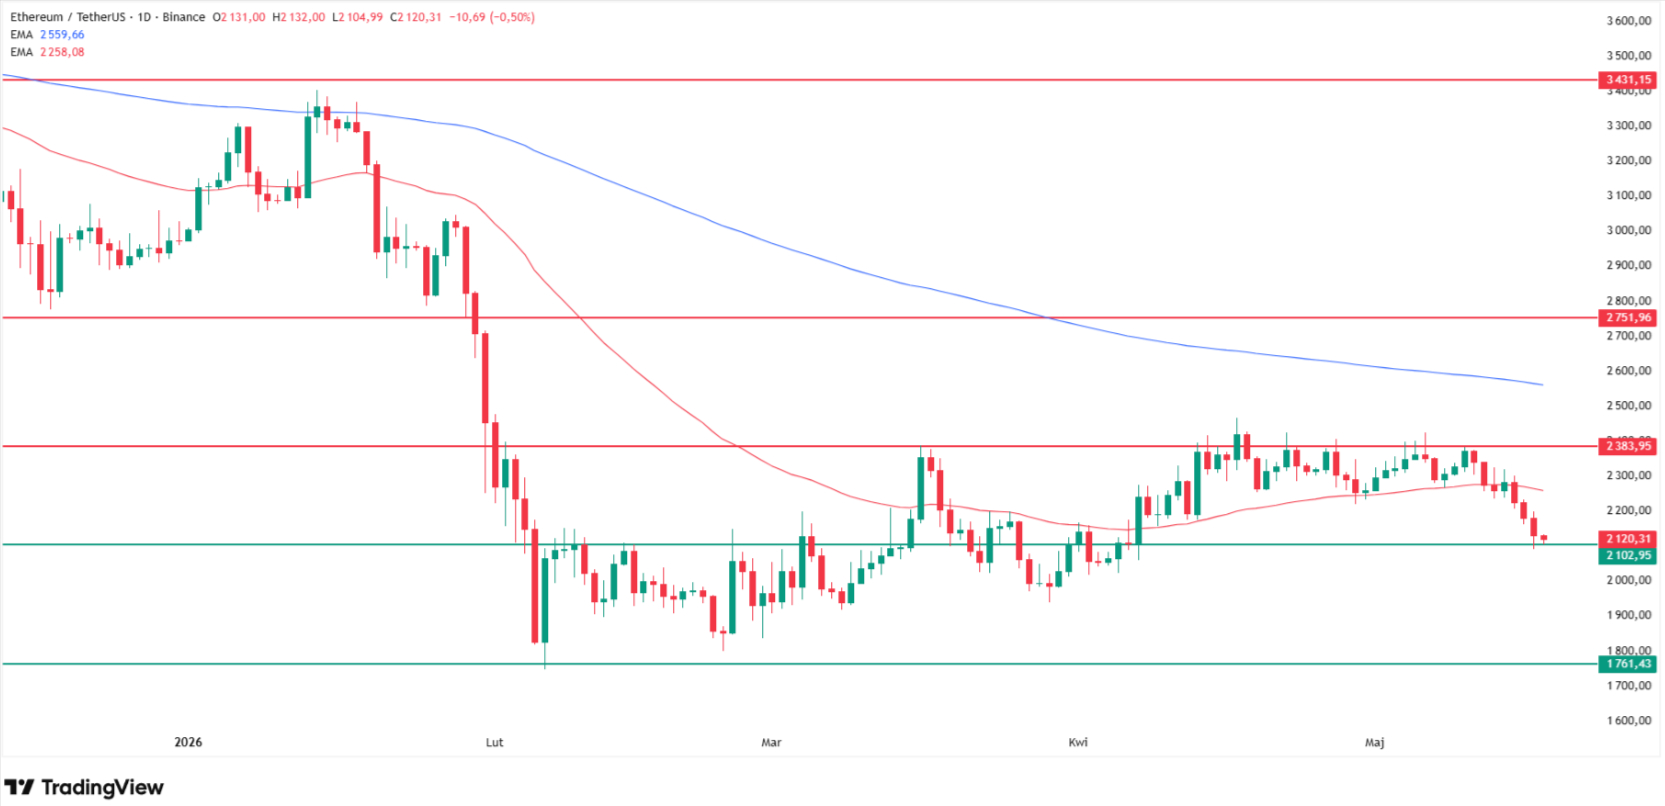
The
Ethereum chart traces Bitcoin's structure with one critical difference: ETH
never broke out of the consolidation range drawn since late January. The
pattern of four consecutive losing sessions repeats, with Ether near $2,110
Monday, roughly the midpoint of a channel whose ceiling sits at $2,400 (March
highs, retested in April and May) and whose floor lies just under $1,800
(February 2026 lows).
The level
that matters now is the local support I've marked on the chart at approximately
$2,100. A daily close below that zone has, in my reading, a high probability of
triggering a slide to the channel floor near $1,800, a 16% decline from current
levels. As the FinanceMagnates.com analysis
from February documented, the $2,000 area has been the psychological pivot for ETH all year.
Why is Ethereum price going down today? Source: Tradingview.com
The
mechanics are similar to the BTC 50 EMA test: hold the line, ETH stays
range-bound; break it, the lower boundary is the next destination.
Ethereum key levels
Level
Type
Notes
$2,400
Channel ceiling
March
highs, retested April and May
$2,100
Local support
Green
level on my chart
$1,800
Channel floor
February 2026 low, -16% target
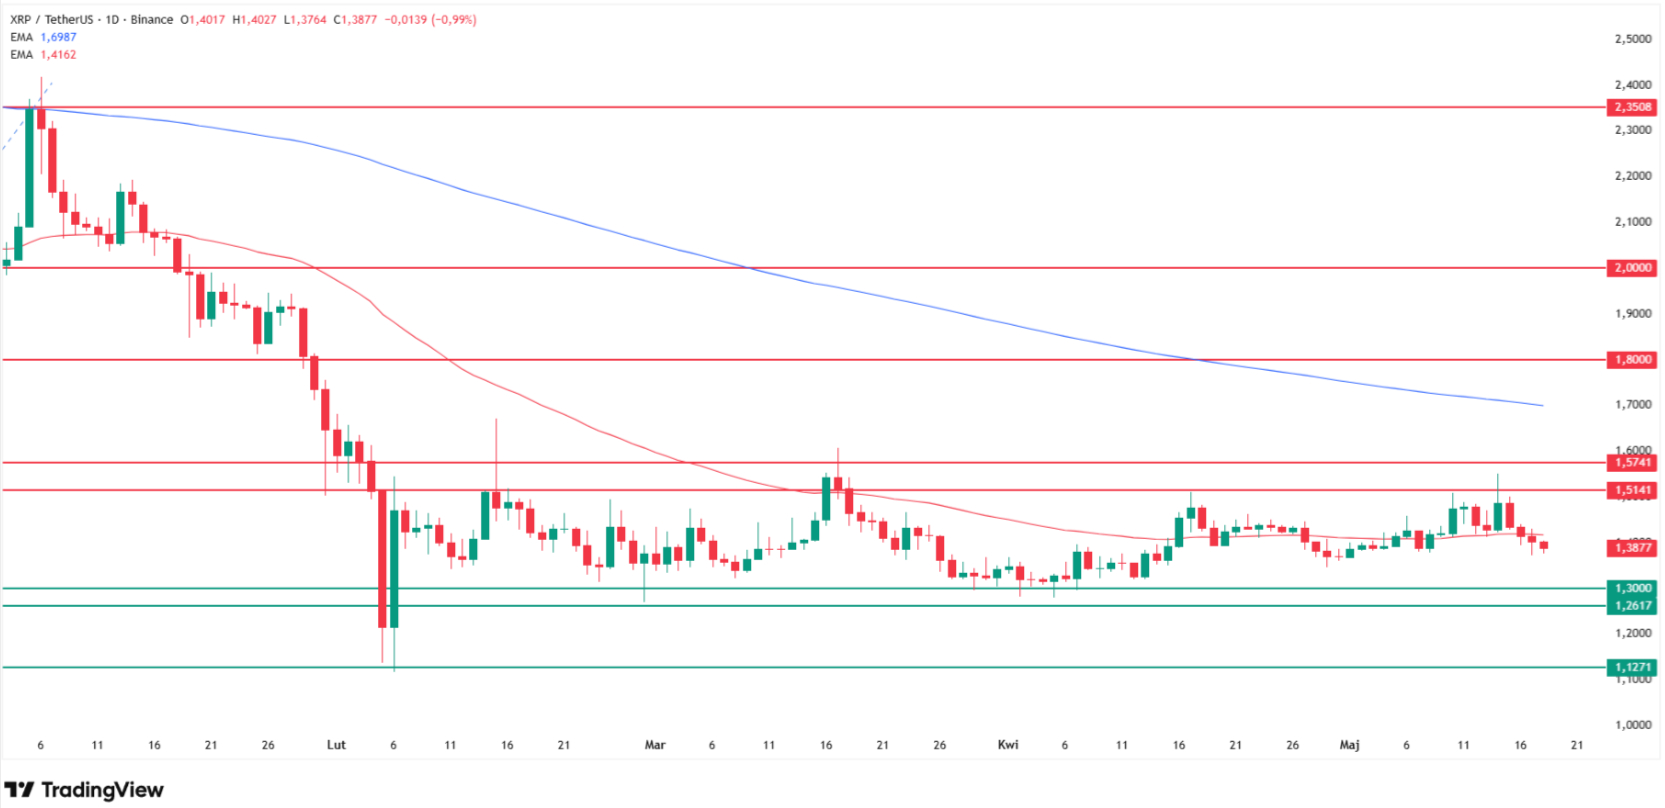
XRP Targets the $1.26-$1.30 Support Cluster
XRP traces
the same four-session sell pattern. The token has fallen from near $1.50 on
Thursday to an intraday low of $1.37 as Monday's session opened, with the
broader structure showing a multi-month consolidation at year-low levels. The
range ceiling sits near $1.60 (February-March highs) and the floor near $1.12
(February 2026 lows).
There is
also an intermediate support zone at $1.26 to $1.30 that has captured most of
XRP's trading activity inside the broader range. Since price has now broken and
confirmed the breach of the 50 EMA, my read is XRP is targeting that
intermediate zone first, a roughly 10% decline from current levels. If that
zone fails, the $1.12 February low becomes the next test.
Why is XRP price going down today? Source: Tradingview.com
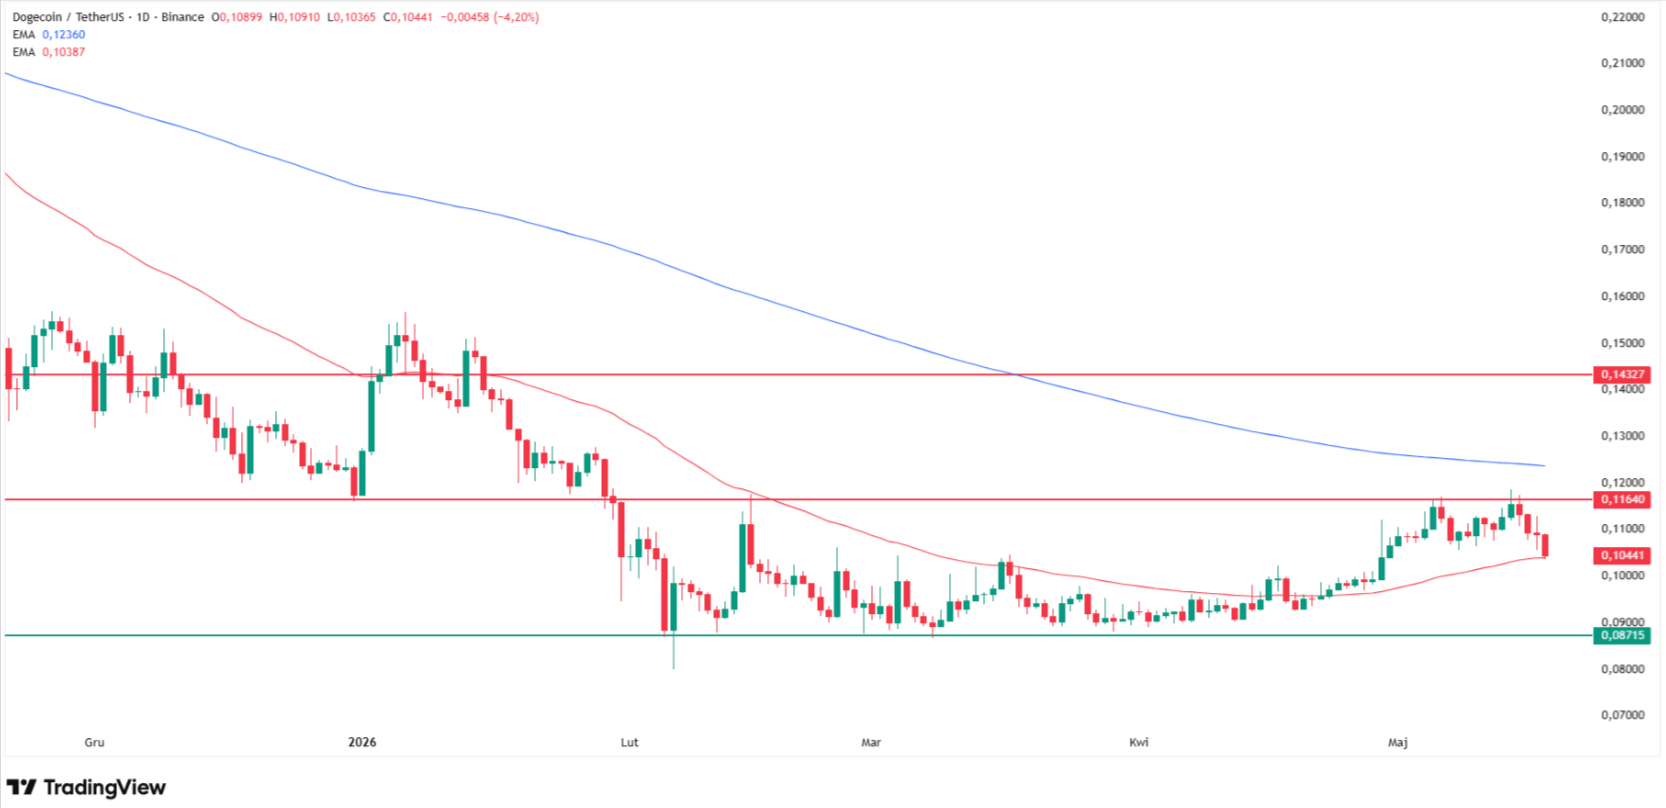
Dogecoin
attempted to escape the four-month volatility channel that coincides with its
2024 lows late last week, briefly pushing toward the December 31 reference area
near $0.12. The breakout failed.
The bearish
engulfing candle from that attempt has delivered four down days, with Monday
the strongest decline of the sequence: DOGE fell more than 4% to test $0.10,
stopping precisely at its 50-day exponential moving average.
The lower
boundary of this consolidation sits below $0.09, tested repeatedly through
February, March, and April. If the 50 EMA does not hold, DOGE targets $0.087, a
roughly 16% decline from current levels and the lowest price since 2024. The
breakdown setup is the most structurally bearish of the four charts in this
analysis.
Why is Dogecoin price going down today? Source: Tradingview.com
Dogecoin key levels
Level
Type
Notes
$0.12
Failed breakout
December
31 low, rejected last week
$0.10
50 EMA
Current price stop
$0.087
Range floor
-16% target if 50 EMA fails
Crypto Downside Targets
Asset
Current
My Downside Target
Implied Move
Trigger
My View
Bitcoin
$76,959
$60,000-$63,000
-20%
50 EMA daily close break
High-probability
cascade if dynamic support fails
Ethereum
$2,110
$1,800
-16%
$2,100 local support break
Most
leveraged to a BTC break, never escaped consolidation
XRP
$1.39
$1.26-$1.30
-10%
50 EMA already confirmed broken
Already
in motion toward intermediate zone
Dogecoin
$0.1067
$0.087
-16%
50 EMA at $0.10 fails
Structurally
weakest chart after the failed breakout
FAQ
Why is crypto going down
today?
Crypto is
selling off because of three converging pressures: President Trump's Sunday
"Clock Is Ticking" warning to Iran reignited fears of military
escalation around the Strait of Hormuz, the US 10-year Treasury yield climbed
to 4.63% on hawkish Fed repricing, and Bitcoin ETF flows have swung between
heavy outflows earlier in the week and a $131M inflow on Thursday. The
combination triggered $580 million in overnight liquidations on Coinglass.
How low can Bitcoin go in
this sell-off?
My
technical analysis identifies the 50-day exponential moving average near
$76,500 as the decisive level. If Bitcoin closes daily below this support, the
chart opens a path to the consolidation floor between $60,000 and $63,000,
which coincides with the February-March lows. That represents a roughly 20%
further decline from Monday's $76,959 print and would mark BTC's lowest level
of 2026 outside the February panic.
What is the next support
for Ethereum?
Ethereum is
testing a local support zone near $2,100, marked on my chart as the median of
the consolidation channel that has held since late January. A daily close below
$2,100 opens the path to the channel floor near $1,800, the February 2026 low.
That move would represent approximately 16% further downside from current
levels and the deepest test of the range structure since the channel was
established.
Will XRP fall below $1?
XRP is
unlikely to break below $1 in this sell-off based on my chart. The token sits
at $1.39 with two clear support layers: the intermediate $1.26 to $1.30 zone,
where most consolidation trading has occurred, and the February 2026 low at
$1.12. The $1.26 area is the more probable near-term target, representing
roughly 10% downside. A break below $1.12 would put $1 on the table, but that
is not the base case.
Is Dogecoin headed back to
its 2024 lows?
Dogecoin is
now structurally the weakest of the four charts I track. The failed breakout
above $0.12 last week and the bearish engulfing pattern that followed put DOGE
on a path toward $0.087, the lower boundary of a four-month consolidation that
coincides with the 2024 lows. The 50 EMA at $0.10 is the immediate hinge. A
daily close below it confirms the move.
Bitcoin (BTC) traded at
$76,959 on Monday, May 18, 2026, down 1.37% as the world's largest
cryptocurrency tested its 50-day exponential moving average for the fourth
consecutive losing session. Why is crypto going down? President Trump's Sunday
Truth Social post warning Iran the "clock is ticking" on stalled
ceasefire talks triggered $580 million in overnight liquidations on Coinglass,
$550 million of it from leveraged longs.
Ethereum
(ETH) slipped 3.24% to $2,110, XRP dropped 1.22% to $1.39, and Dogecoin (DOGE)
fell 2.14% to $0.1067. In this article I break down BTC, ETH, XRP and DOGE
technical analysis, the macro catalysts, and where each chart goes next.
Follow me
on X for real-time crypto market analysis: @ChmielDk.
Why Crypto Is Falling? Iran
Tensions, Bond Yields, and ETF Flow Swings
The crypto
sell-off has three converging drivers, none of them isolated to digital assets.
Trump
posted on Truth Social on Sunday: "For Iran, the Clock is Ticking, and
they better get moving, FAST." Brent crude futures jumped 1.98% to $111.42
per barrel on Monday and WTI cleared $107, with the Strait of Hormuz still
effectively shut since Operation Epic Fury launched in late February.
The
president has reportedly called a Tuesday Situation Room meeting to weigh
military options. The setup is a near-mirror of the April Strait of Hormuz shock that
FinanceMagnates.com covered, with the difference being crypto sat at higher levels then.
"The
macroeconomic backdrop could continue to exacerbate pressure on bitcoin and
other non-yield assets," said Joel Kruger, Crypto Strategist at LMAX.
Kruger noted that ETF flows continue to swing, with $131 million of net spot
Bitcoin ETF inflows on Thursday failing to reverse the impact of heavier
outflows on Tuesday and Wednesday.
Bitcoin Technical
Analysis: 50 EMA Decides the Next 20%
Bitcoin
fell 2.5% on Friday and continued lower into Monday, May 18, 2026, hitting an
intraday low of $76,690, the weakest print since the start of May. The fourth
consecutive down session pushed BTC directly back into the consolidation range
drawn from late January, retesting the 50-day exponential moving average that
has acted as dynamic support for the past six weeks.
In 15+
years analyzing crypto and CFD markets (full record on my analyst page), I've learned 50 EMAs as dynamic support are
decisive: when they fail, the cascade follows. As I wrote in my prior analysis on
Bitcoin, the
inability to break above the 200 EMA on the most recent rally meant a return to
consolidation and renewed bear pressure was the higher-probability path. That
scenario is now live.
Why is Bitcoin price going down today? Source: Tradingview.com
Not all
analyst commentary is bearish. Krisada Yoonaisil, Financial Markets Strategist
at Exness, told FinanceMagnates.com that "Bitcoin's break above the $76k
level was a technically significant development," framing the area as the
line between corrective pullback and structural breakdown. With BTC now
retesting that exact level, the question is no longer academic.
Bitcoin
key levels
Level
Type
Notes
$76,500
50 EMA / Dynamic support
Tested in 4 consecutive sessions
$82,000
200 EMA / Resistance
Last
week's rally failed here
$60,000-$63,000
Range floor
February-March
lows, -20% from current
Ethereum Mirrors Bitcoin
With One Critical Difference
The
Ethereum chart traces Bitcoin's structure with one critical difference: ETH
never broke out of the consolidation range drawn since late January. The
pattern of four consecutive losing sessions repeats, with Ether near $2,110
Monday, roughly the midpoint of a channel whose ceiling sits at $2,400 (March
highs, retested in April and May) and whose floor lies just under $1,800
(February 2026 lows).
The level
that matters now is the local support I've marked on the chart at approximately
$2,100. A daily close below that zone has, in my reading, a high probability of
triggering a slide to the channel floor near $1,800, a 16% decline from current
levels. As the FinanceMagnates.com analysis
from February documented, the $2,000 area has been the psychological pivot for ETH all year.
Why is Ethereum price going down today? Source: Tradingview.com
The
mechanics are similar to the BTC 50 EMA test: hold the line, ETH stays
range-bound; break it, the lower boundary is the next destination.
Ethereum key levels
Level
Type
Notes
$2,400
Channel ceiling
March
highs, retested April and May
$2,100
Local support
Green
level on my chart
$1,800
Channel floor
February 2026 low, -16% target
XRP Targets the $1.26-$1.30 Support Cluster
XRP traces
the same four-session sell pattern. The token has fallen from near $1.50 on
Thursday to an intraday low of $1.37 as Monday's session opened, with the
broader structure showing a multi-month consolidation at year-low levels. The
range ceiling sits near $1.60 (February-March highs) and the floor near $1.12
(February 2026 lows).
There is
also an intermediate support zone at $1.26 to $1.30 that has captured most of
XRP's trading activity inside the broader range. Since price has now broken and
confirmed the breach of the 50 EMA, my read is XRP is targeting that
intermediate zone first, a roughly 10% decline from current levels. If that
zone fails, the $1.12 February low becomes the next test.
Why is XRP price going down today? Source: Tradingview.com
Dogecoin
attempted to escape the four-month volatility channel that coincides with its
2024 lows late last week, briefly pushing toward the December 31 reference area
near $0.12. The breakout failed.
The bearish
engulfing candle from that attempt has delivered four down days, with Monday
the strongest decline of the sequence: DOGE fell more than 4% to test $0.10,
stopping precisely at its 50-day exponential moving average.
The lower
boundary of this consolidation sits below $0.09, tested repeatedly through
February, March, and April. If the 50 EMA does not hold, DOGE targets $0.087, a
roughly 16% decline from current levels and the lowest price since 2024. The
breakdown setup is the most structurally bearish of the four charts in this
analysis.
Why is Dogecoin price going down today? Source: Tradingview.com
Dogecoin key levels
Level
Type
Notes
$0.12
Failed breakout
December
31 low, rejected last week
$0.10
50 EMA
Current price stop
$0.087
Range floor
-16% target if 50 EMA fails
Crypto Downside Targets
Asset
Current
My Downside Target
Implied Move
Trigger
My View
Bitcoin
$76,959
$60,000-$63,000
-20%
50 EMA daily close break
High-probability
cascade if dynamic support fails
Ethereum
$2,110
$1,800
-16%
$2,100 local support break
Most
leveraged to a BTC break, never escaped consolidation
XRP
$1.39
$1.26-$1.30
-10%
50 EMA already confirmed broken
Already
in motion toward intermediate zone
Dogecoin
$0.1067
$0.087
-16%
50 EMA at $0.10 fails
Structurally
weakest chart after the failed breakout
FAQ
Why is crypto going down
today?
Crypto is
selling off because of three converging pressures: President Trump's Sunday
"Clock Is Ticking" warning to Iran reignited fears of military
escalation around the Strait of Hormuz, the US 10-year Treasury yield climbed
to 4.63% on hawkish Fed repricing, and Bitcoin ETF flows have swung between
heavy outflows earlier in the week and a $131M inflow on Thursday. The
combination triggered $580 million in overnight liquidations on Coinglass.
How low can Bitcoin go in
this sell-off?
My
technical analysis identifies the 50-day exponential moving average near
$76,500 as the decisive level. If Bitcoin closes daily below this support, the
chart opens a path to the consolidation floor between $60,000 and $63,000,
which coincides with the February-March lows. That represents a roughly 20%
further decline from Monday's $76,959 print and would mark BTC's lowest level
of 2026 outside the February panic.
What is the next support
for Ethereum?
Ethereum is
testing a local support zone near $2,100, marked on my chart as the median of
the consolidation channel that has held since late January. A daily close below
$2,100 opens the path to the channel floor near $1,800, the February 2026 low.
That move would represent approximately 16% further downside from current
levels and the deepest test of the range structure since the channel was
established.
Will XRP fall below $1?
XRP is
unlikely to break below $1 in this sell-off based on my chart. The token sits
at $1.39 with two clear support layers: the intermediate $1.26 to $1.30 zone,
where most consolidation trading has occurred, and the February 2026 low at
$1.12. The $1.26 area is the more probable near-term target, representing
roughly 10% downside. A break below $1.12 would put $1 on the table, but that
is not the base case.
Is Dogecoin headed back to
its 2024 lows?
Dogecoin is
now structurally the weakest of the four charts I track. The failed breakout
above $0.12 last week and the bearish engulfing pattern that followed put DOGE
on a path toward $0.087, the lower boundary of a four-month consolidation that
coincides with the 2024 lows. The 50 EMA at $0.10 is the immediate hinge. A
daily close below it confirms the move.
Damian Chmiel is a Senior Analyst & Editor at Finance Magnates with more than 15 years of experience in the CFD and online trading industry. Active as both a trader and journalist since 2010, he focuses on broker coverage, fintech innovation, and regulatory developments across Europe, the Middle East, and Asia.
His work includes interviews with C-level leaders at major brokerages and fintech platforms, as well as co-authoring Finance Magnates’ quarterly industry benchmarking reports. Damian’s reporting is data-driven, market-aware, and grounded in direct industry engagement. His analysis and commentary have also been cited by external media outlets, including Investing.com, Binance, The Asset, Stockhead, and Dispatch.
Education:
MA in Finance and Accounting, Cracow University of Economics
Citi Cuts Bitcoin and Ethereum Price Predictions, But Those BTC and ETH Charts Go Even Lower
Featured Videos
FM Daily Brief – 20 July 2026
FM Daily Brief – 20 July 2026
FM Daily Brief – 20 July 2026
FM Daily Brief – 20 July 2026
Today's Monday, the 20th of July 2026, and these are our main stories: two brokers surpass the two-trillion-dollar monthly trading volume mark, Asic posts a record year for civil penalties, and Jump Trading expands its prediction markets team.
Today's Monday, the 20th of July 2026, and these are our main stories: two brokers surpass the two-trillion-dollar monthly trading volume mark, Asic posts a record year for civil penalties, and Jump Trading expands its prediction markets team.
Today's Monday, the 20th of July 2026, and these are our main stories: two brokers surpass the two-trillion-dollar monthly trading volume mark, Asic posts a record year for civil penalties, and Jump Trading expands its prediction markets team.
Today's Monday, the 20th of July 2026, and these are our main stories: two brokers surpass the two-trillion-dollar monthly trading volume mark, Asic posts a record year for civil penalties, and Jump Trading expands its prediction markets team.
4 Finance Leaders Share Their Best Career Advice | iFX EXPO
4 Finance Leaders Share Their Best Career Advice | iFX EXPO
4 Finance Leaders Share Their Best Career Advice | iFX EXPO
4 Finance Leaders Share Their Best Career Advice | iFX EXPO
4 Finance Leaders Share Their Best Career Advice | iFX EXPO
4 Finance Leaders Share Their Best Career Advice | iFX EXPO
What advice has had the biggest impact on your career?
We asked four finance executives to share their number one success tip.
From perseverance to curiosity, their answers offer four different perspectives on building a successful career.
#FinanceMagnates #CareerAdvice #Leadership #Fintech #Shorts
What advice has had the biggest impact on your career?
We asked four finance executives to share their number one success tip.
From perseverance to curiosity, their answers offer four different perspectives on building a successful career.
#FinanceMagnates #CareerAdvice #Leadership #Fintech #Shorts
What advice has had the biggest impact on your career?
We asked four finance executives to share their number one success tip.
From perseverance to curiosity, their answers offer four different perspectives on building a successful career.
#FinanceMagnates #CareerAdvice #Leadership #Fintech #Shorts
What advice has had the biggest impact on your career?
We asked four finance executives to share their number one success tip.
From perseverance to curiosity, their answers offer four different perspectives on building a successful career.
#FinanceMagnates #CareerAdvice #Leadership #Fintech #Shorts
What advice has had the biggest impact on your career?
We asked four finance executives to share their number one success tip.
From perseverance to curiosity, their answers offer four different perspectives on building a successful career.
#FinanceMagnates #CareerAdvice #Leadership #Fintech #Shorts
What advice has had the biggest impact on your career?
We asked four finance executives to share their number one success tip.
From perseverance to curiosity, their answers offer four different perspectives on building a successful career.
#FinanceMagnates #CareerAdvice #Leadership #Fintech #Shorts
FM Daily Brief – 17 July 2026
FM Daily Brief – 17 July 2026
FM Daily Brief – 17 July 2026
FM Daily Brief – 17 July 2026
FM Daily Brief – 17 July 2026
FM Daily Brief – 17 July 2026
Today's Friday, the 17th of July 2026, and these are our main stories: MetaTrader 5 expands native AI capabilities through MCP support, Citadel Securities takes a major stake in Crypto.com, and Kraken launches institutional crypto options.
Today's Friday, the 17th of July 2026, and these are our main stories: MetaTrader 5 expands native AI capabilities through MCP support, Citadel Securities takes a major stake in Crypto.com, and Kraken launches institutional crypto options.
Today's Friday, the 17th of July 2026, and these are our main stories: MetaTrader 5 expands native AI capabilities through MCP support, Citadel Securities takes a major stake in Crypto.com, and Kraken launches institutional crypto options.
Today's Friday, the 17th of July 2026, and these are our main stories: MetaTrader 5 expands native AI capabilities through MCP support, Citadel Securities takes a major stake in Crypto.com, and Kraken launches institutional crypto options.
Today's Friday, the 17th of July 2026, and these are our main stories: MetaTrader 5 expands native AI capabilities through MCP support, Citadel Securities takes a major stake in Crypto.com, and Kraken launches institutional crypto options.
Today's Friday, the 17th of July 2026, and these are our main stories: MetaTrader 5 expands native AI capabilities through MCP support, Citadel Securities takes a major stake in Crypto.com, and Kraken launches institutional crypto options.
The Future of Crypto Payments: Why Merchants Will Go Hybrid | Tim Ferland | LetKnow Pay
The Future of Crypto Payments: Why Merchants Will Go Hybrid | Tim Ferland | LetKnow Pay
The Future of Crypto Payments: Why Merchants Will Go Hybrid | Tim Ferland | LetKnow Pay
The Future of Crypto Payments: Why Merchants Will Go Hybrid | Tim Ferland | LetKnow Pay
The Future of Crypto Payments: Why Merchants Will Go Hybrid | Tim Ferland | LetKnow Pay
The Future of Crypto Payments: Why Merchants Will Go Hybrid | Tim Ferland | LetKnow Pay
Will crypto payments become a standard payment option for merchants?
In this interview from iFX EXPO International 2026, Yam Yehoshua, Editor-in-Chief of Finance Magnates, speaks with Tim Ferland, CEO of LetKnow Pay, about the current state of crypto payments, merchant adoption, regulation, and why the future of payments is likely to be a hybrid of traditional finance and digital assets.
Tim explains how LetKnow Pay enables businesses to accept cryptocurrency while receiving fiat payouts, making crypto payments simple for merchants without exposing them to the complexity of managing digital assets.
In this interview, you'll learn:
- Why merchant adoption is growing more slowly than many expected
- The biggest misconceptions businesses have about crypto payments
- Why education is more important than technology
- How banks continue to influence crypto adoption
- The impact of MiCA and global crypto regulation
- Why Tim believes the future will combine centralized and decentralized finance
- What's next for LetKnow Pay's payment solutions
Whether you're a broker, payment provider, fintech executive, or simply interested in the future of digital payments, this interview offers valuable insights into where the market is heading.
#CryptoPayments #Crypto #Payments #Fintech #DigitalAssets #Blockchain #Stablecoins #Merchants #FintechNews #FinanceMagnates #iFXEXPO #CryptoAdoption
FM Daily Brief – 16 July 2026
FM Daily Brief – 16 July 2026
FM Daily Brief – 16 July 2026
FM Daily Brief – 16 July 2026
FM Daily Brief – 16 July 2026
FM Daily Brief – 16 July 2026
Today's Thursday, the 16th of July 2026, and these are our main stories: Cyprus authorities dismantle a major crypto investment fraud network, Eightcap brings its simulated trading challenges to TradingView, and Belgium reports a sharp fall in WhatsApp stock-tip fraud losses.
Today's Thursday, the 16th of July 2026, and these are our main stories: Cyprus authorities dismantle a major crypto investment fraud network, Eightcap brings its simulated trading challenges to TradingView, and Belgium reports a sharp fall in WhatsApp stock-tip fraud losses.
Today's Thursday, the 16th of July 2026, and these are our main stories: Cyprus authorities dismantle a major crypto investment fraud network, Eightcap brings its simulated trading challenges to TradingView, and Belgium reports a sharp fall in WhatsApp stock-tip fraud losses.
Today's Thursday, the 16th of July 2026, and these are our main stories: Cyprus authorities dismantle a major crypto investment fraud network, Eightcap brings its simulated trading challenges to TradingView, and Belgium reports a sharp fall in WhatsApp stock-tip fraud losses.
Today's Thursday, the 16th of July 2026, and these are our main stories: Cyprus authorities dismantle a major crypto investment fraud network, Eightcap brings its simulated trading challenges to TradingView, and Belgium reports a sharp fall in WhatsApp stock-tip fraud losses.
Today's Thursday, the 16th of July 2026, and these are our main stories: Cyprus authorities dismantle a major crypto investment fraud network, Eightcap brings its simulated trading challenges to TradingView, and Belgium reports a sharp fall in WhatsApp stock-tip fraud losses.