

Gold traded near $4,580 per ounce on Monday, May 4, 2026, falling more than 1% on the session and roughly 2% from last Friday's intraday peak as a firmer dollar, rising Treasury yields, and a fresh tanker strike in the Strait of Hormuz pushed XAU/USD to its lowest level since late March.
Intraday selling tagged $4,560, the metal's first sub-$4,580 print in more than five weeks. Spot now trades approximately 18% below the $5,595 January 29 all-time high.
The harder question is not why gold is going down today. It is whether anything structurally has changed on the chart. From my reading, it has not.
Follow me on X for real-time market analysis: @ChmielDk.
What pushed gold lower on May 4?
The session move came from the same paradox that has defined the metals tape for two months. The Middle East war pushes oil higher, oil pushes inflation expectations higher, inflation expectations keep the Federal Reserve frozen, and a frozen Fed keeps real yields elevated. Higher real yields raise the opportunity cost of a non-yielding asset.
"Gold declined on Monday as the metal faces a stable US dollar and rising Treasury yields. Ongoing inflation concerns arising from elevated oil prices could continue to push monetary policy expectations toward more caution, lifting yields and weighing on non-yielding assets such as bullion," said Paolo Broccardo, CEO at BankPro.
- Why Is Gold Falling? Gold Price Risk Crash to $3,400
- How High Can Gold Go? UBP Rebuilds Bullion Positions and Reaffirms $6,000 Gold Price Prediction for 2026
- Why Gold Is Surging With Silver and Why Experts Predict $7,000 Price in 2026
Broccardo's framing matches the price action: the dollar index sits firm above 98, ten-year yields are in the 4.3-4.4% range, and a tanker was struck by projectiles in Hormuz earlier today.
The mechanical drivers behind today's session:
- Dollar Index holding above 98, ten-year Treasury yields in the 4.3-4.4% range
- Tanker struck by projectiles in the Strait of Hormuz Monday morning, oil bid
- ISM Prices Paid printed 84.6 in April, the highest reading since April 2022
- Gold-backed ETFs in net outflows last week after a three-week inflow streak
- CME FedWatch shows over 90% probability the Fed holds at 3.50-3.75% in June
Gold technical analysis: the channel still holds
In 15 years reading gold charts, I have learned that the most useful response to a 2% session is not to ask "why" but to ask whether anything structurally changed. Today, on the daily chart, nothing has.
XAU/USD remains inside the same dual consolidation it has traded for over a month. Two overlapping boxes define it. The faster box is bounded by exponential moving averages: the 200 EMA (blue) at $4,300 per ounce on the floor, the 50 EMA (red) at $4,740 per ounce on the ceiling.
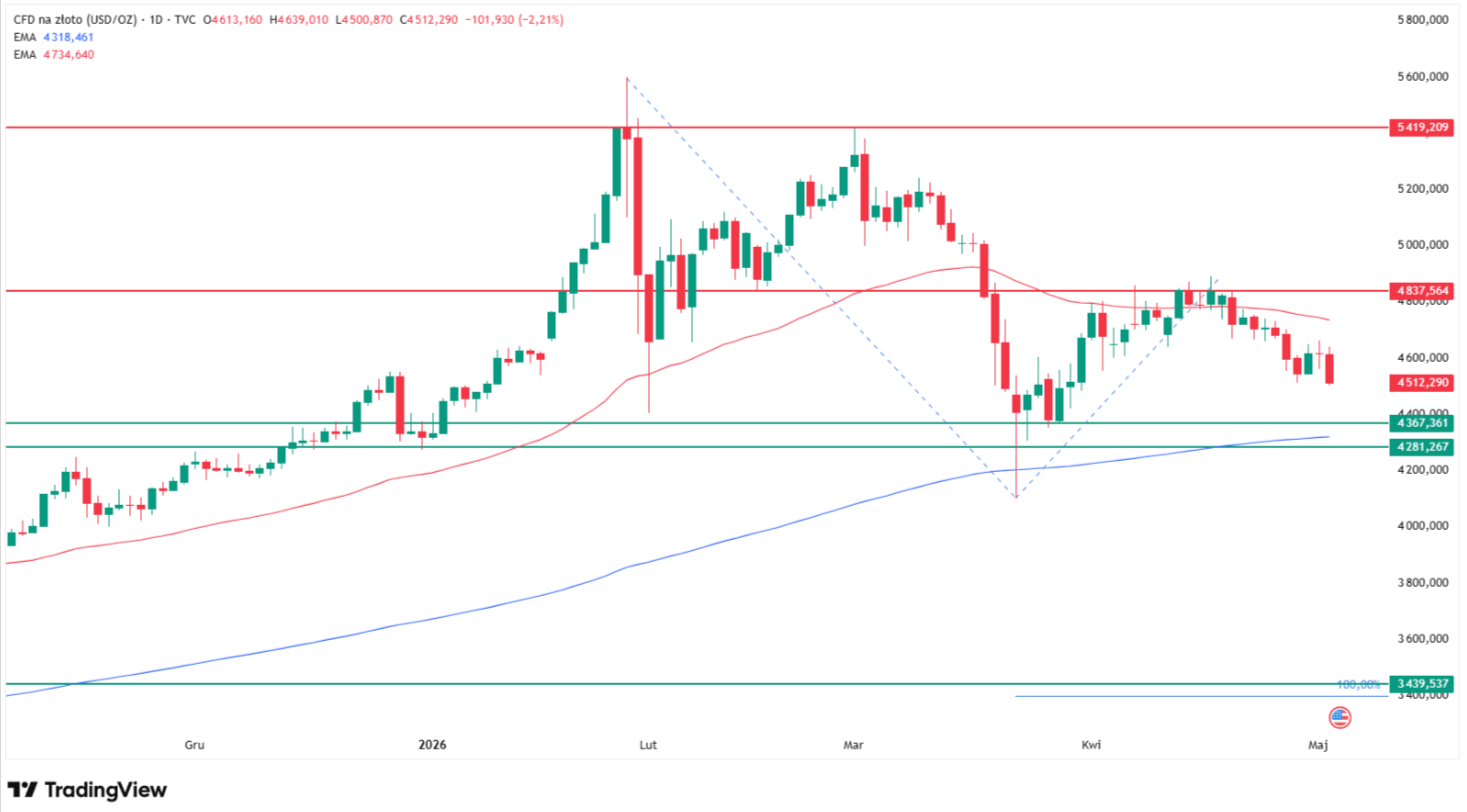
The slower box is bounded by horizontal price action: the October 2025 highs in the $4,284-$4,400 range as the floor, the April 2026 highs near $4,840 as the ceiling.
Today's drop did not break either floor. The 50 EMA at $4,740 is now acting as dynamic resistance, and price is moving in the direction of the slower 200 EMA at $4,300. That is the next test.
Level | Type | Notes |
$4,840 | Resistance | April 2026 highs, multi-day rejection |
$4,740 | Resistance | 50 EMA, dynamic resistance |
$4,580 | Spot | Monday May 4 close area |
$4,560 | Intraday low | Lowest print since late March |
$4,300-$4,400 | Support | 200 EMA + October 2025 highs cluster |
$3,400 | Extreme target | April 2025 highs, 100% Fibonacci extension |
Above the 50 EMA, momentum reverses to the upside and the consolidation upper bound at $4,840 comes back into focus. Below $4,300, the picture changes materially. As I wrote in my April 28 analysis on gold's $3,400 risk, a weekly close below the EMA cluster is the trigger for a sustained move toward the 200 EMA test, then $4,000, then the April 2025 highs at $3,400 on a 100% Fibonacci extension. That sequence is the only path that turns today's session move into something structural.
"Gold is no longer moving according to the classical rules investors are accustomed to, and this paradox is not incidental, it reflects a deeper structural shift in the market. In my view, the notable decline in gold prices near $4,626 despite escalating geopolitical risks and heightened global uncertainty reveals that traditional drivers such as the safe haven narrative are no longer sufficient to explain short-term price action,” Rania Gule, Senior Market Analyst at XS.com MENA, added.
What's next for gold?
Two paths from here. Both depend on whether the channel holds.
Bull case:
- A break above $4,840 reopens the path to $5,420, the January 28 record session high and Goldman Sachs' standing year-end 2026 target. As my prior coverage of Goldman's $5,400 forecast detailed, the bank's thesis rests on real-yield compression once the Fed's stagflation trap becomes consensus.
- Above $5,420, gold re-enters the price-discovery zone toward the $5,595 all-time high.
Bear case:
- A weekly close below $4,300 invalidates the consolidation and shifts the bias toward a $3,400 measured target, anchored by April 2025 resistance. As my earlier $3,400 scenario analysis showed, that level sits roughly 26% below current spot.
- The 200 EMA at $4,300 is the line. Anything else is noise.
The institutional range is wide. UBP holds a $6,000 year-end target, as my prior coverage of UBP's bullion repositioning detailed, while the consensus institutional clip tracked in the FinanceMagnates.com 2026 gold prediction roundup sits closer to $4,750.
My read: the structural backdrop, central bank buying, supply discipline, dollar pressure, has not changed today. The price action has not changed today. What has changed is one more session of dollar strength inside an existing consolidation. That is a difference worth flagging.
FAQ
Why is gold going down today, May 4, 2026?
Gold fell roughly 1.4% on Monday, May 4, 2026, to a session low of $4,560 because the US dollar index held above 98, ten-year Treasury yields traded in the 4.3-4.4% range, and a tanker was struck by projectiles in the Strait of Hormuz, reinforcing inflation concerns that keep the Fed on hold. Higher real yields raise the opportunity cost of holding a non-yielding asset, even with active geopolitical risk in play.
How low can gold go?
If the $4,300 EMA cluster fails on a weekly closing basis, the next major support sits at $4,000, then $3,400, the April 2025 highs that capped price for four months on a 100% Fibonacci extension. That extreme scenario implies roughly 26% downside from current spot. The trigger I am watching is a weekly close below $4,281, the lower edge of the October 2025 highs cluster.
What is the next major resistance for gold?
The 50 EMA at $4,740 is the immediate dynamic resistance. Above it, the April 2026 highs near $4,840 cap the consolidation. A weekly close above $4,840 would reopen the path to $5,420, the January 28 record session high, with $5,595 as the all-time intraday high beyond that. Goldman Sachs' standing year-end 2026 target of $5,400 sits inside this corridor.


