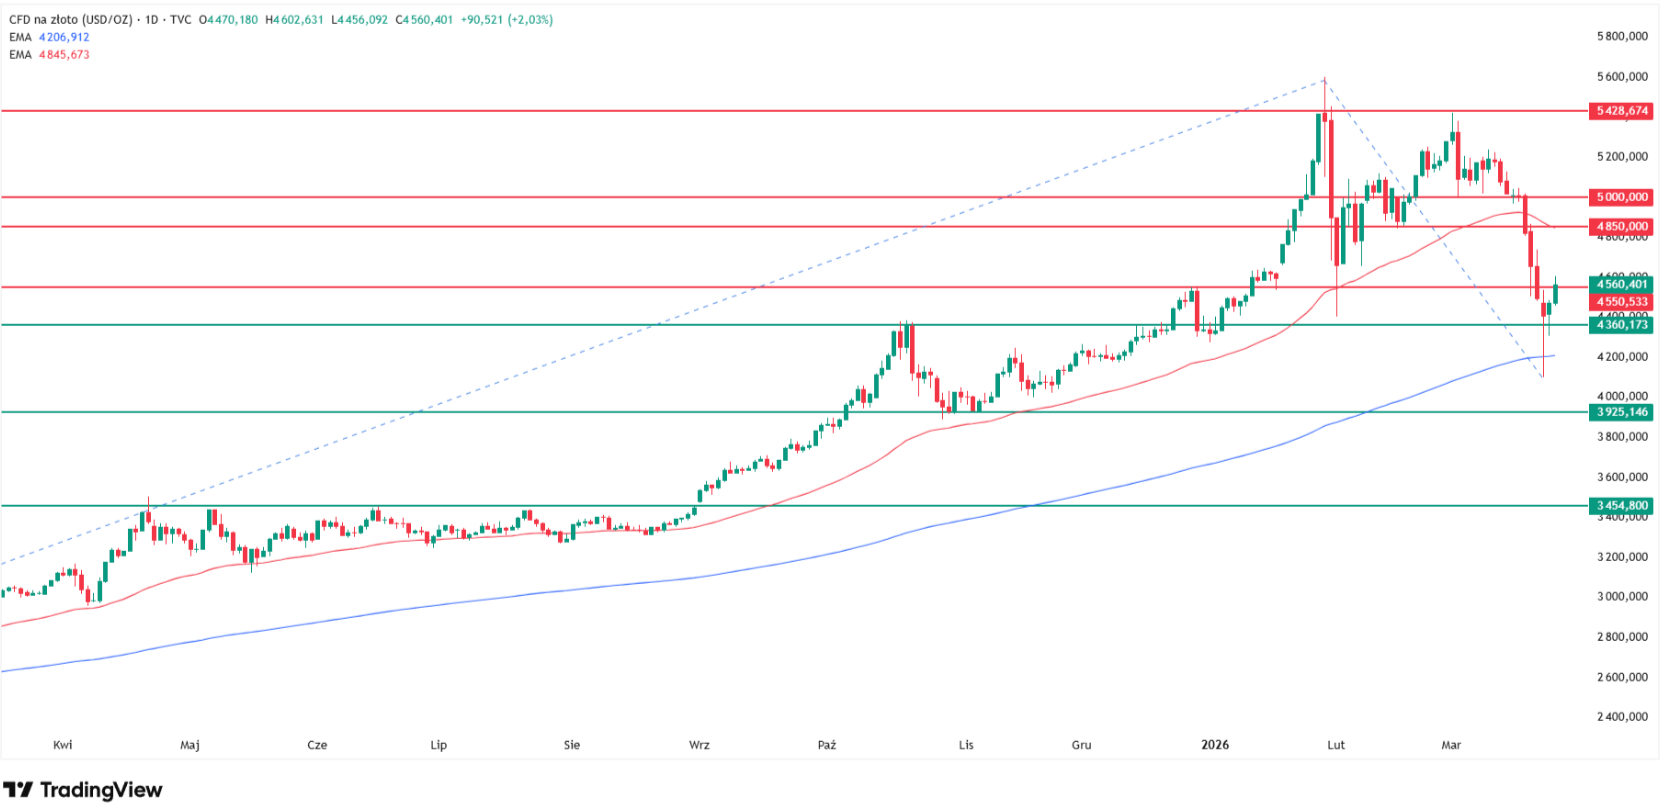
Gold is rising 1.9% to $4,555 per ounce on Wednesday, March 25, recovering sharply after a textbook pin bar reversal.
If the rejection holds, gold has a clear path back toward the all-time high zone at $5,600.
Saxo Bank has an extreme gold price prediction of $10,000, while Fibonacci extension targets on my chart reach $7,000-$9,000.
Why gold price is going up today and what are the newest gold price forecasts?
Nine
sessions of selling. The worst week for gold in 40 years. A terrifying intraday
drop to $4,100 that briefly looked like the bull market was over. And then -
nothing. The sellers ran out of ammunition right at the most important levels
on the chart, the buyers stepped in forcefully, and Wednesday, March 25, is
telling a completely different story: gold is up 1.9% and trading at
$4,555 per ounce, having recovered more than $450 from Monday's lows in
less than 48 hours.
This is not
a random bounce. This is a technically significant reversal at exactly the
right levels. And it changes the near-term outlook for gold considerably.
In this
article, I will break down my updated technical analysis including the
Fibonacci extension targets that could take gold above $7,000, examine why the
reversal happened where it did, and compile the most comprehensive set of 2026
gold price predictions from every major institution currently covering the
market. Based on my over 15 years of experience as an analyst and retail
investor, here is what I am watching.
Follow
me on X for real-time gold market analysis: @ChmielDk
Why Gold Is Surging Today?
The Pin Bar That Matters
Monday's
intraday move to $4,100 was alarming. But what happened next was more important
than the drop itself. Before Monday's session closed, gold recovered
decisively, leaving a pin bar with a very long lower wick and a narrow
body on the daily chart. That candle rejected two critical supports
simultaneously: the 200-day MA at approximately $4,200 and
the October 2025 historical highs at $4,306. Both held.
Tuesday's
session produced a second pin bar - shorter lower wick, same rejection message
- confirming that Monday's reversal was not a one-session anomaly. Wednesday is
the follow-through: a 1.9% rally to $4,555 that is now pushing
gold back into the resistance zone that Konrad Ryczko, analyst at BossaFX,
identifies as structurally important.
Ryczko
frames the current situation precisely: "For an outside observer it might
seem that the prospect of reduced geopolitical tensions should result in
outflows from safe-haven assets. Yet gold remains in recovery mode after the
crash from around $5,000 to $4,100. The metal is gaining on a technical basis
and slightly weaker USD.
Additionally,
the market is living by the thesis that 'people buy gold when they fear for the
future, and sell when they fear for the present.'" He identifies the
current resistance zone at $4,578-$4,686 as the key area gold
needs to clear to extend the recovery - exactly the zone being tested on
Wednesday.
The
Trump-Iran diplomatic signal was the catalyst. As reports emerged that the US
had postponed further military action on Iranian power plants and described
"effective talks," oil reversed, the dollar softened slightly, and
the safe-haven bid rotated back into precious metals. That macro backdrop gave
the technically oversold gold chart the permission it needed to bounce.
XAU/USD Technical
Analysis: A Buy Signal With a Long Journey Ahead
As my chart
shows, the double pin bar rejection of the 200 EMA and the $4,306 October highs
is one of the clearest technical buy signals I have seen on the gold chart this
year. In the previous
gold analysis from Monday, I identified these exact levels as the final structural defence of the
bull trend. The market tested them and rejected them decisively. That is the
textbook definition of a support confirmation.
Setting
fundamentals and geopolitics aside - which is admittedly very difficult in the
current environment - the technical picture now points toward a potential
recovery toward the all-time high zone at $5,600 set on
January 29. The path is not clear of obstacles.
The first
resistance is the 50-day EMA at approximately $4,800, where a
cluster of sellers who averaged into the decline will likely defend. Above
that, the $5,000 psychological level represents both a round
number and a zone of prior support that has now flipped to resistance. But
above $5,000, the road back to $5,600 stands technically open.
Why gold price is going up today? Source: Tradingview.com
The more
speculative but mathematically grounded analysis comes from the Fibonacci
extension. Measuring the entire 2025 uptrend from its base and then the
2026 corrective decline, the 100% Fibonacci extension falls at just
over $7,000 per ounce - representing approximately 54% upside from
Wednesday's $4,555.
The 161.8%
extension lands just below $9,000 - approximately 97% upside from
current levels. I present these as analytical curiosities from the chart rather
than primary price targets, but they reflect the mathematical potential of the
trend structure if the bull market resumes in full.
Level
Type
Notes
$9,000
Fibonacci 161.8% extension
~97% upside from current
$7,000
Fibonacci 100% extension
~54% upside from current
$5,600
All-time high (Jan 29, 2026)
ATH
retest - ultimate bull target
$5,000
Psychological resistance
Former support, now resistance
$4,800
50-day EMA
First
major resistance on recovery
$4,578-$4,686
Key resistance zone (Ryczko)
Must
clear to extend rally
$4,555
Current price (Mar 25)
+1.9% Wednesday
$4,306
October 2025 highs
Held as support Monday
$4,200
200-day EMA
Bull/bear
dividing line, held
$4,100
Monday intraday low
Pin bar reversal point
Why the 200 EMA Held: The
Structural Case Has Not Changed
The
structural supports that drove gold from $2,600 to $5,600 remain intact, and
they are precisely why buyers stepped in at $4,100-$4,200 rather than letting
the selling continue. As goldsilver.com noted in their March analysis:
"The structural reasons gold ran from $2,600 to over $5,000 in twelve
months haven't changed. Central banks are still buying. The dollar outlook is
still soft. US fiscal deficits aren't shrinking".
The Iran
de-escalation also changed one of the key negative inputs for gold. Rising oil
had been feeding inflation expectations that kept the Fed hawkish and yields
elevated - the primary mechanism through which the Middle East conflict was
actually hurting gold by the monetary channel.
A pause in
the conflict reduces oil, reduces inflation pressure, reduces rate
expectations, weakens the dollar, and simultaneously adds back gold's
safe-haven premium. All four inputs move in gold's favour simultaneously -
which explains the speed and conviction of Wednesday's recovery.
The 2026 Gold Price
Predictions: Every Major Institution
The comprehensive
gold price prediction analysis from February 17 established the full institutional
forecast landscape, and the March crash has not fundamentally changed any of
the major banks' year-end targets - if anything, the 23% correction has made
those targets easier to maintain without appearing detached from reality.
JPMorgan's
$6,300 forecast -
published February 3 and reaffirmed through the crash - is built on
approximately 800 tonnes of projected central bank gold purchases in 2026 and
private-sector diversification away from dollar-denominated assets. Wells Fargo's
$6,100-$6,300 range from
February 8 sits in the same zone. Both forecasts imply a 35-38% rally from
Wednesday's price - achievable if the pin bar reversal has genuinely marked the
bottom of the correction.
The notable
contrarians are HSBC at $4,450 and Standard Chartered at $4,488 - both
published before the crash, which means the market has already traded through
their year-end targets at the recent lows. The Reuters poll median of $4,746 across
30 analysts is the most genuinely consensus-based figure and sits approximately
4% above Wednesday's price.
Institution
Target 2026
JPMorgan
$6,300
Wells Fargo
$6,100-$6,300
UBS
$6,200 (high $7,200)
BNP Paribas
$5,620 avg / $6,250 peak
Deutsche Bank
$6,000
Societe Generale
$6,000
Morgan Stanley
$5,700 (bull case)
ANZ Bank
$5,800
Goldman Sachs
$5,400
Reuters poll median
$4,746
TD Securities
~$5,000 avg
HSBC
$4,450
Standard Chartered
$4,488
My chart (Fibonacci 100%)
$7,000+
My chart (Fibonacci 161.8%)
~$9,000
Saxo Bank
$10,000
FAQ
Why is gold going up on
March 25, 2026?
Gold is
rising 1.9% to $4,555 following a textbook double pin bar reversal at the
200-day EMA ($4,200) and October 2025 historical highs ($4,306) during Monday's
intraday session. Trump's signal of postponed military action on Iranian power
plants and "effective talks" with Iran removed the key oil-inflation
mechanism that had been suppressing gold through the monetary channel -
simultaneously reducing oil prices, softening the dollar, and restoring gold's
safe-haven bid.
How high can gold go in
2026?
As shown on
my chart, the immediate recovery path runs through $4,578-$4,686 resistance
(Ryczko), then the 50-day EMA at $4,800, then the
psychological $5,000 level, before the road to the $5,600
all-time high becomes clear. JPMorgan's $6,300 year-end target implies
38% upside from Wednesday. My Fibonacci 100% extension targets $7,000+ and
the 161.8% extension sits near $9,000.
What is the gold price
prediction for 2026?
The comprehensive
institutional forecast roundup shows the Wall Street consensus clustering between $5,400
and $6,300 for year-end 2026, with JPMorgan, Wells Fargo, Deutsche
Bank, Societe Generale, and UBS all in that range. The Reuters poll median of
30 analysts sits at $4,746 - approximately 4% above
Wednesday's price and the most conservative credible consensus. Saxo Bank's
extreme scenario at $10,000 matches the territory my 161.8%
Fibonacci extension identifies.
Is the gold correction
over?
The pin bar
reversal at the 200 EMA is the strongest technical buy signal gold has produced
since the January blow-off top. However, one or two sessions do not confirm a
trend reversal. Gold needs to close above $4,578-$4,686 (Ryczko's
resistance zone) on a sustained basis and ultimately reclaim $4,800 (50 EMA) to
confirm that the correction has genuinely ended rather than simply paused. The
200 EMA at $4,200 remains the definitive bull/bear line.
Nine
sessions of selling. The worst week for gold in 40 years. A terrifying intraday
drop to $4,100 that briefly looked like the bull market was over. And then -
nothing. The sellers ran out of ammunition right at the most important levels
on the chart, the buyers stepped in forcefully, and Wednesday, March 25, is
telling a completely different story: gold is up 1.9% and trading at
$4,555 per ounce, having recovered more than $450 from Monday's lows in
less than 48 hours.
This is not
a random bounce. This is a technically significant reversal at exactly the
right levels. And it changes the near-term outlook for gold considerably.
In this
article, I will break down my updated technical analysis including the
Fibonacci extension targets that could take gold above $7,000, examine why the
reversal happened where it did, and compile the most comprehensive set of 2026
gold price predictions from every major institution currently covering the
market. Based on my over 15 years of experience as an analyst and retail
investor, here is what I am watching.
Follow
me on X for real-time gold market analysis: @ChmielDk
Why Gold Is Surging Today?
The Pin Bar That Matters
Monday's
intraday move to $4,100 was alarming. But what happened next was more important
than the drop itself. Before Monday's session closed, gold recovered
decisively, leaving a pin bar with a very long lower wick and a narrow
body on the daily chart. That candle rejected two critical supports
simultaneously: the 200-day MA at approximately $4,200 and
the October 2025 historical highs at $4,306. Both held.
Tuesday's
session produced a second pin bar - shorter lower wick, same rejection message
- confirming that Monday's reversal was not a one-session anomaly. Wednesday is
the follow-through: a 1.9% rally to $4,555 that is now pushing
gold back into the resistance zone that Konrad Ryczko, analyst at BossaFX,
identifies as structurally important.
Ryczko
frames the current situation precisely: "For an outside observer it might
seem that the prospect of reduced geopolitical tensions should result in
outflows from safe-haven assets. Yet gold remains in recovery mode after the
crash from around $5,000 to $4,100. The metal is gaining on a technical basis
and slightly weaker USD.
Additionally,
the market is living by the thesis that 'people buy gold when they fear for the
future, and sell when they fear for the present.'" He identifies the
current resistance zone at $4,578-$4,686 as the key area gold
needs to clear to extend the recovery - exactly the zone being tested on
Wednesday.
The
Trump-Iran diplomatic signal was the catalyst. As reports emerged that the US
had postponed further military action on Iranian power plants and described
"effective talks," oil reversed, the dollar softened slightly, and
the safe-haven bid rotated back into precious metals. That macro backdrop gave
the technically oversold gold chart the permission it needed to bounce.
XAU/USD Technical
Analysis: A Buy Signal With a Long Journey Ahead
As my chart
shows, the double pin bar rejection of the 200 EMA and the $4,306 October highs
is one of the clearest technical buy signals I have seen on the gold chart this
year. In the previous
gold analysis from Monday, I identified these exact levels as the final structural defence of the
bull trend. The market tested them and rejected them decisively. That is the
textbook definition of a support confirmation.
Setting
fundamentals and geopolitics aside - which is admittedly very difficult in the
current environment - the technical picture now points toward a potential
recovery toward the all-time high zone at $5,600 set on
January 29. The path is not clear of obstacles.
The first
resistance is the 50-day EMA at approximately $4,800, where a
cluster of sellers who averaged into the decline will likely defend. Above
that, the $5,000 psychological level represents both a round
number and a zone of prior support that has now flipped to resistance. But
above $5,000, the road back to $5,600 stands technically open.
Why gold price is going up today? Source: Tradingview.com
The more
speculative but mathematically grounded analysis comes from the Fibonacci
extension. Measuring the entire 2025 uptrend from its base and then the
2026 corrective decline, the 100% Fibonacci extension falls at just
over $7,000 per ounce - representing approximately 54% upside from
Wednesday's $4,555.
The 161.8%
extension lands just below $9,000 - approximately 97% upside from
current levels. I present these as analytical curiosities from the chart rather
than primary price targets, but they reflect the mathematical potential of the
trend structure if the bull market resumes in full.
Level
Type
Notes
$9,000
Fibonacci 161.8% extension
~97% upside from current
$7,000
Fibonacci 100% extension
~54% upside from current
$5,600
All-time high (Jan 29, 2026)
ATH
retest - ultimate bull target
$5,000
Psychological resistance
Former support, now resistance
$4,800
50-day EMA
First
major resistance on recovery
$4,578-$4,686
Key resistance zone (Ryczko)
Must
clear to extend rally
$4,555
Current price (Mar 25)
+1.9% Wednesday
$4,306
October 2025 highs
Held as support Monday
$4,200
200-day EMA
Bull/bear
dividing line, held
$4,100
Monday intraday low
Pin bar reversal point
Why the 200 EMA Held: The
Structural Case Has Not Changed
The
structural supports that drove gold from $2,600 to $5,600 remain intact, and
they are precisely why buyers stepped in at $4,100-$4,200 rather than letting
the selling continue. As goldsilver.com noted in their March analysis:
"The structural reasons gold ran from $2,600 to over $5,000 in twelve
months haven't changed. Central banks are still buying. The dollar outlook is
still soft. US fiscal deficits aren't shrinking".
The Iran
de-escalation also changed one of the key negative inputs for gold. Rising oil
had been feeding inflation expectations that kept the Fed hawkish and yields
elevated - the primary mechanism through which the Middle East conflict was
actually hurting gold by the monetary channel.
A pause in
the conflict reduces oil, reduces inflation pressure, reduces rate
expectations, weakens the dollar, and simultaneously adds back gold's
safe-haven premium. All four inputs move in gold's favour simultaneously -
which explains the speed and conviction of Wednesday's recovery.
The 2026 Gold Price
Predictions: Every Major Institution
The comprehensive
gold price prediction analysis from February 17 established the full institutional
forecast landscape, and the March crash has not fundamentally changed any of
the major banks' year-end targets - if anything, the 23% correction has made
those targets easier to maintain without appearing detached from reality.
JPMorgan's
$6,300 forecast -
published February 3 and reaffirmed through the crash - is built on
approximately 800 tonnes of projected central bank gold purchases in 2026 and
private-sector diversification away from dollar-denominated assets. Wells Fargo's
$6,100-$6,300 range from
February 8 sits in the same zone. Both forecasts imply a 35-38% rally from
Wednesday's price - achievable if the pin bar reversal has genuinely marked the
bottom of the correction.
The notable
contrarians are HSBC at $4,450 and Standard Chartered at $4,488 - both
published before the crash, which means the market has already traded through
their year-end targets at the recent lows. The Reuters poll median of $4,746 across
30 analysts is the most genuinely consensus-based figure and sits approximately
4% above Wednesday's price.
Institution
Target 2026
JPMorgan
$6,300
Wells Fargo
$6,100-$6,300
UBS
$6,200 (high $7,200)
BNP Paribas
$5,620 avg / $6,250 peak
Deutsche Bank
$6,000
Societe Generale
$6,000
Morgan Stanley
$5,700 (bull case)
ANZ Bank
$5,800
Goldman Sachs
$5,400
Reuters poll median
$4,746
TD Securities
~$5,000 avg
HSBC
$4,450
Standard Chartered
$4,488
My chart (Fibonacci 100%)
$7,000+
My chart (Fibonacci 161.8%)
~$9,000
Saxo Bank
$10,000
FAQ
Why is gold going up on
March 25, 2026?
Gold is
rising 1.9% to $4,555 following a textbook double pin bar reversal at the
200-day EMA ($4,200) and October 2025 historical highs ($4,306) during Monday's
intraday session. Trump's signal of postponed military action on Iranian power
plants and "effective talks" with Iran removed the key oil-inflation
mechanism that had been suppressing gold through the monetary channel -
simultaneously reducing oil prices, softening the dollar, and restoring gold's
safe-haven bid.
How high can gold go in
2026?
As shown on
my chart, the immediate recovery path runs through $4,578-$4,686 resistance
(Ryczko), then the 50-day EMA at $4,800, then the
psychological $5,000 level, before the road to the $5,600
all-time high becomes clear. JPMorgan's $6,300 year-end target implies
38% upside from Wednesday. My Fibonacci 100% extension targets $7,000+ and
the 161.8% extension sits near $9,000.
What is the gold price
prediction for 2026?
The comprehensive
institutional forecast roundup shows the Wall Street consensus clustering between $5,400
and $6,300 for year-end 2026, with JPMorgan, Wells Fargo, Deutsche
Bank, Societe Generale, and UBS all in that range. The Reuters poll median of
30 analysts sits at $4,746 - approximately 4% above
Wednesday's price and the most conservative credible consensus. Saxo Bank's
extreme scenario at $10,000 matches the territory my 161.8%
Fibonacci extension identifies.
Is the gold correction
over?
The pin bar
reversal at the 200 EMA is the strongest technical buy signal gold has produced
since the January blow-off top. However, one or two sessions do not confirm a
trend reversal. Gold needs to close above $4,578-$4,686 (Ryczko's
resistance zone) on a sustained basis and ultimately reclaim $4,800 (50 EMA) to
confirm that the correction has genuinely ended rather than simply paused. The
200 EMA at $4,200 remains the definitive bull/bear line.
Damian Chmiel is a Senior Analyst & Editor at Finance Magnates with more than 15 years of experience in the CFD and online trading industry. Active as both a trader and journalist since 2010, he focuses on broker coverage, fintech innovation, and regulatory developments across Europe, the Middle East, and Asia.
His work includes interviews with C-level leaders at major brokerages and fintech platforms, as well as co-authoring Finance Magnates’ quarterly industry benchmarking reports. Damian’s reporting is data-driven, market-aware, and grounded in direct industry engagement. His analysis and commentary have also been cited by external media outlets, including Investing.com, Binance, The Asset, Stockhead, and Dispatch.
Education:
MA in Finance and Accounting, Cracow University of Economics
From eToro to Five Trading Platforms: X Scales Cashtags into a Distribution Channel
Featured Videos
CXM Group to Buy TD Markets; Interactive Brokers Raises Dividend
CXM Group to Buy TD Markets; Interactive Brokers Raises Dividend
CXM Group to Buy TD Markets; Interactive Brokers Raises Dividend
CXM Group to Buy TD Markets; Interactive Brokers Raises Dividend
Today’s financial news recap covers CXM Group agrees to acquire TD Markets, Interactive Brokers raises its dividend, Your Bourse and 4XPORTAL formalise a technology partnership, and IC completes its rebranding from IC Markets.
Finance Magnates Daily Recap brings you the latest news from forex and CFD brokers, fintech, payments, cryptocurrency, digital assets, trading platforms, financial regulation and global markets.
Get the key company news, executive moves, deals, regulatory updates and market developments of the day, in just a few minutes. New episodes published every weekday.
Read more: https://www.financemagnates.com
#FinanceMagnates #ForexNews #FintechNews
Today’s financial news recap covers CXM Group agrees to acquire TD Markets, Interactive Brokers raises its dividend, Your Bourse and 4XPORTAL formalise a technology partnership, and IC completes its rebranding from IC Markets.
Finance Magnates Daily Recap brings you the latest news from forex and CFD brokers, fintech, payments, cryptocurrency, digital assets, trading platforms, financial regulation and global markets.
Get the key company news, executive moves, deals, regulatory updates and market developments of the day, in just a few minutes. New episodes published every weekday.
Read more: https://www.financemagnates.com
#FinanceMagnates #ForexNews #FintechNews
Today’s financial news recap covers CXM Group agrees to acquire TD Markets, Interactive Brokers raises its dividend, Your Bourse and 4XPORTAL formalise a technology partnership, and IC completes its rebranding from IC Markets.
Finance Magnates Daily Recap brings you the latest news from forex and CFD brokers, fintech, payments, cryptocurrency, digital assets, trading platforms, financial regulation and global markets.
Get the key company news, executive moves, deals, regulatory updates and market developments of the day, in just a few minutes. New episodes published every weekday.
Read more: https://www.financemagnates.com
#FinanceMagnates #ForexNews #FintechNews
Today’s financial news recap covers CXM Group agrees to acquire TD Markets, Interactive Brokers raises its dividend, Your Bourse and 4XPORTAL formalise a technology partnership, and IC completes its rebranding from IC Markets.
Finance Magnates Daily Recap brings you the latest news from forex and CFD brokers, fintech, payments, cryptocurrency, digital assets, trading platforms, financial regulation and global markets.
Get the key company news, executive moves, deals, regulatory updates and market developments of the day, in just a few minutes. New episodes published every weekday.
Read more: https://www.financemagnates.com
#FinanceMagnates #ForexNews #FintechNews
Trade Nation Enters Poland; FCA Finds Gaps at Seven Brokers
Trade Nation Enters Poland; FCA Finds Gaps at Seven Brokers
Trade Nation Enters Poland; FCA Finds Gaps at Seven Brokers
Trade Nation Enters Poland; FCA Finds Gaps at Seven Brokers
Trade Nation Enters Poland; FCA Finds Gaps at Seven Brokers
Trade Nation Enters Poland; FCA Finds Gaps at Seven Brokers
Today’s financial news recap covers Trade Nation expands into Poland, the FCA finds surveillance gaps at seven UK retail brokers, perpetual futures on US stocks could launch within weeks, and Australia's crypto platforms face a new regulatory deadline.
Finance Magnates Daily Recap brings you the latest news from forex and CFD brokers, fintech, payments, cryptocurrency, digital assets, trading platforms, financial regulation and global markets.
Get the key company news, executive moves, deals, regulatory updates and market developments of the day, in just a few minutes. New episodes published every weekday.
Read more: https://www.financemagnates.com
#FinanceMagnates #ForexNews #FintechNews
Today’s financial news recap covers Trade Nation expands into Poland, the FCA finds surveillance gaps at seven UK retail brokers, perpetual futures on US stocks could launch within weeks, and Australia's crypto platforms face a new regulatory deadline.
Finance Magnates Daily Recap brings you the latest news from forex and CFD brokers, fintech, payments, cryptocurrency, digital assets, trading platforms, financial regulation and global markets.
Get the key company news, executive moves, deals, regulatory updates and market developments of the day, in just a few minutes. New episodes published every weekday.
Read more: https://www.financemagnates.com
#FinanceMagnates #ForexNews #FintechNews
Today’s financial news recap covers Trade Nation expands into Poland, the FCA finds surveillance gaps at seven UK retail brokers, perpetual futures on US stocks could launch within weeks, and Australia's crypto platforms face a new regulatory deadline.
Finance Magnates Daily Recap brings you the latest news from forex and CFD brokers, fintech, payments, cryptocurrency, digital assets, trading platforms, financial regulation and global markets.
Get the key company news, executive moves, deals, regulatory updates and market developments of the day, in just a few minutes. New episodes published every weekday.
Read more: https://www.financemagnates.com
#FinanceMagnates #ForexNews #FintechNews
Today’s financial news recap covers Trade Nation expands into Poland, the FCA finds surveillance gaps at seven UK retail brokers, perpetual futures on US stocks could launch within weeks, and Australia's crypto platforms face a new regulatory deadline.
Finance Magnates Daily Recap brings you the latest news from forex and CFD brokers, fintech, payments, cryptocurrency, digital assets, trading platforms, financial regulation and global markets.
Get the key company news, executive moves, deals, regulatory updates and market developments of the day, in just a few minutes. New episodes published every weekday.
Read more: https://www.financemagnates.com
#FinanceMagnates #ForexNews #FintechNews
Today’s financial news recap covers Trade Nation expands into Poland, the FCA finds surveillance gaps at seven UK retail brokers, perpetual futures on US stocks could launch within weeks, and Australia's crypto platforms face a new regulatory deadline.
Finance Magnates Daily Recap brings you the latest news from forex and CFD brokers, fintech, payments, cryptocurrency, digital assets, trading platforms, financial regulation and global markets.
Get the key company news, executive moves, deals, regulatory updates and market developments of the day, in just a few minutes. New episodes published every weekday.
Read more: https://www.financemagnates.com
#FinanceMagnates #ForexNews #FintechNews
Today’s financial news recap covers Trade Nation expands into Poland, the FCA finds surveillance gaps at seven UK retail brokers, perpetual futures on US stocks could launch within weeks, and Australia's crypto platforms face a new regulatory deadline.
Finance Magnates Daily Recap brings you the latest news from forex and CFD brokers, fintech, payments, cryptocurrency, digital assets, trading platforms, financial regulation and global markets.
Get the key company news, executive moves, deals, regulatory updates and market developments of the day, in just a few minutes. New episodes published every weekday.
Read more: https://www.financemagnates.com
#FinanceMagnates #ForexNews #FintechNews
FxPro Sells EU Clients to Capital.com; NAGA H1 Profit Revised
FxPro Sells EU Clients to Capital.com; NAGA H1 Profit Revised
FxPro Sells EU Clients to Capital.com; NAGA H1 Profit Revised
FxPro Sells EU Clients to Capital.com; NAGA H1 Profit Revised
FxPro Sells EU Clients to Capital.com; NAGA H1 Profit Revised
FxPro Sells EU Clients to Capital.com; NAGA H1 Profit Revised
Today’s financial news recap covers FxPro agrees to sell its European client book to Capital.com, NAGA raises its first-half profit estimate, Trade Republic prepares a fee-free pension account, and Interactive Brokers introduces Ether staking.
Finance Magnates Daily Recap brings you the latest news from forex and CFD brokers, fintech, payments, cryptocurrency, digital assets, trading platforms, financial regulation and global markets.
Get the key company news, executive moves, deals, regulatory updates and market developments of the day, in just a few minutes. New episodes published every weekday.
Read more: https://www.financemagnates.com
#FinanceMagnates #ForexNews #FintechNews
Today’s financial news recap covers FxPro agrees to sell its European client book to Capital.com, NAGA raises its first-half profit estimate, Trade Republic prepares a fee-free pension account, and Interactive Brokers introduces Ether staking.
Finance Magnates Daily Recap brings you the latest news from forex and CFD brokers, fintech, payments, cryptocurrency, digital assets, trading platforms, financial regulation and global markets.
Get the key company news, executive moves, deals, regulatory updates and market developments of the day, in just a few minutes. New episodes published every weekday.
Read more: https://www.financemagnates.com
#FinanceMagnates #ForexNews #FintechNews
Today’s financial news recap covers FxPro agrees to sell its European client book to Capital.com, NAGA raises its first-half profit estimate, Trade Republic prepares a fee-free pension account, and Interactive Brokers introduces Ether staking.
Finance Magnates Daily Recap brings you the latest news from forex and CFD brokers, fintech, payments, cryptocurrency, digital assets, trading platforms, financial regulation and global markets.
Get the key company news, executive moves, deals, regulatory updates and market developments of the day, in just a few minutes. New episodes published every weekday.
Read more: https://www.financemagnates.com
#FinanceMagnates #ForexNews #FintechNews
Today’s financial news recap covers FxPro agrees to sell its European client book to Capital.com, NAGA raises its first-half profit estimate, Trade Republic prepares a fee-free pension account, and Interactive Brokers introduces Ether staking.
Finance Magnates Daily Recap brings you the latest news from forex and CFD brokers, fintech, payments, cryptocurrency, digital assets, trading platforms, financial regulation and global markets.
Get the key company news, executive moves, deals, regulatory updates and market developments of the day, in just a few minutes. New episodes published every weekday.
Read more: https://www.financemagnates.com
#FinanceMagnates #ForexNews #FintechNews
Today’s financial news recap covers FxPro agrees to sell its European client book to Capital.com, NAGA raises its first-half profit estimate, Trade Republic prepares a fee-free pension account, and Interactive Brokers introduces Ether staking.
Finance Magnates Daily Recap brings you the latest news from forex and CFD brokers, fintech, payments, cryptocurrency, digital assets, trading platforms, financial regulation and global markets.
Get the key company news, executive moves, deals, regulatory updates and market developments of the day, in just a few minutes. New episodes published every weekday.
Read more: https://www.financemagnates.com
#FinanceMagnates #ForexNews #FintechNews
Today’s financial news recap covers FxPro agrees to sell its European client book to Capital.com, NAGA raises its first-half profit estimate, Trade Republic prepares a fee-free pension account, and Interactive Brokers introduces Ether staking.
Finance Magnates Daily Recap brings you the latest news from forex and CFD brokers, fintech, payments, cryptocurrency, digital assets, trading platforms, financial regulation and global markets.
Get the key company news, executive moves, deals, regulatory updates and market developments of the day, in just a few minutes. New episodes published every weekday.
Read more: https://www.financemagnates.com
#FinanceMagnates #ForexNews #FintechNews
Plus500 Plans US Super-App; Investec to Offer IG Platform
Plus500 Plans US Super-App; Investec to Offer IG Platform
Plus500 Plans US Super-App; Investec to Offer IG Platform
Plus500 Plans US Super-App; Investec to Offer IG Platform
Plus500 Plans US Super-App; Investec to Offer IG Platform
Plus500 Plans US Super-App; Investec to Offer IG Platform
Today’s financial news recap covers Plus500 plans a US trading super-app, Investec partners with IG, Trade Republic reports a sevenfold profit jump, and BingX adds thousands of US stocks.
Finance Magnates Daily Recap brings you the latest news from forex and CFD brokers, fintech, payments, cryptocurrency, digital assets, trading platforms, financial regulation and global markets.
Get the key company news, executive moves, deals, regulatory updates and market developments of the day, in just a few minutes. New episodes published every weekday.
Read more: https://www.financemagnates.com
#FinanceMagnates #ForexNews #FintechNews
Today’s financial news recap covers Plus500 plans a US trading super-app, Investec partners with IG, Trade Republic reports a sevenfold profit jump, and BingX adds thousands of US stocks.
Finance Magnates Daily Recap brings you the latest news from forex and CFD brokers, fintech, payments, cryptocurrency, digital assets, trading platforms, financial regulation and global markets.
Get the key company news, executive moves, deals, regulatory updates and market developments of the day, in just a few minutes. New episodes published every weekday.
Read more: https://www.financemagnates.com
#FinanceMagnates #ForexNews #FintechNews
Today’s financial news recap covers Plus500 plans a US trading super-app, Investec partners with IG, Trade Republic reports a sevenfold profit jump, and BingX adds thousands of US stocks.
Finance Magnates Daily Recap brings you the latest news from forex and CFD brokers, fintech, payments, cryptocurrency, digital assets, trading platforms, financial regulation and global markets.
Get the key company news, executive moves, deals, regulatory updates and market developments of the day, in just a few minutes. New episodes published every weekday.
Read more: https://www.financemagnates.com
#FinanceMagnates #ForexNews #FintechNews
Today’s financial news recap covers Plus500 plans a US trading super-app, Investec partners with IG, Trade Republic reports a sevenfold profit jump, and BingX adds thousands of US stocks.
Finance Magnates Daily Recap brings you the latest news from forex and CFD brokers, fintech, payments, cryptocurrency, digital assets, trading platforms, financial regulation and global markets.
Get the key company news, executive moves, deals, regulatory updates and market developments of the day, in just a few minutes. New episodes published every weekday.
Read more: https://www.financemagnates.com
#FinanceMagnates #ForexNews #FintechNews
Today’s financial news recap covers Plus500 plans a US trading super-app, Investec partners with IG, Trade Republic reports a sevenfold profit jump, and BingX adds thousands of US stocks.
Finance Magnates Daily Recap brings you the latest news from forex and CFD brokers, fintech, payments, cryptocurrency, digital assets, trading platforms, financial regulation and global markets.
Get the key company news, executive moves, deals, regulatory updates and market developments of the day, in just a few minutes. New episodes published every weekday.
Read more: https://www.financemagnates.com
#FinanceMagnates #ForexNews #FintechNews
Today’s financial news recap covers Plus500 plans a US trading super-app, Investec partners with IG, Trade Republic reports a sevenfold profit jump, and BingX adds thousands of US stocks.
Finance Magnates Daily Recap brings you the latest news from forex and CFD brokers, fintech, payments, cryptocurrency, digital assets, trading platforms, financial regulation and global markets.
Get the key company news, executive moves, deals, regulatory updates and market developments of the day, in just a few minutes. New episodes published every weekday.
Read more: https://www.financemagnates.com
#FinanceMagnates #ForexNews #FintechNews
FXCM UK Holds $110m in Client Money; IG CEO Questions Prediction Market Volumes
FXCM UK Holds $110m in Client Money; IG CEO Questions Prediction Market Volumes
FXCM UK Holds $110m in Client Money; IG CEO Questions Prediction Market Volumes
FXCM UK Holds $110m in Client Money; IG CEO Questions Prediction Market Volumes
FXCM UK Holds $110m in Client Money; IG CEO Questions Prediction Market Volumes
FXCM UK Holds $110m in Client Money; IG CEO Questions Prediction Market Volumes
Today’s financial news recap covers FXCM's UK arm holds $110 million in client money ahead of its sale to Trade Nation, Citadel Securities' UK profit falls 38 per cent, and Kraken secures its final Dubai crypto licence.
Finance Magnates Daily Recap brings you the latest news from forex and CFD brokers, fintech, payments, cryptocurrency, digital assets, trading platforms, financial regulation and global markets.
Get the key company news, executive moves, deals, regulatory updates and market developments of the day, in just a few minutes. New episodes published every weekday.
Read more: https://www.financemagnates.com
#FinanceMagnates #ForexNews #FintechNews
Today’s financial news recap covers FXCM's UK arm holds $110 million in client money ahead of its sale to Trade Nation, Citadel Securities' UK profit falls 38 per cent, and Kraken secures its final Dubai crypto licence.
Finance Magnates Daily Recap brings you the latest news from forex and CFD brokers, fintech, payments, cryptocurrency, digital assets, trading platforms, financial regulation and global markets.
Get the key company news, executive moves, deals, regulatory updates and market developments of the day, in just a few minutes. New episodes published every weekday.
Read more: https://www.financemagnates.com
#FinanceMagnates #ForexNews #FintechNews
Today’s financial news recap covers FXCM's UK arm holds $110 million in client money ahead of its sale to Trade Nation, Citadel Securities' UK profit falls 38 per cent, and Kraken secures its final Dubai crypto licence.
Finance Magnates Daily Recap brings you the latest news from forex and CFD brokers, fintech, payments, cryptocurrency, digital assets, trading platforms, financial regulation and global markets.
Get the key company news, executive moves, deals, regulatory updates and market developments of the day, in just a few minutes. New episodes published every weekday.
Read more: https://www.financemagnates.com
#FinanceMagnates #ForexNews #FintechNews
Today’s financial news recap covers FXCM's UK arm holds $110 million in client money ahead of its sale to Trade Nation, Citadel Securities' UK profit falls 38 per cent, and Kraken secures its final Dubai crypto licence.
Finance Magnates Daily Recap brings you the latest news from forex and CFD brokers, fintech, payments, cryptocurrency, digital assets, trading platforms, financial regulation and global markets.
Get the key company news, executive moves, deals, regulatory updates and market developments of the day, in just a few minutes. New episodes published every weekday.
Read more: https://www.financemagnates.com
#FinanceMagnates #ForexNews #FintechNews
Today’s financial news recap covers FXCM's UK arm holds $110 million in client money ahead of its sale to Trade Nation, Citadel Securities' UK profit falls 38 per cent, and Kraken secures its final Dubai crypto licence.
Finance Magnates Daily Recap brings you the latest news from forex and CFD brokers, fintech, payments, cryptocurrency, digital assets, trading platforms, financial regulation and global markets.
Get the key company news, executive moves, deals, regulatory updates and market developments of the day, in just a few minutes. New episodes published every weekday.
Read more: https://www.financemagnates.com
#FinanceMagnates #ForexNews #FintechNews
Today’s financial news recap covers FXCM's UK arm holds $110 million in client money ahead of its sale to Trade Nation, Citadel Securities' UK profit falls 38 per cent, and Kraken secures its final Dubai crypto licence.
Finance Magnates Daily Recap brings you the latest news from forex and CFD brokers, fintech, payments, cryptocurrency, digital assets, trading platforms, financial regulation and global markets.
Get the key company news, executive moves, deals, regulatory updates and market developments of the day, in just a few minutes. New episodes published every weekday.
Read more: https://www.financemagnates.com
#FinanceMagnates #ForexNews #FintechNews