

Bitcoin (BTC) price traded at $76,984 on Wednesday, May 20, 2026, after closing five consecutive down sessions and cracking the $80,500 daily-close trigger I flagged on FinanceMagnates.com last week.
The cryptocurrency has fallen 5.3% over the five-session run from the May 12 close near $81,290, with the May 19 daily low at $76,565 marking the weakest level since early March.
The volatility cage I described on May 13, a 2% range between $80,500 support and the 200 EMA at $82,000, has resolved to the downside. My 50 EMA at $76,000 is now the only technical line between BTC and a return to year-to-date lows.
Follow me on X for real-time market analysis: @ChmielDk
The Cage Resolved Down: Why Bitcoin Cracked $80,500?
The breakdown is not a single-catalyst event. Futures expiry triggered approximately $256 million in long liquidations on Friday, but the timing was coincidental rather than causal. Pressure on 30-year Treasury yields, a deteriorating macro outlook, and escalating Middle East tensions did the heavier work.
- Bitcoin Price Prediction: Why BTC Price Is Rallying and Forecasts for 2025-2030
- How High Can Bitcoin Go? Experts' BTC Price Predictions Eye $125K in June and $150–200K by Year-End 2025
- Bitcoin Price Hits Two-Month High, Ethereum, Dogecoin, XRP, and Other Cryptos Skyrocket
"We could see further downside through the middle of the week," said Paul Howard, Senior Director at Wincent. Howard's note was filed when the $79,000 support level had already cracked, and BTC has now extended that decline by another $2,500 through Wednesday's open. He framed the move as macro-driven rather than crypto-specific.
The macro stack lining up against Bitcoin this week includes:
- 30-year Treasury yields under sustained pressure across global bond markets
- Middle East tensions raising risk premia on tech and crypto-correlated assets
- $1.8 billion in spot Bitcoin ETF outflows over the past five trading days
- Ether ETFs in a six-session outflow streak
- BlackRock's IBIT losing $448.36 million on May 18, the third-largest 2026 daily outflow
- Total spot BTC ETF AUM falling below $100.5 billion
This is the third major down sequence of 2026 after January's tariff shock and February's $63,000 capitulation. Each previous run found a buyer in the $60,000 to $66,000 band. The question now is whether the 50 EMA at $76,000 holds buyers at this higher level or capitulation extends back to the lows.
The pattern from prior 2026 declines suggests neither side gets a clean resolution without a fresh macro catalyst.
Where $1.07 Billion Quit Crypto: The Flow Picture Beneath the Selloff
The headline outflow number from CoinShares matters less than what sits underneath it. Crypto ETP outflows hit $1.07 billion last week, the third-largest weekly redemption of 2026 and the first negative week in seven. The geographic distribution flips the read entirely.
"Strip the US out and the picture flips," said Can-Luca Köymen, Investment Strategist at Sygnum Bank. Köymen pointed to Switzerland, Germany, the Netherlands and Canada all recording net inflows, with XRP taking in $67.6 million globally and Solana $55.1 million. Eleven individual digital assets attracted meaningful inflows over the same week.
The onchain capital picture is thinner than the headline outflow implies. Bitfinex analysts wrote in their latest market report that monthly net Bitcoin inflows now sit at roughly $2.8 billion, well below the $10 billion pace historically associated with durable breakout conditions.
They argued the recovery now "hinges almost entirely on whether fresh net capital continues entering" the market.
The structural read explains why my technical bias has not flipped despite multiple bullish catalysts, including the FinanceMagnates.com CLARITY Act explainer covering the bill's advance through the Senate Banking Committee on May 14.
Bitcoin Technical Analysis: The 50 EMA at $76,000 Is the Last Defense
In 15-plus years analyzing crypto and CFD markets, I have watched the $80,000 to $82,000 band define every multi-month Bitcoin consolidation since the 2022 bear. The trigger I published in my May 13 volatility cage analysis has now activated. The next defense layer is the 50 EMA, marked in red on my chart at approximately $76,000. More of my work sits on my analyst page.
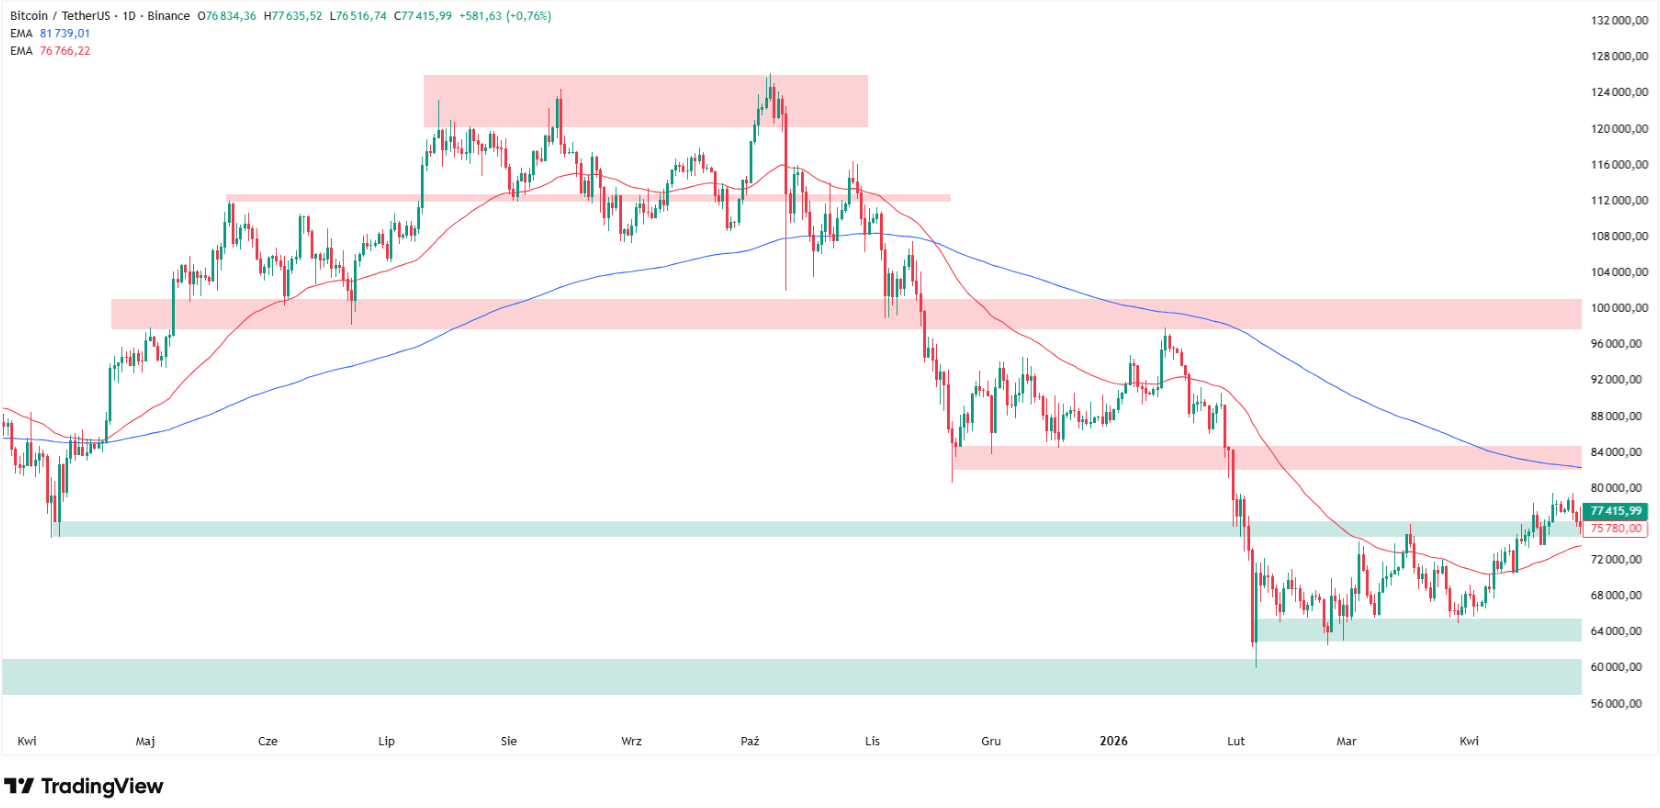
The 50 EMA is not just a moving average at this location. It coincides with the horizontal level set by the March 17 highs near $76,000, and the last two sessions have drawn long lower wicks rejecting the move down. Buyers are present at this band; the question is whether they hold it on a daily close.
The 200 EMA, the blue line on my chart, now caps the upside at $82,000. The cage that defined trading from May 6 to May 18 has resolved, but the architecture above remains unchanged. As my May 6 analysis on FinanceMagnates.com first established, reclaiming the trend requires a daily close back above the 200 EMA, not just a wick.
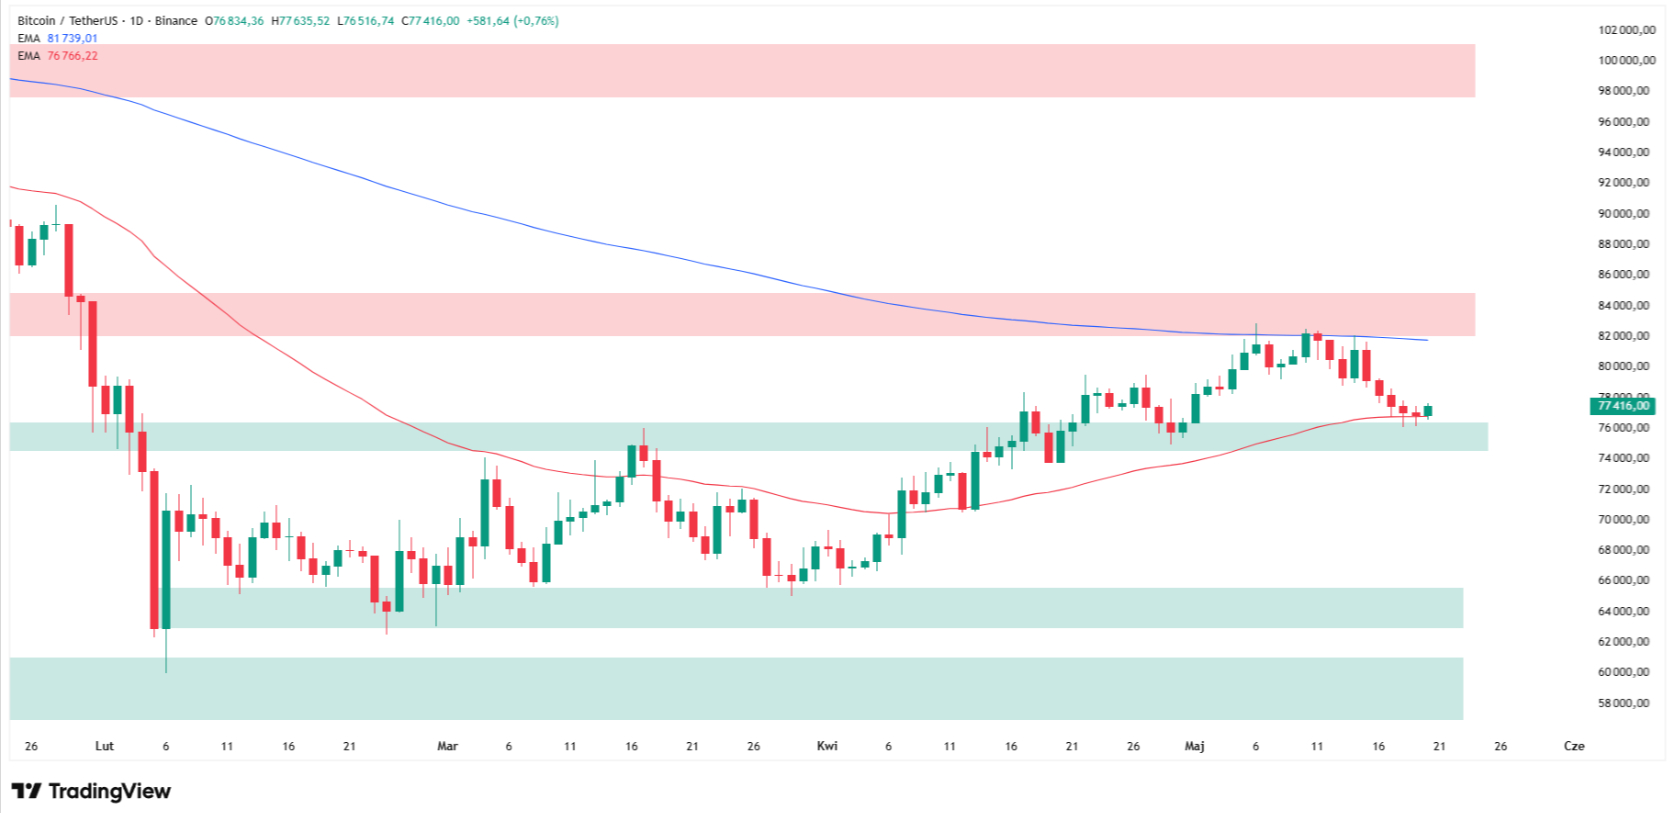
If the 50 EMA breaks on a daily close, the structural target moves to $74,000, the April 2025 lows. Below that, year-to-date lows in the $63,000 to $66,000 band come back into play. The ultimate bear scenario sits at $57,000 to $60,000, the October 2024 levels. As my March 24 crash analysis warned, that lower band was where the bull-market framework was last defended.
Bitcoin key levels
Level | Type | Notes |
$76,000 | 50 EMA / horizontal support | Coincides with March 17 highs; currently being tested |
$80,500 | Broken trigger | May 13 confirmation line; now resistance |
$82,000 | 200 EMA | Cage ceiling; reclaim required for trend flip |
$85,000 | Resistance zone | December 2025 lows |
$74,000 | Extended support | April 2025 lows beneath the 50 EMA |
$63K-$66K | Year-to-date lows | First major bear target if 50 EMA breaks |
$57K-$60K | October 2024 levels | Ultimate bearish scenario |
Bitcoin Price Predictions: From $50K Bear Case to $250K Bull Target
The institutional forecast range for 2026 spans $50,000 to $250,000, but every bullish target now depends on the same prerequisite: a daily close back above the 200 EMA at $82,000. None of these prints activate without that confirmation, which is the framework the FinanceMagnates.com $240K target report laid out in April.
The wide range of forecasts itself signals how little consensus exists on whether 2026 finishes higher or lower than where it began.
Source | Target | My one-sentence view |
Standard Chartered | $150K YE 2026 | Path-dependent on reclaiming both EMAs; the cage break delays this thesis. |
Bernstein | $150K YE 2026 | Same path dependency; their structural cycle case still requires $82K reclaim first. |
JPMorgan (Panigirtzoglou) | $170K fair value | Model-implied, not a base case; ignores the active technical break. |
Tom Lee (Fundstrat) | $200K-$250K YE 2026 | Outside my realistic range absent a Fed pivot or major regulatory catalyst. |
Peter Brandt | $300K-$500K by 2029 | Long-horizon scenario; not active on this timeframe per his own framing. |
Carol Alexander | $75K-$150K range | The bottom of her range is being tested now; her floor and my floor converge. |
Bitfinex Analysts | Recovery flow-dependent | Aligns with my bias; without fresh capital entering, $63K is in play. |
The CLARITY Act passing the Senate Banking Committee on May 14 has not arrested the slide, which tells me regulatory headlines are no longer the marginal price setter. The Peter Brandt $300,000-to-$500,000 long-horizon scenario, covered in the FinanceMagnates.com Brandt prediction report, remains a 2029 thesis on a four-year cycle framework.
Until the 200 EMA flips back to support, my base case remains continued sideways-to-down action bounded by $74,000 and $82,000.
Bitcoin Price Prediction FAQ
Why is Bitcoin falling today?
Bitcoin is down 5.3% over five consecutive sessions, with the May 19 close at $76,565 marking the weakest level since early March. The drivers are macro, not crypto-specific: 30-year Treasury yields under pressure, Middle East tensions raising risk premia, and $1.8 billion in spot Bitcoin ETF outflows over five trading days. The breakdown confirmed a technical trigger I published on May 13.
What does the $80,500 break mean for Bitcoin price?
The $80,500 daily-close trigger was the line I identified on May 13 as the confirmation of bearish resolution. A close below it ended the 2% volatility cage that had defined trading since early May. The technical bias is now confirmed bearish until BTC closes back above the 200 EMA at $82,000. The path of least resistance tilts down toward the 50 EMA at $76,000.
How low can Bitcoin go from here?
The first defense is the 50 EMA at $76,000, the level currently being tested. A daily close below opens the path to $74,000 (April 2025 lows). Beneath that, the year-to-date low band at $63,000 to $66,000 comes into play. The ultimate bearish target sits at $57,000 to $60,000, the October 2024 levels, which would mark the deepest bear sequel since the April 2024 halving cycle began.
What would invalidate the bearish Bitcoin scenario?
A daily close back above the 200 EMA at $82,000 would flip the technical bias and reopen the corridor to the November-December 2025 lows at $85,000. From there, the next resistance ladder sits at $90,000, then $97,000 to $100,000 (the January 2026 peaks), then the $112,000 to $126,000 all-time-high zone. Until that 200 EMA reclaim, every rally is a counter-trend move.
Are institutional investors still buying Bitcoin?
The picture is split by geography. CoinShares data shows US-listed Bitcoin and Ethereum products drove almost all of last week's $1.07 billion in crypto ETP outflows, the third-largest of 2026. Switzerland, Germany, the Netherlands and Canada all recorded net inflows, and XRP took in $67.6 million globally. Bitfinex analysts note monthly net BTC inflows at $2.8 billion versus the $10 billion historical breakout pace.
This analysis was prepared by Damian Chmiel, drawing on personal chart work, primary source data, and institutional research. Prices verified against TradingView at time of publication.


