Silver hit $87 intraday Tuesday after a 7.3% Monday surge, the biggest one-day gain since February 20 and a five-session +18% run.
XAG/USD chart shows silver breaking out of the $66-$80 consolidation with an inverted head-and-shoulders pattern now active toward $120.
Citigroup targets $110 for H2 2026 and TD Securities sees $118 as the year high, while BofA's Widmer keeps a $135-$309 bull case.
How high can silver price go? Check XAG/USD technical analysis and silver price prediction
Silver
traded at $84 per ounce on Tuesday, May 12, 2026, pulling back 2% after testing
$87 intraday following Monday's 7.3% one-day surge, the metal's largest
single-session gain since February 20. Monday's close at $85.485 per ounce on
COMEX marked the highest settlement since March 10, capping five consecutive
winning sessions that lifted XAG/USD more than 18% from early-May lows. The
metal is now sitting at its first two-month high, with hedge fund demand, a
softer dollar, and a shift away from Indian gold buying as the immediate
catalysts.
Follow
me on X for real-time silver and metals analysis: @ChmielDk
Why Silver Is Rising Today?
Five Sessions, +18%, $87 Intraday
Three
independent forces converged on silver this week. Monday's break above the
early-April highs near $80 attracted systematic flows that had been waiting on
the sidelines through six weeks of consolidation. John Caruso of RJO Futures
framed the move as a rotation into growth metals from fear metals, writing in a
Monday client note that "silver has a foot in both camps."
The hedge
fund bid is the second leg. Ryan McKay, senior commodity strategist at TD
Securities, attributed the rally to "rising interest from hedge funds and
other leveraged investors" that had been sidelined through the
consolidation, with trend followers piling in once the $80 ceiling cracked.
Silver's
six-week range between $70 and $80 had pushed positioning to multi-month lows
by late April, leaving room for a one-way move once technical buyers
re-engaged.
The third
leg is geopolitical. President Donald Trump rejected Iran's latest peace
proposal as "a piece of garbage" on Monday, killing the prospect of a
near-term Strait of Hormuz reopening and keeping Brent above $115 per barrel.
Indian
Prime Minister Narendra Modi separately asked citizens to pause gold purchases
for a year to defend the rupee, a move that could redirect retail flow toward
silver in one of the world's largest precious metals consumer markets.
The drivers
behind Monday's $87 print stacked like this:
Technical breakout above the early-April $80
ceiling triggered systematic buying
Hedge fund re-entry after six weeks of cleared
positioning, per TD Securities
Iran peace talks collapsing following Trump's rejection of
Tehran's proposal
Modi's anti-gold appeal rotating Indian retail demand
toward silver
Brent above $115 keeping the inflation-hedge
bid intact
Silver Technical Analysis:
Inverted Head and Shoulders Activates
In more
than 15 years charting precious metals as a senior analyst at
FinanceMagnates.com, the cleanest silver setups I have seen come after
multi-week consolidations resolve in the direction of the prior trend, and
Monday's session looks like one of them.
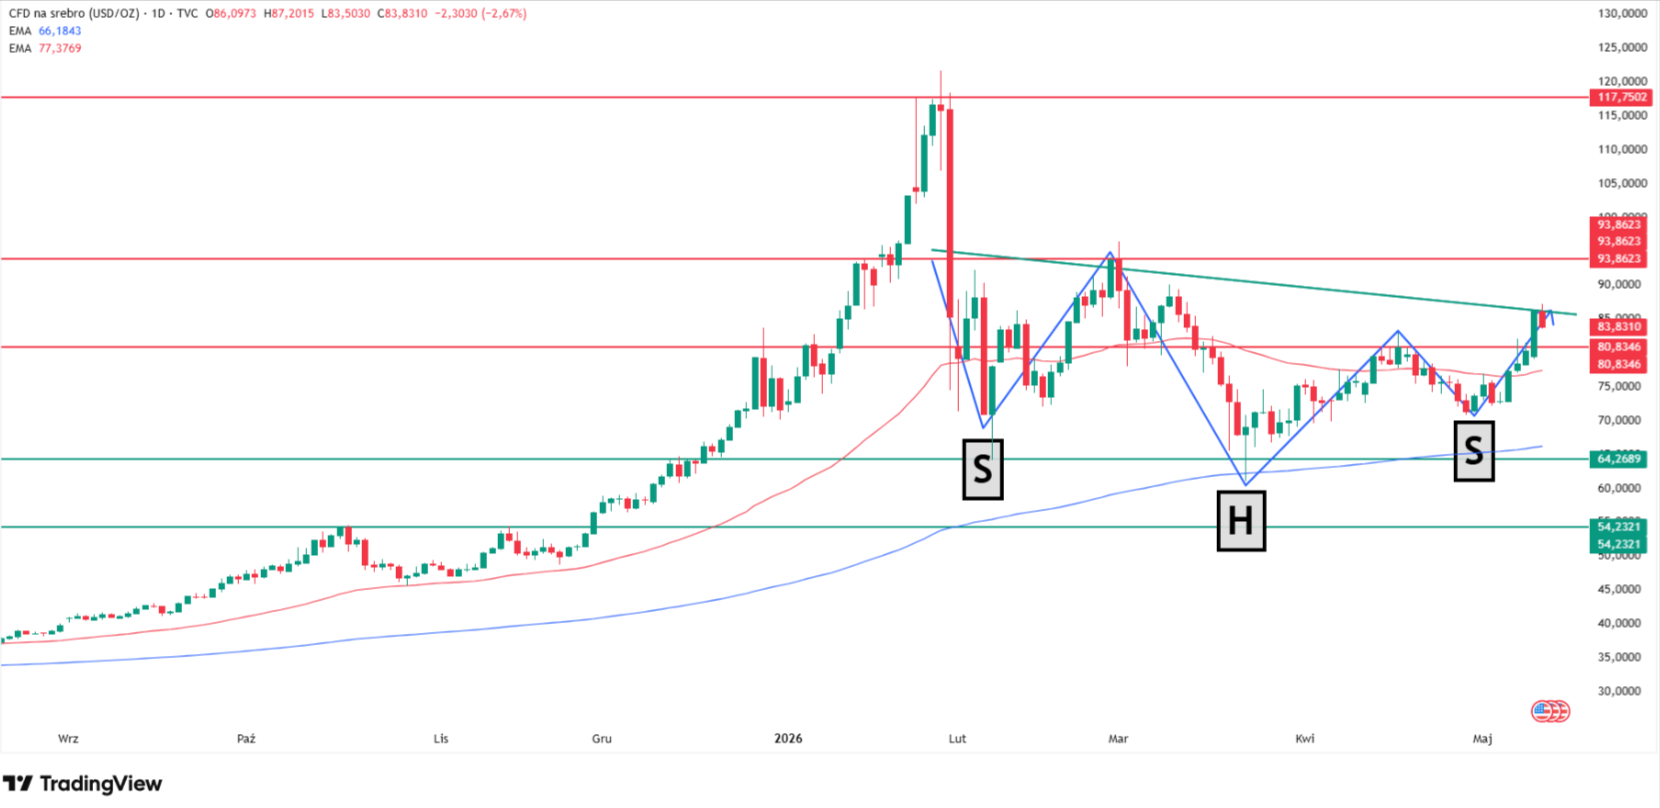
My chart
shows silver breaking out of the consolidation zone that had bracketed price
action since the March crash, with the lower boundary anchored at $64-$66 on
the 200-day exponential moving average and the upper boundary defined by the 50
EMA near $77 plus the early-April highs just above $80.
The
breakout confirms the path of least resistance is now appreciation, not a
retest of the $54 October 2025 historical highs that would have served as the
next major support below the range. The first measured target for bulls is the
end-February peak just shy of $94 per ounce, which capped every relief rally
during the March-April correction.
The setup
is reinforced by a slightly skewed inverted head-and-shoulders pattern drawn on
the corrective phase since February. The left shoulder formed in early
February, the head printed at the mid-March $72 crash low, and the right
shoulder is developing right now in early May.
The
neckline I have drawn in green runs across the February and April highs near
$80-$82, and Monday's session delivered the first sustained close above it in
the cycle. The pattern projects a measured move back toward the prior all-time
high.
The technical analysis of silver chart. Source: Tradingview.com
DM BOŚ
analyst Marek Rogalski called silver "turbo-gold" in my April 8 analysis, and the label fit Monday's tape.
Silver's 7.3% gain against gold's flat session marked one of the widest
positive divergences of 2026 and pushed the gold-silver ratio below 56 from a
March peak above 65.
Key
levels on my XAG/USD chart:
Level
Type
Notes
$54
Major historical support
October 2025 highs, structural floor
$64-$66
200 EMA / former range floor
Tested March 23, defended
$77-$80
50 EMA / former range ceiling
Broken
Monday, flips to support
$87
Intraday high May 12
Local
resistance, profit-taking zone
$94
First upside target
February
peaks, capped March-April rallies
$117-$120
Final upside target
January 26-30 ATH zone
$121.64
All-time high
January 29, 2026
Silver Price Predictions
2026: From $79.50 to $309
The
institutional forecast range for silver in 2026 is the widest of any major
liquid asset, and every name on the table has been forced to revise at least
once since January. The Reuters analyst poll consensus sits at $79.50 per ounce
as the 2026 average, a level silver has now traded above for most of the year.
As my April COMEX deep-dive detailed, the same poll projected
just $50 in October 2025, showing how fast this market has repriced.
JPMorgan
and UBS anchor the conservative end at $81 average and $85 year-end
respectively. Both forecasts now look stale against current price action, with
my $94 first target already exceeding JPMorgan's Q4 high. Commerzbank's $90
year-end call is closer to where the metal is trading, but still treats $90 as
a destination rather than a station on the way higher.
The
mid-range bullish camp is led by Citigroup at $110 for the second half of 2026
and TD Securities at a $118 year-high. Citi's call, first detailed in my January coverage when the bank labeled silver
"gold on steroids," lines up with my upper scenario if the COMEX
physical squeeze persists. TD's $118 is the closest institutional number to my
ATH retest call.
Bank of
America's Michael Widmer maintains the extreme bull case at $135-$309, anchored
on gold-silver ratio compression toward the 1980 Hunt Brothers 14:1 extreme. As
my late-April analysis noted, that target requires a ratio
collapse my chart does not yet support. Macro strategist David Hunter put a
directional marker on X on Monday: "Silver will likely outperform gold
into the top this year but both will do well.
Source
Target
My one-line view
Reuters poll
$79.50 avg 2026
Already
breached on the upside
JPMorgan
$81 avg / $85 Q4
Below my
first target of $94
UBS
$85 EOY 2026
Treats
current price as destination
Commerzbank
$90 EOY 2026
Achievable
but well below ATH
Citigroup
$110 H2 2026
Aligns
with my upper scenario
TD Securities
$118 2026 high
Closest
to my ATH retest call
BofA (Widmer)
$135-$309
Requires
ratio compression I don't yet see
David Hunter
"Outperform gold to top"
Directional agreement, no price
Silver Price FAQ
Why is silver rising
today?
Silver is
rising because three drivers converged on Monday May 11: a technical breakout
above the $80 consolidation ceiling that triggered systematic buying, hedge
fund re-entry flagged by TD Securities, and Trump's rejection of Iran's peace
proposal that reignited the safe-haven bid. The 7.3% Monday surge was the
biggest one-day move since February 20. Tuesday saw $87 tested intraday before
a 2% profit-taking pullback to $84.
Can silver reach $120 per
ounce in 2026?
Yes, and my
chart projects it as the measured move from the active inverted
head-and-shoulders pattern. The path requires a clean break and retest of $94
as new support first. TD Securities targets $118 as the 2026 high, Citigroup
sees $110 by H2, and Bank of America's Michael Widmer maintains the extreme
$135-$309 bull case if the gold-silver ratio compresses toward historical
extremes.
What does the inverted
head and shoulders mean for silver?
The pattern
formed across the February-May corrective phase: left shoulder in early
February, head at the mid-March $72 crash low, right shoulder in early May.
Monday's session delivered the first sustained neckline break of the cycle. If
confirmed by a retest, the pattern's measured move projects silver back toward
the $117-$120 January all-time high zone.
Silver
traded at $84 per ounce on Tuesday, May 12, 2026, pulling back 2% after testing
$87 intraday following Monday's 7.3% one-day surge, the metal's largest
single-session gain since February 20. Monday's close at $85.485 per ounce on
COMEX marked the highest settlement since March 10, capping five consecutive
winning sessions that lifted XAG/USD more than 18% from early-May lows. The
metal is now sitting at its first two-month high, with hedge fund demand, a
softer dollar, and a shift away from Indian gold buying as the immediate
catalysts.
Follow
me on X for real-time silver and metals analysis: @ChmielDk
Why Silver Is Rising Today?
Five Sessions, +18%, $87 Intraday
Three
independent forces converged on silver this week. Monday's break above the
early-April highs near $80 attracted systematic flows that had been waiting on
the sidelines through six weeks of consolidation. John Caruso of RJO Futures
framed the move as a rotation into growth metals from fear metals, writing in a
Monday client note that "silver has a foot in both camps."
The hedge
fund bid is the second leg. Ryan McKay, senior commodity strategist at TD
Securities, attributed the rally to "rising interest from hedge funds and
other leveraged investors" that had been sidelined through the
consolidation, with trend followers piling in once the $80 ceiling cracked.
Silver's
six-week range between $70 and $80 had pushed positioning to multi-month lows
by late April, leaving room for a one-way move once technical buyers
re-engaged.
The third
leg is geopolitical. President Donald Trump rejected Iran's latest peace
proposal as "a piece of garbage" on Monday, killing the prospect of a
near-term Strait of Hormuz reopening and keeping Brent above $115 per barrel.
Indian
Prime Minister Narendra Modi separately asked citizens to pause gold purchases
for a year to defend the rupee, a move that could redirect retail flow toward
silver in one of the world's largest precious metals consumer markets.
The drivers
behind Monday's $87 print stacked like this:
Technical breakout above the early-April $80
ceiling triggered systematic buying
Hedge fund re-entry after six weeks of cleared
positioning, per TD Securities
Iran peace talks collapsing following Trump's rejection of
Tehran's proposal
Modi's anti-gold appeal rotating Indian retail demand
toward silver
Brent above $115 keeping the inflation-hedge
bid intact
Silver Technical Analysis:
Inverted Head and Shoulders Activates
In more
than 15 years charting precious metals as a senior analyst at
FinanceMagnates.com, the cleanest silver setups I have seen come after
multi-week consolidations resolve in the direction of the prior trend, and
Monday's session looks like one of them.
My chart
shows silver breaking out of the consolidation zone that had bracketed price
action since the March crash, with the lower boundary anchored at $64-$66 on
the 200-day exponential moving average and the upper boundary defined by the 50
EMA near $77 plus the early-April highs just above $80.
The
breakout confirms the path of least resistance is now appreciation, not a
retest of the $54 October 2025 historical highs that would have served as the
next major support below the range. The first measured target for bulls is the
end-February peak just shy of $94 per ounce, which capped every relief rally
during the March-April correction.
The setup
is reinforced by a slightly skewed inverted head-and-shoulders pattern drawn on
the corrective phase since February. The left shoulder formed in early
February, the head printed at the mid-March $72 crash low, and the right
shoulder is developing right now in early May.
The
neckline I have drawn in green runs across the February and April highs near
$80-$82, and Monday's session delivered the first sustained close above it in
the cycle. The pattern projects a measured move back toward the prior all-time
high.
The technical analysis of silver chart. Source: Tradingview.com
DM BOŚ
analyst Marek Rogalski called silver "turbo-gold" in my April 8 analysis, and the label fit Monday's tape.
Silver's 7.3% gain against gold's flat session marked one of the widest
positive divergences of 2026 and pushed the gold-silver ratio below 56 from a
March peak above 65.
Key
levels on my XAG/USD chart:
Level
Type
Notes
$54
Major historical support
October 2025 highs, structural floor
$64-$66
200 EMA / former range floor
Tested March 23, defended
$77-$80
50 EMA / former range ceiling
Broken
Monday, flips to support
$87
Intraday high May 12
Local
resistance, profit-taking zone
$94
First upside target
February
peaks, capped March-April rallies
$117-$120
Final upside target
January 26-30 ATH zone
$121.64
All-time high
January 29, 2026
Silver Price Predictions
2026: From $79.50 to $309
The
institutional forecast range for silver in 2026 is the widest of any major
liquid asset, and every name on the table has been forced to revise at least
once since January. The Reuters analyst poll consensus sits at $79.50 per ounce
as the 2026 average, a level silver has now traded above for most of the year.
As my April COMEX deep-dive detailed, the same poll projected
just $50 in October 2025, showing how fast this market has repriced.
JPMorgan
and UBS anchor the conservative end at $81 average and $85 year-end
respectively. Both forecasts now look stale against current price action, with
my $94 first target already exceeding JPMorgan's Q4 high. Commerzbank's $90
year-end call is closer to where the metal is trading, but still treats $90 as
a destination rather than a station on the way higher.
The
mid-range bullish camp is led by Citigroup at $110 for the second half of 2026
and TD Securities at a $118 year-high. Citi's call, first detailed in my January coverage when the bank labeled silver
"gold on steroids," lines up with my upper scenario if the COMEX
physical squeeze persists. TD's $118 is the closest institutional number to my
ATH retest call.
Bank of
America's Michael Widmer maintains the extreme bull case at $135-$309, anchored
on gold-silver ratio compression toward the 1980 Hunt Brothers 14:1 extreme. As
my late-April analysis noted, that target requires a ratio
collapse my chart does not yet support. Macro strategist David Hunter put a
directional marker on X on Monday: "Silver will likely outperform gold
into the top this year but both will do well.
Source
Target
My one-line view
Reuters poll
$79.50 avg 2026
Already
breached on the upside
JPMorgan
$81 avg / $85 Q4
Below my
first target of $94
UBS
$85 EOY 2026
Treats
current price as destination
Commerzbank
$90 EOY 2026
Achievable
but well below ATH
Citigroup
$110 H2 2026
Aligns
with my upper scenario
TD Securities
$118 2026 high
Closest
to my ATH retest call
BofA (Widmer)
$135-$309
Requires
ratio compression I don't yet see
David Hunter
"Outperform gold to top"
Directional agreement, no price
Silver Price FAQ
Why is silver rising
today?
Silver is
rising because three drivers converged on Monday May 11: a technical breakout
above the $80 consolidation ceiling that triggered systematic buying, hedge
fund re-entry flagged by TD Securities, and Trump's rejection of Iran's peace
proposal that reignited the safe-haven bid. The 7.3% Monday surge was the
biggest one-day move since February 20. Tuesday saw $87 tested intraday before
a 2% profit-taking pullback to $84.
Can silver reach $120 per
ounce in 2026?
Yes, and my
chart projects it as the measured move from the active inverted
head-and-shoulders pattern. The path requires a clean break and retest of $94
as new support first. TD Securities targets $118 as the 2026 high, Citigroup
sees $110 by H2, and Bank of America's Michael Widmer maintains the extreme
$135-$309 bull case if the gold-silver ratio compresses toward historical
extremes.
What does the inverted
head and shoulders mean for silver?
The pattern
formed across the February-May corrective phase: left shoulder in early
February, head at the mid-March $72 crash low, right shoulder in early May.
Monday's session delivered the first sustained neckline break of the cycle. If
confirmed by a retest, the pattern's measured move projects silver back toward
the $117-$120 January all-time high zone.
Damian Chmiel is a Senior Analyst & Editor at Finance Magnates with more than 15 years of experience in the CFD and online trading industry. Active as both a trader and journalist since 2010, he focuses on broker coverage, fintech innovation, and regulatory developments across Europe, the Middle East, and Asia.
His work includes interviews with C-level leaders at major brokerages and fintech platforms, as well as co-authoring Finance Magnates’ quarterly industry benchmarking reports. Damian’s reporting is data-driven, market-aware, and grounded in direct industry engagement. His analysis and commentary have also been cited by external media outlets, including Investing.com, Binance, The Asset, Stockhead, and Dispatch.
Education:
MA in Finance and Accounting, Cracow University of Economics
How Low Can Silver Price Go? The New XAG/USD Analysis Suggests -50% Bearish Targer
Featured Videos
Base Markets CEO: Why Trust Matters More Than Bonuses | Alex Kolpokchi Interview
Base Markets CEO: Why Trust Matters More Than Bonuses | Alex Kolpokchi Interview
Base Markets CEO: Why Trust Matters More Than Bonuses | Alex Kolpokchi Interview
Base Markets CEO: Why Trust Matters More Than Bonuses | Alex Kolpokchi Interview
Is it still possible to build a successful brokerage by putting clients first instead of relying on flashy promotions?
In this exclusive Finance Magnates Executive Interview, Yam Yehoshua, Chief Editor at Finance Magnates, sits down with Alex Kolpokchi, Co-Founder & CEO of Base Markets, to discuss the company's vision, the lessons learned from leading brokers, and why trust, transparency and real client value are at the centre of its strategy.
During the interview, Alex shares:
- How his experience at IG and Pepperstone shaped Base Markets
- Why the company describes itself as a "no-nonsense broker"
- The importance of trust, execution and client service
- How real client feedback helped build the platform
- Why Base Markets avoided a traditional public launch
- The company's long-term plans for regulation and growth
What makes Base Markets different in today's competitive brokerage industry
💬 What do you think matters most when choosing a broker—pricing, execution, regulation or customer service? Let us know in the comments.
#BaseMarkets #Forex #CFDTrading #OnlineTrading #Brokerage #Trading #FinanceMagnates #Fintech #CEOInterview #TradingIndustry
Today's Wednesday, the 15th of July 2026, and these are our main stories: CMC Markets expands 24/5 US trading to more than 5,000 shares and ETFs, Tickmill UK partners with Interactive Brokers, and Revolut moves closer to launching crypto services in the UAE.
Today's Wednesday, the 15th of July 2026, and these are our main stories: CMC Markets expands 24/5 US trading to more than 5,000 shares and ETFs, Tickmill UK partners with Interactive Brokers, and Revolut moves closer to launching crypto services in the UAE.
Today's Wednesday, the 15th of July 2026, and these are our main stories: CMC Markets expands 24/5 US trading to more than 5,000 shares and ETFs, Tickmill UK partners with Interactive Brokers, and Revolut moves closer to launching crypto services in the UAE.
Today's Wednesday, the 15th of July 2026, and these are our main stories: CMC Markets expands 24/5 US trading to more than 5,000 shares and ETFs, Tickmill UK partners with Interactive Brokers, and Revolut moves closer to launching crypto services in the UAE.
Today's Wednesday, the 15th of July 2026, and these are our main stories: CMC Markets expands 24/5 US trading to more than 5,000 shares and ETFs, Tickmill UK partners with Interactive Brokers, and Revolut moves closer to launching crypto services in the UAE.
Today's Wednesday, the 15th of July 2026, and these are our main stories: CMC Markets expands 24/5 US trading to more than 5,000 shares and ETFs, Tickmill UK partners with Interactive Brokers, and Revolut moves closer to launching crypto services in the UAE.
FM Daily Brief – 14 July 2026
FM Daily Brief – 14 July 2026
FM Daily Brief – 14 July 2026
FM Daily Brief – 14 July 2026
FM Daily Brief – 14 July 2026
FM Daily Brief – 14 July 2026
Today's Tuesday, the 14th of July 2026, and these are our main stories: NinjaTrader cuts ties with Alpha Futures, Russia opens regulated crypto CFDs, and ActivTrades reshapes its group structure.
Today's Tuesday, the 14th of July 2026, and these are our main stories: NinjaTrader cuts ties with Alpha Futures, Russia opens regulated crypto CFDs, and ActivTrades reshapes its group structure.
Today's Tuesday, the 14th of July 2026, and these are our main stories: NinjaTrader cuts ties with Alpha Futures, Russia opens regulated crypto CFDs, and ActivTrades reshapes its group structure.
Today's Tuesday, the 14th of July 2026, and these are our main stories: NinjaTrader cuts ties with Alpha Futures, Russia opens regulated crypto CFDs, and ActivTrades reshapes its group structure.
Today's Tuesday, the 14th of July 2026, and these are our main stories: NinjaTrader cuts ties with Alpha Futures, Russia opens regulated crypto CFDs, and ActivTrades reshapes its group structure.
Today's Tuesday, the 14th of July 2026, and these are our main stories: NinjaTrader cuts ties with Alpha Futures, Russia opens regulated crypto CFDs, and ActivTrades reshapes its group structure.
What's the one piece of advice that's shaped your success?
We asked finance leaders at iFX EXPO International, and their answers couldn't have been more different.
Scott Chiriaco shares why discipline is everything, while Charles Savva believes success starts with balance.
Which perspective do you agree with?
#FinanceMagnates #iFXEXPO #Leadership #Business #Fintech #Shorts
FM Daily Brief – 13 July 2026
FM Daily Brief – 13 July 2026
FM Daily Brief – 13 July 2026
FM Daily Brief – 13 July 2026
FM Daily Brief – 13 July 2026
FM Daily Brief – 13 July 2026
Today is Monday, the 13th of July 2026, and these are our main stories: Plus500 reports stronger first-half revenue, Asic cuts retail CFD levies in, and Pepperstone expands its perpetual CFD plans.
Today is Monday, the 13th of July 2026, and these are our main stories: Plus500 reports stronger first-half revenue, Asic cuts retail CFD levies in, and Pepperstone expands its perpetual CFD plans.
Today is Monday, the 13th of July 2026, and these are our main stories: Plus500 reports stronger first-half revenue, Asic cuts retail CFD levies in, and Pepperstone expands its perpetual CFD plans.
Today is Monday, the 13th of July 2026, and these are our main stories: Plus500 reports stronger first-half revenue, Asic cuts retail CFD levies in, and Pepperstone expands its perpetual CFD plans.
Today is Monday, the 13th of July 2026, and these are our main stories: Plus500 reports stronger first-half revenue, Asic cuts retail CFD levies in, and Pepperstone expands its perpetual CFD plans.
Today is Monday, the 13th of July 2026, and these are our main stories: Plus500 reports stronger first-half revenue, Asic cuts retail CFD levies in, and Pepperstone expands its perpetual CFD plans.