Silver rebounds 3.2% to $75.46/oz on April 30 after 3 days of declines, pushed back above $73 as US-Iran peace talks stalled.
XAG/USD chart pivots on $70 vs $80: below $70 opens $55 and the 200 EMA at $65; above $80 unlocks $94, then the ATH zone.
Bank of America's Michael Widmer projects silver $135-$309 in 2026 if gold-silver ratio compresses to 32:1 (2011) or 14:1 (1980).
Let's check the current price of silver and the newest silve price forecasts
Silver
traded at $75.46 per ounce on Thursday, April 30, 2026, rebounding 3.21% after
three consecutive sessions of declines that briefly pushed the metal toward the
$70 support floor. The bounce follows the breakdown of US-Iran peace talks
reported earlier in the week, which had compressed the safe-haven premium
silver carried into late April.
With the
Federal Reserve, Bank of England, and ECB all delivering decisions this week,
my silver price prediction turns on whether today's move is a reflex rebound or
the start of a fresh leg toward the $80 resistance shelf.
Follow
me on X for real-time silver and metals analysis: @ChmielDk.
With the
Fed decision already in the rearview as a cautious hold, attention turns to the
ECB and BoE later this week, then US PCE for the inflation read that decides
whether the rate path stays restrictive into Q3.
Why Silver Is Surging
Today? Peace Stalls, Yields Hold
That mix of
geopolitical stress and sticky inflation is what Rania Gule, Senior Market
Analyst at XS.com (MENA), calls a fundamental shift in how silver is being
priced.
The
setup heading into the rest of the week has three moving parts:
Peace talks status: Tehran's proposal rejected, US
counteroffers expected
Central bank pause: Fed, BoE, ECB all expected to
hold but skew hawkish
Oil channel: Brent above $115/barrel
sustains the inflation pressure that capped silver in March
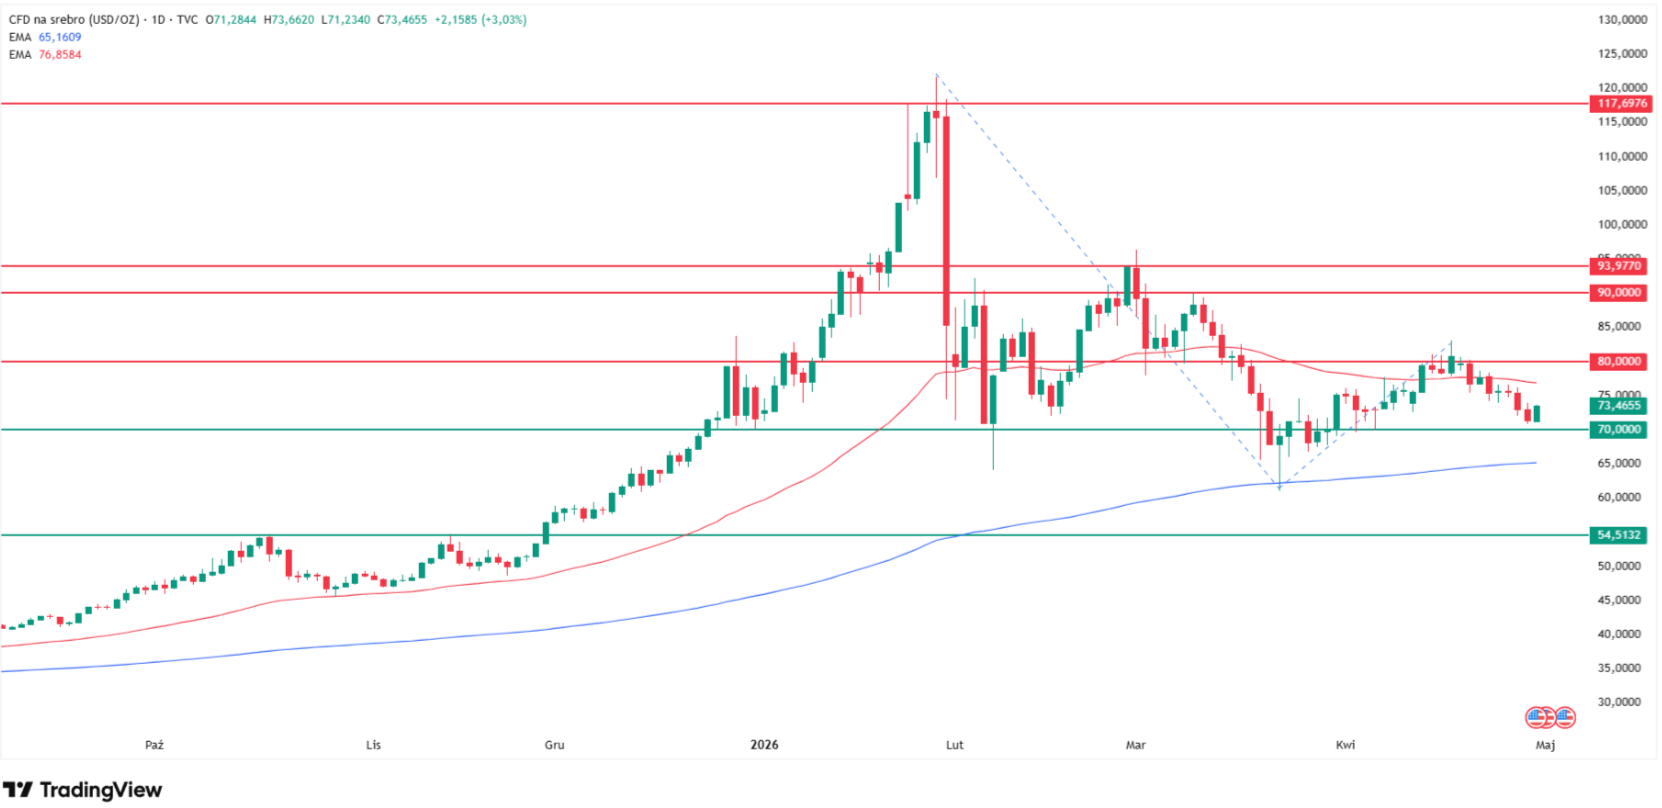
Silver Price Prediction: XAG/USD
Chart Hinges on $70 vs $80
From a
technical standpoint, today's rebound changes very little on the broader chart.
The $70 zone, reinforced by the 200 EMA roughly $5 lower at $65, has been the
rebound base for nearly three months, ever since silver collapsed several tens
of percent over a handful of sessions at the turn of January and February.
In 15 years
tracking precious metals, I've watched the $70 area hold three separate times
this year alone, and that pattern matters more than any single intraday bounce.
A fuller history of those tests sits across my analyst page.
Resistance,
however, is tight. The 50 MA sits at $77, only a whisker above today's price,
and the round-number $80 zone, the late-2025 highs, caps the immediate path.
Above $80 lies the early-March local lows and the mid-April peaks where the
last upward correction stalled.
Even a
clean break of those levels runs into the $90-$94 supply zone marked by
February peaks, with the all-time-high band at $118-$120, set January 29,
sitting above that.
Level
Type
Notes
$118-$120
ATH zone
Historic high, January 29, 2026
$90-$94
Resistance
February peaks
$80
Resistance
Late-2025 highs, round level
$77
Resistance
50 MA
$75.46
Spot
April 30, 2026 close
$70
Support
Three-time
floor since February
$65
Support
200 EMA
$55
Support
October 2025 highs
$22
Bear extension
100%
Fibonacci of recent down-up cycle
The
decision is binary. If silver pushes above $80 and holds, I see room for a slow
grind back toward $94 and eventually the ATH zone. If it loses $70 and the 200
EMA at $65 gives way, the door opens toward $55, the October 2025 highs.
The Bear Case You Cannot
Dismiss: A 100% Fibonacci to $22
The
scenario most current coverage is ignoring is what the Fibonacci math says
about a full-cycle unwind. Plotting the 100% extension of the January-February
dynamic decline followed by the March-April upward correction lands the
projection at $22 per ounce. That implies roughly 70% downside from today's
level, a number large enough to sound implausible until you remember silver has
done worse, faster, before.
I am not
calling for $22. The structure of the move that took silver from $121 to $70,
then bounced toward the mid-$80s and rolled over again, is mechanically
consistent with the kind of multi-month distribution that precedes deep
retracements.
The technical analysis of the silver price chart. Source: Tradingview.com
As my April 21 analysis flagged, a weekly close below $70
would be the first serious warning, and a close below $54.50 would end the
structural bull case. The $22 target is a tail-risk anchor, not a base case.
How High Can Silver Go?Bank
of America's $135-$309 Math
The most
aggressive credible call on the table comes from Bank of America head of metals
research Michael Widmer.
As Jesse
Colombo of the Bubble Bubble Substack laid out in his April 24 review of the
BofA call: "Bank of America has stirred significant attention this week
with a new projection for silver to soar to $135 to as high as $309 in 2026,
this year, not years down the line."
Bank of America sees silver soaring to $135 to $309 this year.
The
mechanism is the gold-silver ratio. The ratio sits near 62 today, and BofA
models a compression toward 32 (the 2011 low) for the base bull case, with 14
(the 1980 low) as the stretch scenario.
Applied to
a gold price already trading near $4,620, that math is what produces the
$135-$309 range. As the FinanceMagnates.com COMEX inventory
analysis noted
earlier this month, the structural setup behind that compression, a sixth
straight year of supply deficit and 13.4% COMEX coverage, has not gone away.
My
one-sentence view: the ratio mechanism is sound and historically defensible,
but the timing is the risk. A 32:1 ratio is a 2- to 3-year setup in past
cycles, not an in-year 2026 outcome.
Where Wall Street's Silver
Forecasts Cluster
The current
institutional forecast band is one of the widest I've tracked in 15 years.
Source
Target
Notes
Bank of America (Widmer)
$135-$309 (2026)
Gold-silver
ratio compression to 32:1 base, 14:1 stretch
Jesse Colombo (Substack)
$300-$500 (secular)
Multi-year
bull market thesis from $28 base
Citi (Layton)
$150 (3-mo, prior)
"Gold
on steroids" call from late January
Reuters poll (30 analysts)
$79.50 median (2026)
Consensus, near current price
JP Morgan (Kolanovic)
$50
Speculative-unwind base case
Citi's $150
three-month call from late January looks aggressive in hindsight given the
subsequent crash, and the bank has not refreshed it publicly. The Reuters poll
median of $79.50 is the most boring and probably the most useful data point: it
implies a flat-to-modestly-higher year from current levels, with everything
else as noise around it.
The gold
parallel is informative. As the recent gold crash analysis detailed, the same hawkish-Fed
channel pulled gold to $4,620 even as JPMorgan held its $6,300 target and
Goldman Sachs maintained $5,400.
Bullion
forecasters are not capitulating, and silver desks aren't either, but the path
to those targets requires either an Iran de-escalation that breaks the oil
channel, or a Fed pivot that markets are not currently pricing. The earlier silver crash analysis from March 20 walked through why neither was in
place at the time, and not much has changed.
Silver Price Prediction
FAQ
Why is silver rising
today?
Silver is
rising 3.21% to $75.46/oz on April 30 because US-Iran peace talks stalled after
Trump dismissed Tehran's latest proposal, reigniting the safe-haven bid that
had compressed earlier this week. Hopes for a near-term Strait of Hormuz
reopening were priced out of crude and metals together, with silver
outperforming gold on a percentage basis as it typically does in directional
precious metals moves.
How high can silver go in
2026?
The
aggressive bull case from Bank of America's Michael Widmer puts silver at
$135-$309 if the gold-silver ratio compresses toward the 32:1 (2011) or 14:1
(1980) historical lows. The Reuters poll consensus of 30 analysts sits at
$79.50 median for 2026. My base case requires a clean break above $80 for an
attempted return to $94 and the $118-$120 ATH zone.
How low can silver go?
A weekly
close below $70 would be the first serious warning, opening a path toward $55
(October 2025 highs and 200 EMA confluence). The 100% Fibonacci extension of
the January-April down-up cycle projects $22 per ounce as a tail-risk extreme,
implying roughly 70% downside. JP Morgan's Marko Kolanovic targets a more
conservative $50.
What is the gold-silver
ratio doing?
The
gold-silver ratio sits near 62 today against a long-term average closer to 60.
Bank of America's $135-$309 silver target is built on the ratio compressing
toward 32 (the 2011 low) or 14 (the 1980 low), which would imply massive silver
outperformance versus gold. That compression typically plays out over multiple
years in past cycles, not in a single calendar year.
Should I buy silver in
2026?
That is a
personal decision tied to risk tolerance, time horizon, and overall portfolio
construction, not a question I can answer for any individual reader.
Structurally, silver has a sixth straight year of supply deficit and meaningful
industrial demand from solar and EV; tactically, it sits between credible bull
cases above $80 and credible bear cases below $70. Position sizing
matters more than direction in this environment.
Silver
traded at $75.46 per ounce on Thursday, April 30, 2026, rebounding 3.21% after
three consecutive sessions of declines that briefly pushed the metal toward the
$70 support floor. The bounce follows the breakdown of US-Iran peace talks
reported earlier in the week, which had compressed the safe-haven premium
silver carried into late April.
With the
Federal Reserve, Bank of England, and ECB all delivering decisions this week,
my silver price prediction turns on whether today's move is a reflex rebound or
the start of a fresh leg toward the $80 resistance shelf.
Follow
me on X for real-time silver and metals analysis: @ChmielDk.
With the
Fed decision already in the rearview as a cautious hold, attention turns to the
ECB and BoE later this week, then US PCE for the inflation read that decides
whether the rate path stays restrictive into Q3.
Why Silver Is Surging
Today? Peace Stalls, Yields Hold
That mix of
geopolitical stress and sticky inflation is what Rania Gule, Senior Market
Analyst at XS.com (MENA), calls a fundamental shift in how silver is being
priced.
The
setup heading into the rest of the week has three moving parts:
Peace talks status: Tehran's proposal rejected, US
counteroffers expected
Central bank pause: Fed, BoE, ECB all expected to
hold but skew hawkish
Oil channel: Brent above $115/barrel
sustains the inflation pressure that capped silver in March
Silver Price Prediction: XAG/USD
Chart Hinges on $70 vs $80
From a
technical standpoint, today's rebound changes very little on the broader chart.
The $70 zone, reinforced by the 200 EMA roughly $5 lower at $65, has been the
rebound base for nearly three months, ever since silver collapsed several tens
of percent over a handful of sessions at the turn of January and February.
In 15 years
tracking precious metals, I've watched the $70 area hold three separate times
this year alone, and that pattern matters more than any single intraday bounce.
A fuller history of those tests sits across my analyst page.
Resistance,
however, is tight. The 50 MA sits at $77, only a whisker above today's price,
and the round-number $80 zone, the late-2025 highs, caps the immediate path.
Above $80 lies the early-March local lows and the mid-April peaks where the
last upward correction stalled.
Even a
clean break of those levels runs into the $90-$94 supply zone marked by
February peaks, with the all-time-high band at $118-$120, set January 29,
sitting above that.
Level
Type
Notes
$118-$120
ATH zone
Historic high, January 29, 2026
$90-$94
Resistance
February peaks
$80
Resistance
Late-2025 highs, round level
$77
Resistance
50 MA
$75.46
Spot
April 30, 2026 close
$70
Support
Three-time
floor since February
$65
Support
200 EMA
$55
Support
October 2025 highs
$22
Bear extension
100%
Fibonacci of recent down-up cycle
The
decision is binary. If silver pushes above $80 and holds, I see room for a slow
grind back toward $94 and eventually the ATH zone. If it loses $70 and the 200
EMA at $65 gives way, the door opens toward $55, the October 2025 highs.
The Bear Case You Cannot
Dismiss: A 100% Fibonacci to $22
The
scenario most current coverage is ignoring is what the Fibonacci math says
about a full-cycle unwind. Plotting the 100% extension of the January-February
dynamic decline followed by the March-April upward correction lands the
projection at $22 per ounce. That implies roughly 70% downside from today's
level, a number large enough to sound implausible until you remember silver has
done worse, faster, before.
I am not
calling for $22. The structure of the move that took silver from $121 to $70,
then bounced toward the mid-$80s and rolled over again, is mechanically
consistent with the kind of multi-month distribution that precedes deep
retracements.
The technical analysis of the silver price chart. Source: Tradingview.com
As my April 21 analysis flagged, a weekly close below $70
would be the first serious warning, and a close below $54.50 would end the
structural bull case. The $22 target is a tail-risk anchor, not a base case.
How High Can Silver Go?Bank
of America's $135-$309 Math
The most
aggressive credible call on the table comes from Bank of America head of metals
research Michael Widmer.
As Jesse
Colombo of the Bubble Bubble Substack laid out in his April 24 review of the
BofA call: "Bank of America has stirred significant attention this week
with a new projection for silver to soar to $135 to as high as $309 in 2026,
this year, not years down the line."
Bank of America sees silver soaring to $135 to $309 this year.
The
mechanism is the gold-silver ratio. The ratio sits near 62 today, and BofA
models a compression toward 32 (the 2011 low) for the base bull case, with 14
(the 1980 low) as the stretch scenario.
Applied to
a gold price already trading near $4,620, that math is what produces the
$135-$309 range. As the FinanceMagnates.com COMEX inventory
analysis noted
earlier this month, the structural setup behind that compression, a sixth
straight year of supply deficit and 13.4% COMEX coverage, has not gone away.
My
one-sentence view: the ratio mechanism is sound and historically defensible,
but the timing is the risk. A 32:1 ratio is a 2- to 3-year setup in past
cycles, not an in-year 2026 outcome.
Where Wall Street's Silver
Forecasts Cluster
The current
institutional forecast band is one of the widest I've tracked in 15 years.
Source
Target
Notes
Bank of America (Widmer)
$135-$309 (2026)
Gold-silver
ratio compression to 32:1 base, 14:1 stretch
Jesse Colombo (Substack)
$300-$500 (secular)
Multi-year
bull market thesis from $28 base
Citi (Layton)
$150 (3-mo, prior)
"Gold
on steroids" call from late January
Reuters poll (30 analysts)
$79.50 median (2026)
Consensus, near current price
JP Morgan (Kolanovic)
$50
Speculative-unwind base case
Citi's $150
three-month call from late January looks aggressive in hindsight given the
subsequent crash, and the bank has not refreshed it publicly. The Reuters poll
median of $79.50 is the most boring and probably the most useful data point: it
implies a flat-to-modestly-higher year from current levels, with everything
else as noise around it.
The gold
parallel is informative. As the recent gold crash analysis detailed, the same hawkish-Fed
channel pulled gold to $4,620 even as JPMorgan held its $6,300 target and
Goldman Sachs maintained $5,400.
Bullion
forecasters are not capitulating, and silver desks aren't either, but the path
to those targets requires either an Iran de-escalation that breaks the oil
channel, or a Fed pivot that markets are not currently pricing. The earlier silver crash analysis from March 20 walked through why neither was in
place at the time, and not much has changed.
Silver Price Prediction
FAQ
Why is silver rising
today?
Silver is
rising 3.21% to $75.46/oz on April 30 because US-Iran peace talks stalled after
Trump dismissed Tehran's latest proposal, reigniting the safe-haven bid that
had compressed earlier this week. Hopes for a near-term Strait of Hormuz
reopening were priced out of crude and metals together, with silver
outperforming gold on a percentage basis as it typically does in directional
precious metals moves.
How high can silver go in
2026?
The
aggressive bull case from Bank of America's Michael Widmer puts silver at
$135-$309 if the gold-silver ratio compresses toward the 32:1 (2011) or 14:1
(1980) historical lows. The Reuters poll consensus of 30 analysts sits at
$79.50 median for 2026. My base case requires a clean break above $80 for an
attempted return to $94 and the $118-$120 ATH zone.
How low can silver go?
A weekly
close below $70 would be the first serious warning, opening a path toward $55
(October 2025 highs and 200 EMA confluence). The 100% Fibonacci extension of
the January-April down-up cycle projects $22 per ounce as a tail-risk extreme,
implying roughly 70% downside. JP Morgan's Marko Kolanovic targets a more
conservative $50.
What is the gold-silver
ratio doing?
The
gold-silver ratio sits near 62 today against a long-term average closer to 60.
Bank of America's $135-$309 silver target is built on the ratio compressing
toward 32 (the 2011 low) or 14 (the 1980 low), which would imply massive silver
outperformance versus gold. That compression typically plays out over multiple
years in past cycles, not in a single calendar year.
Should I buy silver in
2026?
That is a
personal decision tied to risk tolerance, time horizon, and overall portfolio
construction, not a question I can answer for any individual reader.
Structurally, silver has a sixth straight year of supply deficit and meaningful
industrial demand from solar and EV; tactically, it sits between credible bull
cases above $80 and credible bear cases below $70. Position sizing
matters more than direction in this environment.
Damian Chmiel is a Senior Analyst & Editor at Finance Magnates with more than 15 years of experience in the CFD and online trading industry. Active as both a trader and journalist since 2010, he focuses on broker coverage, fintech innovation, and regulatory developments across Europe, the Middle East, and Asia.
His work includes interviews with C-level leaders at major brokerages and fintech platforms, as well as co-authoring Finance Magnates’ quarterly industry benchmarking reports. Damian’s reporting is data-driven, market-aware, and grounded in direct industry engagement. His analysis and commentary have also been cited by external media outlets, including Investing.com, Binance, The Asset, Stockhead, and Dispatch.
Education:
MA in Finance and Accounting, Cracow University of Economics
Citi Cuts Bitcoin and Ethereum Price Predictions, But Those BTC and ETH Charts Go Even Lower
Featured Videos
The FX & CFD Market Is Changing Fast. Here's What's Coming Next (2026)
The FX & CFD Market Is Changing Fast. Here's What's Coming Next (2026)
The FX & CFD Market Is Changing Fast. Here's What's Coming Next (2026)
The FX & CFD Market Is Changing Fast. Here's What's Coming Next (2026)
Where is the FX & CFD industry really heading in 2026?
In this free Finance Magnates Intelligence masterclass, industry experts explore the latest data shaping the global FX & CFD market, how regulation and regional demand influence expansion planning, and how brokerages benchmark performance across 265 firms on the FM Intelligence Portal.
In this session you'll learn:
✔ Where the FX/CFD industry is heading in H2 2026
✔ Why compliance should guide regional expansion decisions
✔ How internal performance compares when benchmarked against 265 brokers
✔ Regional demand shifts across Europe, APAC, and LATAM
✔Broker volume rankings, verification, and FM Intelligence Portal data
Speakers:
• Ramzi Ahmad, Director of Intelligence, Finance Magnates
• Sylwester Majewski, Head of Insights & Reporting Hub, Finance Magnates
• Philios Petrides, Data & Business Intelligence Consultant
If you work in brokerage, fintech, compliance, business development or market strategy, this session offers practical insights backed by verified industry data.
🔔 Subscribe to Finance Magnates for more webinars, interviews and market intelligence covering the global online trading industry.
#FinanceMagnates #FX #CFD #Fintech #Trading #Brokerage #MarketIntelligence #RegTech #Compliance #Forex
Markets never stop changing.
We asked finance executives for their number one success tip, and many came back to the same idea: adapt, stay informed and keep looking ahead.
Featuring executives from Shift Markets, Letknow Pay, Base Markets and SPAYZ.io.
#FinanceMagnates #Leadership #BusinessStrategy #Fintech #Shorts
FM Daily Brief – 20 July 2026
FM Daily Brief – 20 July 2026
FM Daily Brief – 20 July 2026
FM Daily Brief – 20 July 2026
FM Daily Brief – 20 July 2026
FM Daily Brief – 20 July 2026
Today's Monday, the 20th of July 2026, and these are our main stories: two brokers surpass the two-trillion-dollar monthly trading volume mark, Asic posts a record year for civil penalties, and Jump Trading expands its prediction markets team.
Today's Monday, the 20th of July 2026, and these are our main stories: two brokers surpass the two-trillion-dollar monthly trading volume mark, Asic posts a record year for civil penalties, and Jump Trading expands its prediction markets team.
Today's Monday, the 20th of July 2026, and these are our main stories: two brokers surpass the two-trillion-dollar monthly trading volume mark, Asic posts a record year for civil penalties, and Jump Trading expands its prediction markets team.
Today's Monday, the 20th of July 2026, and these are our main stories: two brokers surpass the two-trillion-dollar monthly trading volume mark, Asic posts a record year for civil penalties, and Jump Trading expands its prediction markets team.
Today's Monday, the 20th of July 2026, and these are our main stories: two brokers surpass the two-trillion-dollar monthly trading volume mark, Asic posts a record year for civil penalties, and Jump Trading expands its prediction markets team.
Today's Monday, the 20th of July 2026, and these are our main stories: two brokers surpass the two-trillion-dollar monthly trading volume mark, Asic posts a record year for civil penalties, and Jump Trading expands its prediction markets team.
4 Finance Leaders Share Their Best Career Advice | iFX EXPO
4 Finance Leaders Share Their Best Career Advice | iFX EXPO
4 Finance Leaders Share Their Best Career Advice | iFX EXPO
4 Finance Leaders Share Their Best Career Advice | iFX EXPO
4 Finance Leaders Share Their Best Career Advice | iFX EXPO
4 Finance Leaders Share Their Best Career Advice | iFX EXPO
What advice has had the biggest impact on your career?
We asked four finance executives to share their number one success tip.
From perseverance to curiosity, their answers offer four different perspectives on building a successful career.
#FinanceMagnates #CareerAdvice #Leadership #Fintech #Shorts
What advice has had the biggest impact on your career?
We asked four finance executives to share their number one success tip.
From perseverance to curiosity, their answers offer four different perspectives on building a successful career.
#FinanceMagnates #CareerAdvice #Leadership #Fintech #Shorts
What advice has had the biggest impact on your career?
We asked four finance executives to share their number one success tip.
From perseverance to curiosity, their answers offer four different perspectives on building a successful career.
#FinanceMagnates #CareerAdvice #Leadership #Fintech #Shorts
What advice has had the biggest impact on your career?
We asked four finance executives to share their number one success tip.
From perseverance to curiosity, their answers offer four different perspectives on building a successful career.
#FinanceMagnates #CareerAdvice #Leadership #Fintech #Shorts
What advice has had the biggest impact on your career?
We asked four finance executives to share their number one success tip.
From perseverance to curiosity, their answers offer four different perspectives on building a successful career.
#FinanceMagnates #CareerAdvice #Leadership #Fintech #Shorts
What advice has had the biggest impact on your career?
We asked four finance executives to share their number one success tip.
From perseverance to curiosity, their answers offer four different perspectives on building a successful career.
#FinanceMagnates #CareerAdvice #Leadership #Fintech #Shorts
FM Daily Brief – 17 July 2026
FM Daily Brief – 17 July 2026
FM Daily Brief – 17 July 2026
FM Daily Brief – 17 July 2026
FM Daily Brief – 17 July 2026
FM Daily Brief – 17 July 2026
Today's Friday, the 17th of July 2026, and these are our main stories: MetaTrader 5 expands native AI capabilities through MCP support, Citadel Securities takes a major stake in Crypto.com, and Kraken launches institutional crypto options.
Today's Friday, the 17th of July 2026, and these are our main stories: MetaTrader 5 expands native AI capabilities through MCP support, Citadel Securities takes a major stake in Crypto.com, and Kraken launches institutional crypto options.
Today's Friday, the 17th of July 2026, and these are our main stories: MetaTrader 5 expands native AI capabilities through MCP support, Citadel Securities takes a major stake in Crypto.com, and Kraken launches institutional crypto options.
Today's Friday, the 17th of July 2026, and these are our main stories: MetaTrader 5 expands native AI capabilities through MCP support, Citadel Securities takes a major stake in Crypto.com, and Kraken launches institutional crypto options.
Today's Friday, the 17th of July 2026, and these are our main stories: MetaTrader 5 expands native AI capabilities through MCP support, Citadel Securities takes a major stake in Crypto.com, and Kraken launches institutional crypto options.
Today's Friday, the 17th of July 2026, and these are our main stories: MetaTrader 5 expands native AI capabilities through MCP support, Citadel Securities takes a major stake in Crypto.com, and Kraken launches institutional crypto options.