

Bitcoin (BTC) traded at $74,221 on Tuesday, April 14, 2026, after the session briefly cleared $76,000 and broke March 17 highs at $75,954 before reversing 0.4% into a bearish pin bar at the upper boundary of the consolidation range that has defined the chart since February. The world's largest cryptocurrency now sits 42% below the October 6, 2025 all-time high of $128,198, trapped in a $60K-$75K corridor for the third consecutive month. Three catalysts will resolve the range over the next two weeks: today's April 15 tax deadline, the April 22 ceasefire expiry with Iran, and the April 28-29 FOMC meeting.
In this article, I examine why Bitcoin is going down, how low the BTC price could fall, and what the latest Bitcoin price forecasts are, based on my more than 15 years of experience as a trader and analyst.
Follow me on X for real-time market analysis: @ChmielDk
Why Bitcoin Is Going Down Today? Iran Optimism Meets Tax-Day Reality
Tuesday's intraday push above $76,000 came on a 5% rally from Monday, fueled by Vice President JD Vance's weekend trip to Pakistan for marathon US-Iran negotiations and the prospect of reopening the Strait of Hormuz. The total crypto market capitalization rose 4% to $2.6 trillion in the same session. By the close, every dollar of that gain had been surrendered.
- Why Bitcoin Is Surging Today? BTC Tops $72,000 After Strait of Hormuz Shock as Bitcoin Price Prediction 2026 Target $80K Resistance
- Bitcoin Price Prediction April 2026: Iran Ceasefire and $427M Short Squeeze Set Up BTC $80K Breakout Test
- How High Can Bitcoin Go? This New BTC Price Prediction Targets $240K
The reversal hit at the worst possible technical and seasonal moment. Today's April 15 tax deadline is forecast to drag roughly $2.8 billion of crypto selling into the market. Funding rates on Binance Bitcoin perpetuals have been negative for 46 consecutive days, the longest streak since the FTX collapse marked the 2022 bottom. As the FinanceMagnates.com report from Monday detailed, $6 billion of clustered shorts above $73,000 had primed the move, but spot supply absorbed the breakout before the squeeze could complete.
Joel Kruger, crypto strategist at LMAX Group, framed the setup directly:
"It's one thing to break an important level and another to establish above it. While the technical developments are encouraging, the focus now shifts to confirmation via weekly closes," Kruger wrote. He added that a sustained close above $76,000 in BTC and $2,400 in ETH would strengthen the case for a structural shift.
Three drivers explain Tuesday's failure:
- Tax-day liquidation pressure: roughly $2.8 billion of crypto selling tied to the April 15 deadline
- 46 days of negative perpetual funding: the longest stretch since the FTX bottom, signaling persistent bearish positioning
- Spot supply at the upper band: sellers absorbed the breakout above the March 17 highs at $75,954 within hours
Nothing Has Changed Since February: Bitcoin Range Holds for the Tenth Week
As I wrote in my March 24 analysis, nothing structurally has changed for Bitcoin despite the headline-driven volatility. The $60K-$75K consolidation has now held for ten weeks, marking the lowest price levels since late 2024. Each of the four breakout attempts in 2026 has produced a near-identical sequence: a multi-day rally, a breach of the upper boundary, then a reversal back inside the range.
Three figures define the range:
- Spot price: $74,221, 42% below the October 6, 2025 ATH of $128,198
- 200-day moving average: $87,519, the long-term trend separator
- Funding rate streak: 46 consecutive negative days, last seen post-FTX in late 2022
Bitcoin's correlation to the Nasdaq-100 has climbed back toward 85% during 2026 oil spikes, confirming it continues to trade as a high-beta risk asset rather than a hedge.
Bitcoin Technical Analysis: Pin Bar Confirms Range, $60K-$63K in Sight
My chart shows that Tuesday's candle is the most pronounced bearish pin bar on the BTC daily timeframe since the March rejection at $74,500. The wick into $76,000+ tested both the prior local highs at $75,954 from March 17 and the Fibonacci 0.205 retracement of last year's broader rally. The body closed back inside the range. That structure is textbook for another swing-trade move toward the lower boundary.
The primary downside target sits at $60K-$63K, the February lows that bound the consolidation. Local intermediate support runs at $66K, marked by the late March and early April pivots. As my March 16 analysis flagged, the same structural pattern produced the previous failed breakout, but Tuesday's pin bar is materially more aggressive.
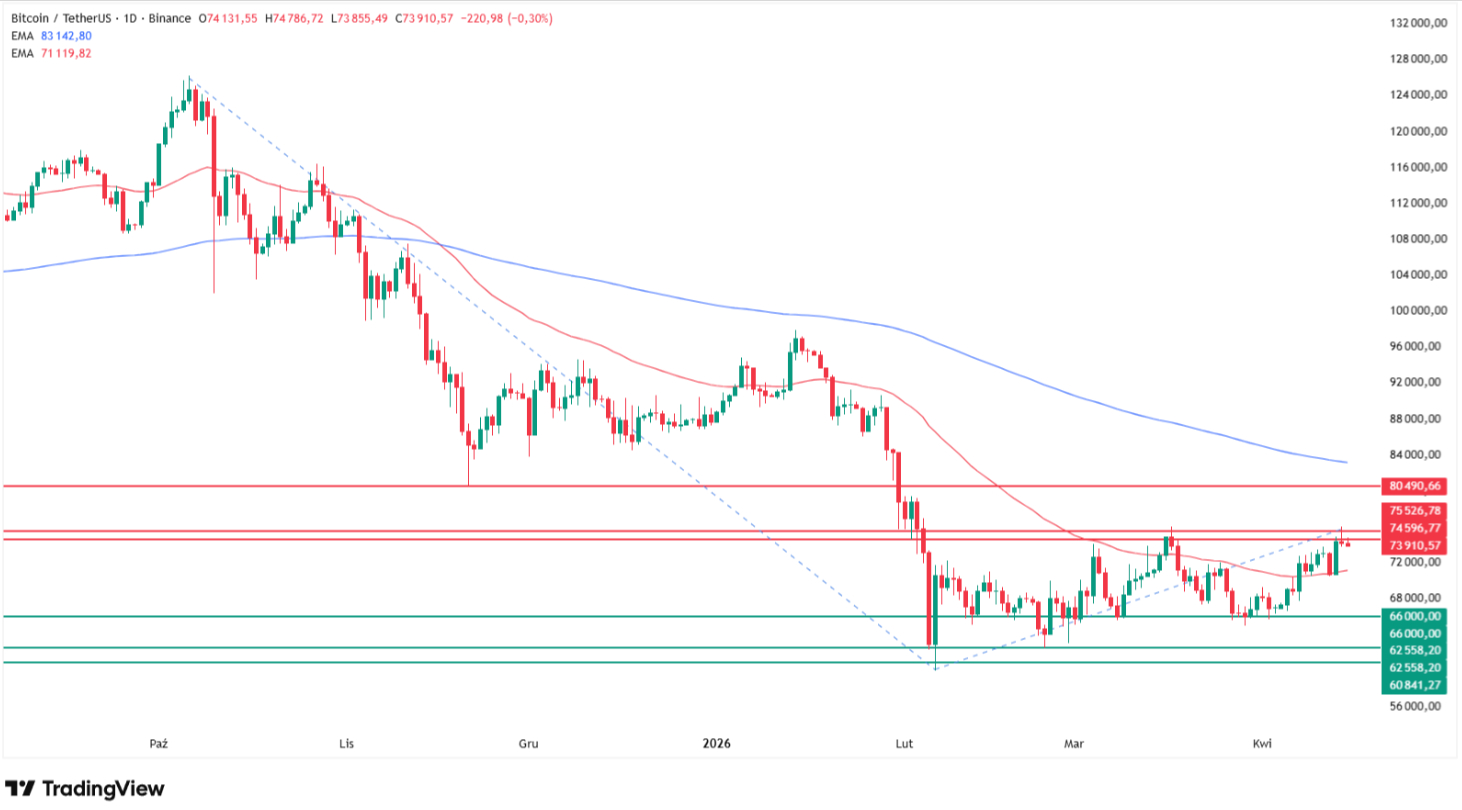
Upside requires three sequential breaks. First, a daily close above $76,000 invalidates the pin bar. Second, $80,000 (the November 2025 lows) caps the next leg. Third, the $85,000 zone aligns with the 200 EMA and the dividing line between bear and bull regimes.
A speculative tail scenario exists. If $60,000 breaks, a Fibonacci extension drawn from the October 2025 high to this year's lows, then to current highs, projects a downside target near $10,000. That implies a 90% drawdown. Past Bitcoin bear cycles delivered comparable percentage losses, but the institutional capital base today, including $18.7 billion of Q1 2026 ETF inflows despite the price decline, makes a move of that magnitude implausible.
Key Bitcoin price levels (April 15, 2026)
Level | Type | Notes |
$85,000-$87,500 | Resistance / 200 EMA | Bear / bull regime divider |
$80,000 | Resistance | November 2025 lows |
$76,000 | Resistance | Tuesday's failed breakout, March 17 highs |
$74,221 | Spot | April 14 close |
$66,000 | Local support | Late March / early April pivots |
$60,000-$63,000 | Major support | February lows, range floor |
$50,000 | Bear extension | August 2024 lows |
$10,000 | Tail Fib target | 161.8% extension, low probability |
Bitcoin Price Predictions: From LMAX's $76K Test to Crypto Birb's $30K Bear Call
The institutional and trader forecast set spans nearly a 10x range. LMAX's Kruger holds the most balanced near-term view, anchoring the bull case on weekly close confirmation rather than intraday wicks.
"For now, markets are moving in the right direction, but the burden remains on bulls to demonstrate follow-through into the weekly close," Kruger said. He pointed to deepening institutional engagement, steady tokenization development, and growing integration with traditional finance as the underlying support for any sustained move higher.
The bear camp on X is more concrete. Trader Kabuki called the current setup a near-perfect 2021 fractal:
$BTC perfectly repeating the 2021 bear market scenario
— Kabuki🔴 (@kabukistory) April 13, 2026
2021: ATH $69K – bear trap – range – bull trap – breakdown
2026: ATH $126K – bear trap – range – bull trap – breakdown
If this fractal completes ~$50K becomes the target bottom
I called every major market move live so… pic.twitter.com/RF1efoWbu7
"$BTC perfectly repeating the 2021 bear market scenario. 2021: ATH $69K, bear trap, range, bull trap, breakdown. 2026: ATH $126K, bear trap, range, bull trap, breakdown. If this fractal completes, ~$50K becomes the target bottom."
Pepesso highlighted a multi-cycle parallel channel where every cycle taps the upper trendline before bleeding to support, projecting a $35K-$40K macro bottom if the 2018 and 2022 structures repeat.
🚨 BTC PARALLEL CHANNEL
— Pepesso (@0xPepesso) April 9, 2026
Every cycle taps the top then bleeds to the lower trendline
2018 -> top then bottom on support
2022 -> same structure again
Now 2026 just rejected the upper band
If this repeats $35K-$40K becomes the next macro bottom
TURN NOTIFS ON! pic.twitter.com/qnWTbUzxNI
Crypto Birb, 16 weeks into what he labels a confirmed bear market, projects $30,000 with anything below $50,000 acceptable for the long run, citing a four-year cycle bottom in October or November.
I've got bad news.
— ₿IRB (@crypto_birb) February 20, 2026
Especially if you believed fake supercycle story waiting for $200k in 2026.
We're 16 weeks into bear market.
With 60% drop I'm guessing $30,000 but anything under $50k will do in long run.
4-year cycle data says bottom in Oct/Nov.
How long until new ATH?👀 pic.twitter.com/U4ySSUNkPK
Institutional desks land between these poles. As the FinanceMagnates.com January preview detailed, the 2026 forecast range spans $75,000 to $225,000. Standard Chartered sits at $150,000 for year-end after halving its prior $300,000 call, while JPMorgan's Fibonacci extension model projects $240,000 long-term.
Bitcoin price prediction table (2026)
Source | Target | Notes |
Joel Kruger, LMAX Group | Weekly close above $76K confirms reversal | April 14, 2026 |
Standard Chartered | $150,000 by year-end 2026 | Cut from prior $300,000 |
JPMorgan | $240,000 long-term | 161.8% Fibonacci extension model |
Carol Alexander, Univ. of Sussex | $75,000-$150,000 range, $110K center | Institutional rebalancing thesis |
Kabuki | $50,000 bottom | April 13, 2021 fractal repeat |
Pepess | $35,000-$40,000 bottom | April 9, parallel channel model |
Crypto Birb | $30,000, October/November bottom | February 20, four-year cycle |
Canary Capital | $50,400 | 60% drawdown from ATH, bear-leg thesis |
Bitcoin Price Prediction FAQ
Why is Bitcoin going down today?
Bitcoin reversed from $76,000 to close at $74,221 on April 14, 2026, as Tuesday's US-Iran peace optimism faded into tax-deadline selling. Roughly $2.8 billion in crypto liquidation tied to the April 15 deadline absorbed the breakout. Funding rates have been negative for 46 days, the longest streak since the FTX collapse, signaling persistent bearish positioning despite spot ETF inflows.
How low can Bitcoin go in 2026?
My primary downside target is $60,000 to $63,000, the February consolidation floor. A break below opens $50,000, the August 2024 lows. The most aggressive Fibonacci extension projects $10,000, but institutional capital absorbed $18.7 billion of Q1 ETF inflows even during the decline, making a 90% drawdown unlikely. X traders Crypto Birb and Pepesso target $30K-$40K.
What is the next Bitcoin price prediction target?
Two scenarios apply. To the upside, a daily close above $76,000 opens the $80,000 November 2025 lows, then the 200 EMA at $87,519. To the downside, the $66,000 March-April pivot is intermediate support before the $60K-$63K range floor. Joel Kruger at LMAX wants a weekly close above $76,000 to confirm any structural reversal.
What does the Bitcoin pin bar pattern mean?
A pin bar is a daily candle with a long upper wick and a small body near the open. Tuesday's session printed one at $76,000 with a close back at $74,221. The structure shows buyers pushed price into resistance and sellers absorbed the move before the close. The same pattern preceded the March rejection at $74,500.
Will Bitcoin recover in 2026?
Institutional forecasts remain constructive medium-term. Standard Chartered targets $150,000 by year-end, JPMorgan's Fibonacci model projects $240,000 long-term, and Carol Alexander at the University of Sussex sees a $75K-$150K range with a $110K center of gravity. Recovery requires a sustained break above the 200 EMA at $87,519 and a Fed pivot from the current 3.50%-3.75% rate band.


