Bitcoin traded at $77,650 on Monday, April 27, 2026, slipping 1% after testing $79,500 last week, the highest level since early February.
Veteran trader Peter Brandt projects a Bitcoin price prediction peak of $300,000-$500,000 by late 2029 if 4-year cycles hold.
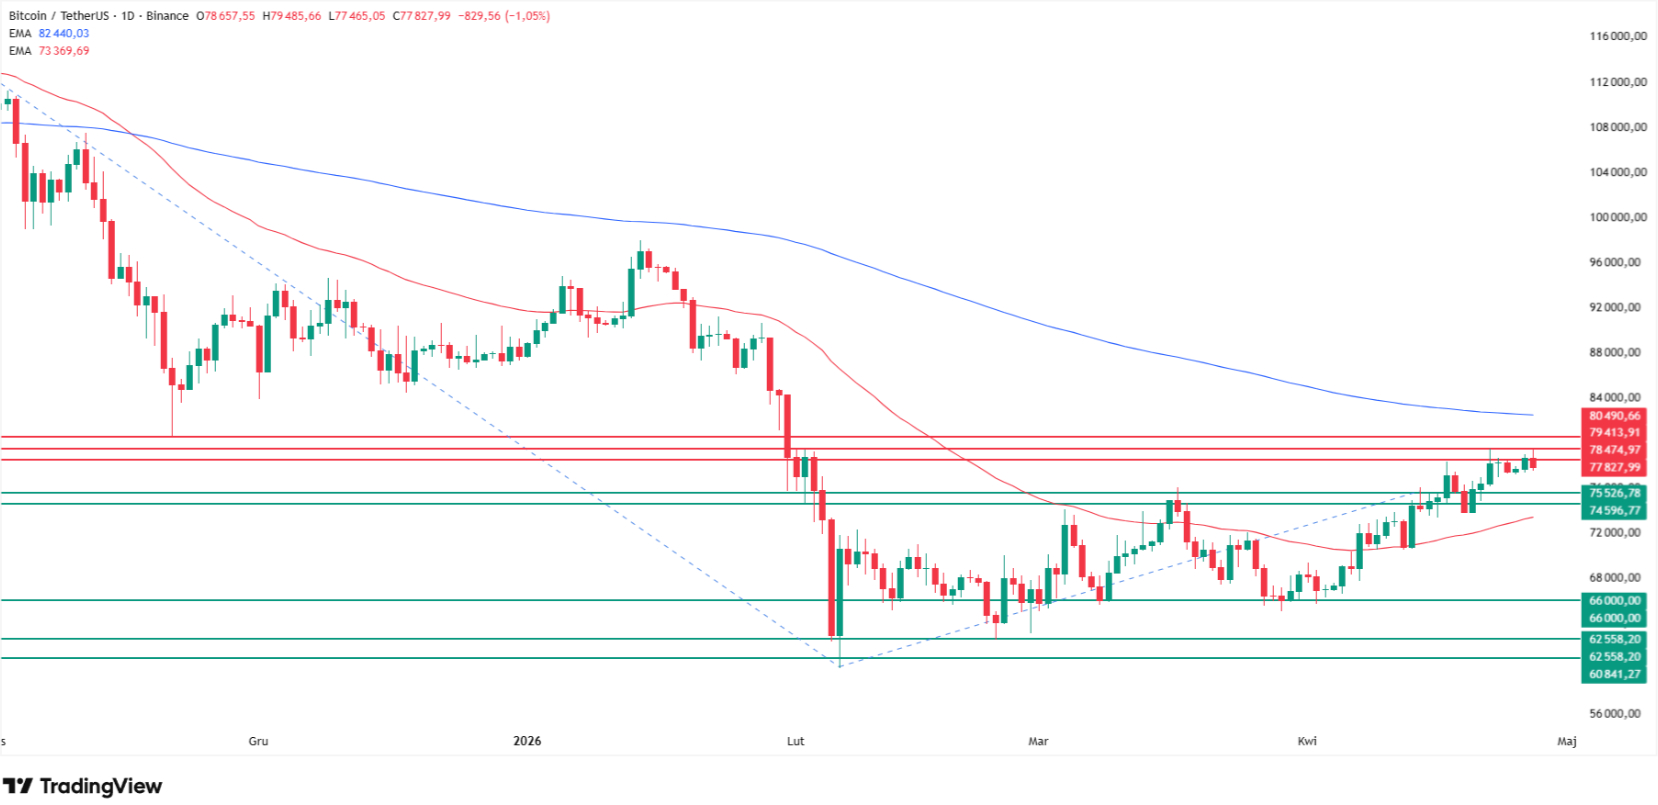
Technical analysis flags $82,700 (200 MA) as the upper barrier, with $73,500 (50 EMA) and $61,000-$63,000 as the support stack.
Why is crypto going up today? Let's check current Bitcoin, Ethereum, XRP and Dogecoin prices
Bitcoin (BTC) traded at $77,650 per coin on Monday, April 27, 2026, slipping 1% after testing
$79,500 during the Asian session, the highest level in roughly two and a half
months.
The
pullback came two days after veteran trader Peter Brandt published a multi-year
Bitcoin price prediction targeting a $300,000 to $500,000 cycle peak by
September-October 2029, conditional on the four-year halving rhythm that has
defined BTC since 2011 continuing to hold.
Brandt also
flagged that his framework calls for one more investable low in
September-October 2026, which may or may not penetrate the February 2026 swing
low near $63,000. The next 48 hours hinge on whether buyers can clear the
$80,000 resistance band or get rejected back into the $73,500-$78,000 range.
Follow
me on X for real-time crypto market analysis: @ChmielDk
Why Brandt's Bitcoin Price
Prediction Hinges On The 4-Year Cycle?
"Should
Bitcoin continue with the most remarkable cyclic patterns of any market in the
past 15 years, an investable low is scheduled for Sep/Oct 2026," Brandt
wrote in an April 23 post on X. "That low might or might not penetrate the
Feb 2026 low.
Should Bitcoin continue with the most remarkable cyclic patterns of any market in the past 15 years, an investable low is scheduled for Sep/Oct 2026. That low might or might not penetrate the Feb 2026 low. The next high (should patterns continue) will be between $300k and $500k…
The next
high (should patterns continue) will be between $300k and $500k in Sep/Oct
2029." Brandt added that he would announce tradable thrusts via his Factor
Report and BitcoinLive platforms.
The $300K-$500K target is
conditional, not unconditional, which separates it from open-ended bull
projections
A confirmed September-October
2026 low is required first, with potential downside below February's
sub-$63,000 print
"Brandt’s view carries some merit," Paul Howard, Director at Wincent, commented for FinanceMagnates.com. "As both an inflation hedge and a highly liquid store of value, Bitcoin possesses several characteristics that could support a 3.5x price increase over the next three years. Based on historical price cycles and frameworks such as the stock-to-flow model, this outlook represents a reasonable thesis grounded in the asset’s past performance."
Why Brandt Says This Is
Not The Bottom Yet
Brandt's
response to a chart from JDK Analysis arguing for a "Short
Re-Accumulation" structure was unequivocal. "This does not look like
a bottom," Brandt replied to the post. The chart he was responding to
showed repeated rejections at local highs, fading volume on each push, and an
invalidation level near $80,500.
JDK
acknowledged the conditional nature of the call. "As long as bulls fail to
show clear strength and follow-through, the current low does not qualify as a
strong bottom. This is purely a probabilistic view!" the analyst wrote.
The setup pointed to continuation lower as the higher-probability path absent a
clean break above resistance.
Brandt also
amplified chartist Aksel Kibar, calling him the most accomplished pure
classical chart analyst alive today. "Sometimes I get criticized by
followers who have a position and want to see updates confirming that position
on 'adjusting' the boundaries," Kibar wrote. "Well, as the market
offers new information we need to adjust. We can't be dogmatic about our
analysis. What looks like a wedge, can morph into a channel."
The
technical concerns supporting the "not yet" thesis cluster around
three points:
Bitcoin still trades below the
365-day average near $87,000
Volume has faded on each push
toward the upper boundary of the current channel
The morphing wedge-to-channel
structure has rejected price at the upper boundary multiple times
"Peter Brandt earned his credibility the way it should be earned: by being right about something painful before it happened," Tyrell Volker, Chief of Staff at Tesseract Group, commented for FinanceMagnates.com. "He called the 2025 top. So when he now sketches an investable low in September–October 2026 and a peak between $300,000 and $500,000 around September–October 2029, anchored to the 2028 halving, the directional argument deserves to be taken seriously. It is not unreasonable. It is, I would gently suggest, conservative, for reasons the chart cannot show."
Bitcoin Technical
Analysis: $80K Resistance, $73,500 Support
Bitcoin
briefly tested $79,500 during the Asian session on Monday, April 27, 2026,
before sellers rejected the move and pushed price back below $78,000.
My chart
shows the rally over the past two weeks has cleared the upper boundary of the
prior consolidation, which I had marked at $75,000 and which had capped every
advance attempt since early March. That level held as support on first retest,
which is technically constructive.
The
resistance picture above current price is stacked. The $80,000 zone aligns with
the November 21 swing lows and last week's local highs. Above that, the
200-period moving average sits at $82,700, the level that separates the
prevailing bearish trend from a confirmed bullish reversal.
Until the
200 EMA flips, my base case is continued sideways action inside a wider
$73,500-$82,700 range, with the directional bias tilting toward the upper bound
only on a sustained close above $80,000. A rejection here would shift focus
back to the support layers below.
Level
Type
Notes
$82,700
Resistance / 200 EMA
Bull/bear trend separator
$80,000
Resistance
Last
week's high, Nov 21 swing zone
$75,000
Reclaimed support
Broken to
upside mid-April
$73,500
Support / 50 EMA
First
downside target on rejection
$66,000
Support
March/April 2026 swing lows
$61,000-$63,000
Support
Lower
consolidation floor, Feb 2026 low
If $73,500
fails, the path opens toward $66,000 and ultimately the $61,000-$63,000 zone
where Brandt's "investable low" could form. As the FinanceMagnates.com report from
April 15 detailed,
the $60,000 floor scenario remains live as long as price stays below the 200
MA.
Bitcoin Price Predictions:
From $500K Bull Case To $50K Bear Risk
The
institutional forecast range for Bitcoin remains exceptionally wide, reflecting
the depth of disagreement on cycle interpretation. The $300,000-$500,000 number
from Brandt is not unprecedented on this site.
A $300,000 call option on Deribit was a top pick in the crypto
options market last cycle, as I wrote in earlier coverage on
FinanceMagnates.com. What is different in Brandt's framing is the conditional
structure and the multi-year horizon.
The
forecasts split cleanly along time horizon and methodology lines.
For now,
the resistance at $80,000-$82,700 is the level that matters. Until it breaks,
my analysis treats Brandt's $500,000 target as a long-horizon scenario, not an
active trade.
FAQ
Can Bitcoin really hit
$500,000 by 2029?
Peter
Brandt's projection of $300,000 to $500,000 by September-October 2029 is
conditional on Bitcoin's four-year cycle pattern continuing to hold. Brandt
explicitly framed the target as scenario-dependent, not a base case. Standard
Chartered also targets $500,000, but pushed its timeline back to 2030. The
target requires sustained ETF inflows, no major macro disruption, and
confirmation of the 2026 cycle low first.
What is Bitcoin's price
today?
Bitcoin
traded at approximately $77,650 per coin on Monday, April 27, 2026, slipping
roughly 1% on the day after testing $79,500 during the Asian session. The
cryptocurrency remains 38% below its October 2025 all-time high near $126,000,
but has reclaimed the $75,000 level that had capped every advance since early
March 2026.
Why does Peter Brandt say
Bitcoin has not bottomed?
Brandt
cited the absence of strong follow-through buying, fading volume on rallies,
and rejections at the upper boundary of the current channel. He responded to a
JDK Analysis chart with "This does not look like a bottom." His
four-year cycle framework calls for an investable low in September-October 2026
that may or may not penetrate the February 2026 low near $63,000.
What are Bitcoin's key
support and resistance levels?
Resistance
sits at $80,000 (last week's high), $82,700 (200 MA), and the $126,000 all-time
high. Key supports include $75,000 (reclaimed mid-April), $73,500 (50 EMA),
$66,000 (March/April lows), and $61,000-$63,000 (lower consolidation, February
2026 low). The 200 MA at $82,700 separates the bearish trend from a confirmed
bullish reversal.
How high can Bitcoin go in
2026?
Institutional
forecasts for 2026 cluster between $75,000 and $250,000. Carol Alexander
projects a $75K-$150K range. Standard Chartered targets $150,000 for year-end
2026. eToro's Yoni Assia sees $250,000. Canary Capital's bear case targets
$50,400 if 2026 is the cycle's bear leg. The wide range reflects deep
disagreement on whether 2026 is a mid-cycle correction or a bear market.
Damian Chmiel is a Senior Analyst & Editor at Finance Magnates with more than 15 years of experience in the CFD and online trading industry. Active as both a trader and journalist since 2010, he focuses on broker coverage, fintech innovation, and regulatory developments across Europe, the Middle East, and Asia.
His work includes interviews with C-level leaders at major brokerages and fintech platforms, as well as co-authoring Finance Magnates’ quarterly industry benchmarking reports. Damian’s reporting is data-driven, market-aware, and grounded in direct industry engagement. His analysis and commentary have also been cited by external media outlets, including Investing.com, Binance, The Asset, Stockhead, and Dispatch.
Education:
MA in Finance and Accounting, Cracow University of Economics
How Low Can Silver Price Go? The New XAG/USD Analysis Suggests -50% Bearish Targer
Featured Videos
FM Daily Brief – 17 July 2026
FM Daily Brief – 17 July 2026
FM Daily Brief – 17 July 2026
FM Daily Brief – 17 July 2026
Today's Friday, the 17th of July 2026, and these are our main stories: MetaTrader 5 expands native AI capabilities through MCP support, Citadel Securities takes a major stake in Crypto.com, and Kraken launches institutional crypto options.
Today's Friday, the 17th of July 2026, and these are our main stories: MetaTrader 5 expands native AI capabilities through MCP support, Citadel Securities takes a major stake in Crypto.com, and Kraken launches institutional crypto options.
Today's Friday, the 17th of July 2026, and these are our main stories: MetaTrader 5 expands native AI capabilities through MCP support, Citadel Securities takes a major stake in Crypto.com, and Kraken launches institutional crypto options.
Today's Friday, the 17th of July 2026, and these are our main stories: MetaTrader 5 expands native AI capabilities through MCP support, Citadel Securities takes a major stake in Crypto.com, and Kraken launches institutional crypto options.
The Future of Crypto Payments: Why Merchants Will Go Hybrid | Tim Ferland | LetKnow Pay
The Future of Crypto Payments: Why Merchants Will Go Hybrid | Tim Ferland | LetKnow Pay
The Future of Crypto Payments: Why Merchants Will Go Hybrid | Tim Ferland | LetKnow Pay
The Future of Crypto Payments: Why Merchants Will Go Hybrid | Tim Ferland | LetKnow Pay
The Future of Crypto Payments: Why Merchants Will Go Hybrid | Tim Ferland | LetKnow Pay
The Future of Crypto Payments: Why Merchants Will Go Hybrid | Tim Ferland | LetKnow Pay
Will crypto payments become a standard payment option for merchants?
In this interview from iFX EXPO International 2026, Yam Yehoshua, Editor-in-Chief of Finance Magnates, speaks with Tim Ferland, CEO of LetKnow Pay, about the current state of crypto payments, merchant adoption, regulation, and why the future of payments is likely to be a hybrid of traditional finance and digital assets.
Tim explains how LetKnow Pay enables businesses to accept cryptocurrency while receiving fiat payouts, making crypto payments simple for merchants without exposing them to the complexity of managing digital assets.
In this interview, you'll learn:
- Why merchant adoption is growing more slowly than many expected
- The biggest misconceptions businesses have about crypto payments
- Why education is more important than technology
- How banks continue to influence crypto adoption
- The impact of MiCA and global crypto regulation
- Why Tim believes the future will combine centralized and decentralized finance
- What's next for LetKnow Pay's payment solutions
Whether you're a broker, payment provider, fintech executive, or simply interested in the future of digital payments, this interview offers valuable insights into where the market is heading.
#CryptoPayments #Crypto #Payments #Fintech #DigitalAssets #Blockchain #Stablecoins #Merchants #FintechNews #FinanceMagnates #iFXEXPO #CryptoAdoption
FM Daily Brief – 16 July 2026
FM Daily Brief – 16 July 2026
FM Daily Brief – 16 July 2026
FM Daily Brief – 16 July 2026
FM Daily Brief – 16 July 2026
FM Daily Brief – 16 July 2026
Today's Thursday, the 16th of July 2026, and these are our main stories: Cyprus authorities dismantle a major crypto investment fraud network, Eightcap brings its simulated trading challenges to TradingView, and Belgium reports a sharp fall in WhatsApp stock-tip fraud losses.
Today's Thursday, the 16th of July 2026, and these are our main stories: Cyprus authorities dismantle a major crypto investment fraud network, Eightcap brings its simulated trading challenges to TradingView, and Belgium reports a sharp fall in WhatsApp stock-tip fraud losses.
Today's Thursday, the 16th of July 2026, and these are our main stories: Cyprus authorities dismantle a major crypto investment fraud network, Eightcap brings its simulated trading challenges to TradingView, and Belgium reports a sharp fall in WhatsApp stock-tip fraud losses.
Today's Thursday, the 16th of July 2026, and these are our main stories: Cyprus authorities dismantle a major crypto investment fraud network, Eightcap brings its simulated trading challenges to TradingView, and Belgium reports a sharp fall in WhatsApp stock-tip fraud losses.
Today's Thursday, the 16th of July 2026, and these are our main stories: Cyprus authorities dismantle a major crypto investment fraud network, Eightcap brings its simulated trading challenges to TradingView, and Belgium reports a sharp fall in WhatsApp stock-tip fraud losses.
Today's Thursday, the 16th of July 2026, and these are our main stories: Cyprus authorities dismantle a major crypto investment fraud network, Eightcap brings its simulated trading challenges to TradingView, and Belgium reports a sharp fall in WhatsApp stock-tip fraud losses.
The Best Success Tip Isn't About Sales | iFX EXPO
The Best Success Tip Isn't About Sales | iFX EXPO
The Best Success Tip Isn't About Sales | iFX EXPO
The Best Success Tip Isn't About Sales | iFX EXPO
The Best Success Tip Isn't About Sales | iFX EXPO
The Best Success Tip Isn't About Sales | iFX EXPO
We asked finance executives one question:
"What's your number one success tip?"
Their answers all pointed in the same direction: build trust, respond quickly and put relationships first.
Featuring Lux Thiagarajah (OpenPayd), Scott Chiriaco (PropAccount.com) and Tatjana Meluskane (SPAYZ.io).
#FinanceMagnates #CustomerSuccess #B2B #Fintech #Shorts
Base Markets CEO: Why Trust Matters More Than Bonuses | Alex Kolpokchi Interview
Base Markets CEO: Why Trust Matters More Than Bonuses | Alex Kolpokchi Interview
Base Markets CEO: Why Trust Matters More Than Bonuses | Alex Kolpokchi Interview
Base Markets CEO: Why Trust Matters More Than Bonuses | Alex Kolpokchi Interview
Base Markets CEO: Why Trust Matters More Than Bonuses | Alex Kolpokchi Interview
Base Markets CEO: Why Trust Matters More Than Bonuses | Alex Kolpokchi Interview
Is it still possible to build a successful brokerage by putting clients first instead of relying on flashy promotions?
In this exclusive Finance Magnates Executive Interview, Yam Yehoshua, Chief Editor at Finance Magnates, sits down with Alex Kolpokchi, Co-Founder & CEO of Base Markets, to discuss the company's vision, the lessons learned from leading brokers, and why trust, transparency and real client value are at the centre of its strategy.
During the interview, Alex shares:
- How his experience at IG and Pepperstone shaped Base Markets
- Why the company describes itself as a "no-nonsense broker"
- The importance of trust, execution and client service
- How real client feedback helped build the platform
- Why Base Markets avoided a traditional public launch
- The company's long-term plans for regulation and growth
What makes Base Markets different in today's competitive brokerage industry
💬 What do you think matters most when choosing a broker—pricing, execution, regulation or customer service? Let us know in the comments.
#BaseMarkets #Forex #CFDTrading #OnlineTrading #Brokerage #Trading #FinanceMagnates #Fintech #CEOInterview #TradingIndustry