Gold fell 1% to $4,289.87 on Monday, June 8, 2026, a two-month low, closing below its 200-day moving average for the first time since 2023.
My chart targets $3,440, around 20% below current levels, if gold loses the $4,280 support zone that marks the October 2025 highs.
The World Gold Council's bear scenario of $3,360 to $3,990 lines up with my target, and the hawkish Fed and yield triggers are now live.
Let's check the current price of gold bar and the latest XAU/USD price forecasts
Gold fell
1% to $4,289.87 per ounce on Monday, June 8, 2026, sliding to a two-month low
and trading below its 200-day moving average for the first time since October
2023, after Friday's hotter-than-expected US jobs report revived bets on a
Federal Reserve rate hike.
Why Gold Is Going Down Today?
Friday's
session alone stripped more than 3% off the price, the steepest single-day drop
in recent weeks. The metal now sits roughly 23% below the $5,595 record set on
January 29. So why is gold going down, and how far can this correction run?
Friday's
drop erased gold's entire 2026 advance, leaving it down 0.3% year to date after
a sharp first-quarter run. Spot silver fell 0.7% to $66.87, leaving both metals
near flat for the year.
Through the
spring I stayed structurally bullish, calling the $4,650 to $4,360 area a buying opportunity in my earlier work. Friday's break
changed that. The level I treated as support is now resistance, and the burden
of proof has shifted to the bulls. This week's catalysts are US CPI, a run of
Fed speakers, and the next move in oil.
Follow
me on X for real-time market analysis: @ChmielDk
The Macro Drivers Behind
the Drop
Gold's
slide is a rates story first. Friday's US labor data came in well above
forecasts, pushing traders to price a more than 50% chance of at least one
Federal Reserve rate hike in 2026, a sharp reversal from the rate-cut
expectations held earlier this year.
The second
driver is inflation risk from energy. Renewed Israel-Iran strikes and attacks
in Lebanon lifted oil prices, reviving fears of sticky inflation and a
higher-for-longer policy stance. The pressure is not confined to Washington.
The Bank of Japan is increasingly expected to raise rates, and the European
Central Bank is seen tightening at its next meeting.
"Higher
interest rates across major economies could create more challenging conditions
for gold," said Somesh Kapuria, CEO of Hola Prime. Kapuria tied the move
to stronger US labor data and renewed Middle East tensions feeding both yields
and inflation expectations.
The bear
case for gold right now rests on a tight cluster of macro signals:
US jobs data beating forecasts,
lifting Fed hike odds above 50% for 2026
10-year Treasury yields above
4.50%, the highest in two weeks
An oil rebound on Middle East
escalation, reviving inflation fears
The BoJ and ECB both leaning
toward tighter policy
A firmer dollar raising the
cost of bullion for non-dollar buyers
Gold Technical Analysis:
The 200-Day EMA Break
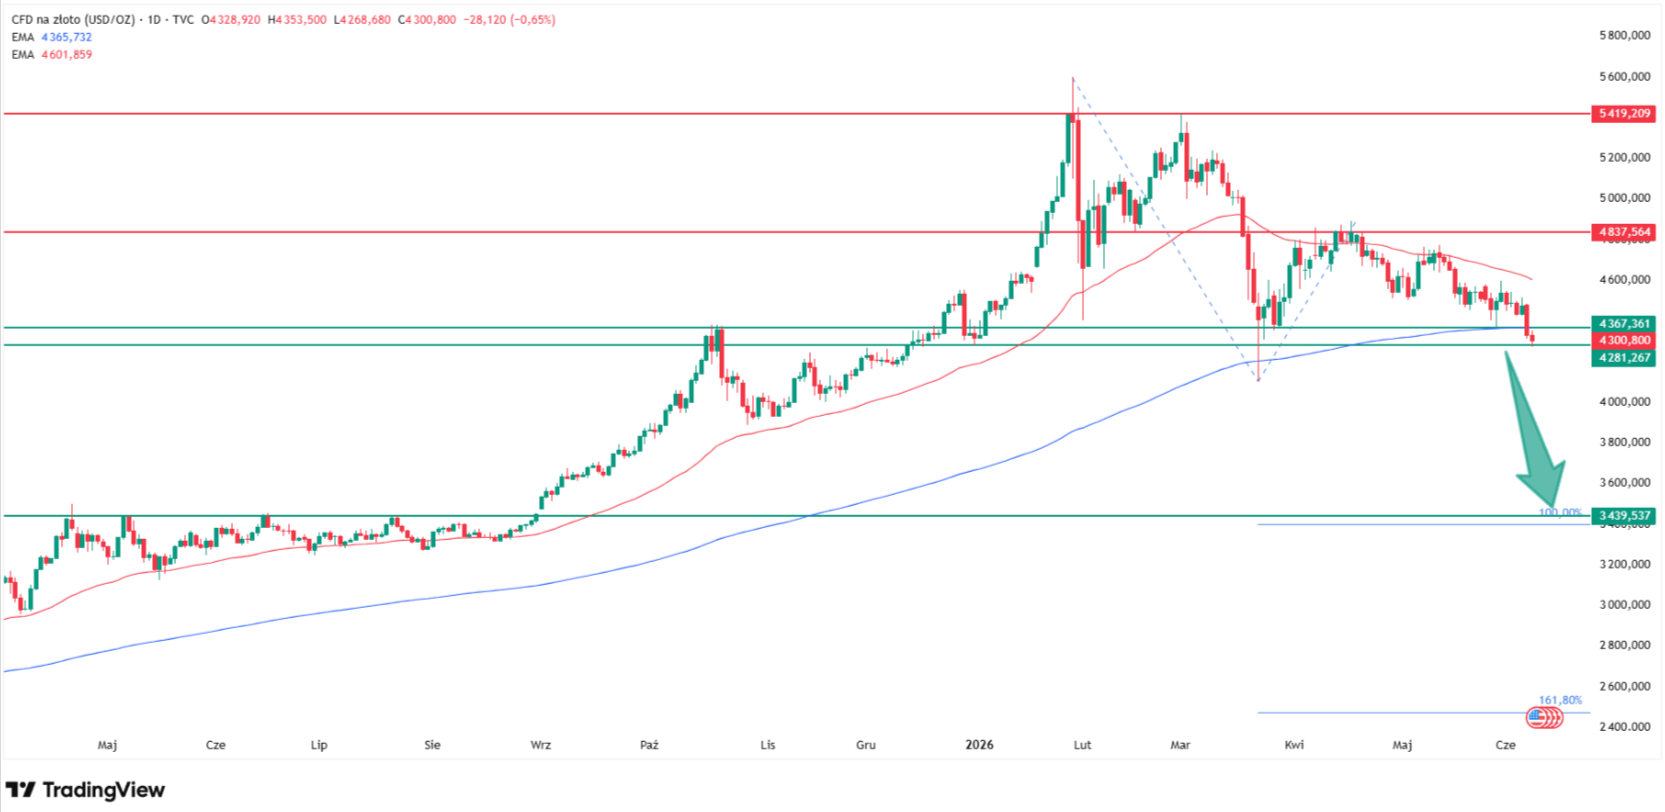
My chart
shows gold testing the lower edge of the consolidation it has traced since
March, a range capped near $4,800 and floored by the 200-day exponential moving
average.
Friday's
close pushed price below the 200-day simple moving average near $4,412 and the
200-day exponential moving average near $4,380, the bull and bear line I flagged in late
March.
The rally
into January was so steep that price had not closed below this average in well
over two years. Momentum still has room to fall, with the 14-day relative
strength index near 46, short of oversold.
In 15-plus
years as a trader and analyst, including a decade covering metals for
FinanceMagnates.com (my analyst page), I have learned a 200-day moving average
break is a warning, not a verdict.
The 2022
and 2023 breaks went opposite ways. After gold lost the average in mid-2022, it
slid from around $1,900 to roughly $1,620 by the autumn. The October 2023
break, by contrast, reversed within weeks and gave way to a fresh
record-setting run.
The line in
the sand now is the $4,280 to $4,400 zone, the October 2025 highs. A decisive
close below it confirms the break and, by my read, opens the path toward the
$3,440 floor I have mapped before in my March crash analysis.
How low can gold price go? XAU/USD technical analysis. Source: Tradingview.com
That target
marks the June and July 2025 peaks and the 100% Fibonacci extension of the
January-to-March decline projected off the April bounce, a drop of around 20%
from current levels. A reclaim of $4,400 would keep the break a false signal,
as in 2023.
Level
Type
Notes
$4,800
Resistance
Top of
the March consolidation range
$4,635
Resistance (50-day SMA)
First
overhead hurdle on a bounce
$4,412
200-day SMA
Broken Friday, now resistance
$4,380
200-day EMA
Also
broken, part of the lost shelf
$4,280 to $4,400
Support (decision zone)
October
2025 highs; close below confirms break
$3,440
Downside target
June and
July 2025 peaks, 100% Fibonacci extension
Gold Price Prediction 2026
The
institutional consensus is still bullish, which is exactly why the current
break matters. Goldman Sachs holds a $5,400 year-end target, which I see as out
of reach unless price reclaims $4,400 within weeks. UBS targets $5,600 but has
flagged a late-stage cycle, a caveat my chart now echoes.
UBP rebuilt bullion positions toward a $6,000 call, a level that
looks remote while gold trades below its 200-day average. JPMorgan's $6,300
sits at the top of the range and, in my view, prices in a return to aggressive
Fed easing that the data is not delivering.
The Reuters poll median of $4,746.50 is the most realistic
bull case, though it still assumes the consolidation holds. On the bear side,
the World Gold Council's "Reflation
Return" scenario
of $3,360 to $3,990 lines up almost exactly with my own $3,440 target, and the
triggers it named, a hawkish Fed, higher yields, and a stronger dollar, are now
live. My base case is a test of $3,440 if $4,280 gives way. A weekly close back
above $4,400 is the one signal that would force me to drop the bearish call.
Source
Target
Notes
Damian Chmiel (my chart)
$3,440
100%
Fibonacci extension, around 20% downside if $4,280 breaks
World Gold Council
$3,360 to $3,990
"Reflation
Return" bear scenario, minus 5% to minus 20%
Reuters poll (median, 30 analysts)
$4,746.50
2026 consensus, assumes consolidation holds
Goldman Sachs
$5,400
Year-end 2026
UBS
$5,600
Year-end,
warns of late-stage cycle
UBP
$6,000
Year-end, rebuilt positions
JPMorgan
$6,300
Year-end,
top of the range
FAQ, Gold Price Analysis
Why is gold going down in
June 2026?
Gold fell
to $4,289.87 on June 8, 2026, after Friday's strong US jobs report pushed Fed
rate-hike odds above 50% for the year. The US 10-year yield rose above 4.50%,
raising the opportunity cost of holding non-yielding bullion. Renewed Middle
East tensions lifted oil and inflation fears, reinforcing a higher-for-longer
policy outlook that weighs on gold.
What is gold's 200-day
moving average and why does the break matter?
Gold's
200-day simple moving average sits near $4,412 and the exponential version near
$4,380. On Friday, price closed below both for the first time since October
2023, a signal traders read as a shift in the long-term trend. History is
mixed: the mid-2022 break preceded a slide to $1,620, while the 2023 break
reversed within weeks.
How low can gold go in
2026?
My chart
targets $3,440 if gold closes below the $4,280 support zone, a drop of around
20% that aligns with the June and July 2025 peaks and the 100% Fibonacci
extension. The World Gold Council's bear scenario points to $3,360 to $3,990. A
reclaim of $4,400 would cancel the bearish setup and keep the consolidation
intact.
What is the gold price
prediction for 2026?
Forecasts
span a wide range. The Reuters poll median is $4,746.50, while Goldman Sachs
targets $5,400, UBS $5,600, UBP $6,000, and JPMorgan $6,300 by year-end. On the
bear side, my $3,440 target and the World Gold Council's $3,360 to $3,990
scenario frame the downside. The direction hinges on whether the 200-day
average is reclaimed.
Is gold a buy after the
200-day moving average break?
Not yet, by
my read. A 200-day break is a warning, and confirmation comes only on a daily
close below $4,280, which would open $3,440. A reclaim of $4,400 would flip the
signal, as in 2023. I would wait for one of those two lines to resolve before
taking a directional stance. This is analysis, not investment advice.
Gold fell
1% to $4,289.87 per ounce on Monday, June 8, 2026, sliding to a two-month low
and trading below its 200-day moving average for the first time since October
2023, after Friday's hotter-than-expected US jobs report revived bets on a
Federal Reserve rate hike.
Why Gold Is Going Down Today?
Friday's
session alone stripped more than 3% off the price, the steepest single-day drop
in recent weeks. The metal now sits roughly 23% below the $5,595 record set on
January 29. So why is gold going down, and how far can this correction run?
Friday's
drop erased gold's entire 2026 advance, leaving it down 0.3% year to date after
a sharp first-quarter run. Spot silver fell 0.7% to $66.87, leaving both metals
near flat for the year.
Through the
spring I stayed structurally bullish, calling the $4,650 to $4,360 area a buying opportunity in my earlier work. Friday's break
changed that. The level I treated as support is now resistance, and the burden
of proof has shifted to the bulls. This week's catalysts are US CPI, a run of
Fed speakers, and the next move in oil.
Follow
me on X for real-time market analysis: @ChmielDk
The Macro Drivers Behind
the Drop
Gold's
slide is a rates story first. Friday's US labor data came in well above
forecasts, pushing traders to price a more than 50% chance of at least one
Federal Reserve rate hike in 2026, a sharp reversal from the rate-cut
expectations held earlier this year.
The second
driver is inflation risk from energy. Renewed Israel-Iran strikes and attacks
in Lebanon lifted oil prices, reviving fears of sticky inflation and a
higher-for-longer policy stance. The pressure is not confined to Washington.
The Bank of Japan is increasingly expected to raise rates, and the European
Central Bank is seen tightening at its next meeting.
"Higher
interest rates across major economies could create more challenging conditions
for gold," said Somesh Kapuria, CEO of Hola Prime. Kapuria tied the move
to stronger US labor data and renewed Middle East tensions feeding both yields
and inflation expectations.
The bear
case for gold right now rests on a tight cluster of macro signals:
US jobs data beating forecasts,
lifting Fed hike odds above 50% for 2026
10-year Treasury yields above
4.50%, the highest in two weeks
An oil rebound on Middle East
escalation, reviving inflation fears
The BoJ and ECB both leaning
toward tighter policy
A firmer dollar raising the
cost of bullion for non-dollar buyers
Gold Technical Analysis:
The 200-Day EMA Break
My chart
shows gold testing the lower edge of the consolidation it has traced since
March, a range capped near $4,800 and floored by the 200-day exponential moving
average.
Friday's
close pushed price below the 200-day simple moving average near $4,412 and the
200-day exponential moving average near $4,380, the bull and bear line I flagged in late
March.
The rally
into January was so steep that price had not closed below this average in well
over two years. Momentum still has room to fall, with the 14-day relative
strength index near 46, short of oversold.
In 15-plus
years as a trader and analyst, including a decade covering metals for
FinanceMagnates.com (my analyst page), I have learned a 200-day moving average
break is a warning, not a verdict.
The 2022
and 2023 breaks went opposite ways. After gold lost the average in mid-2022, it
slid from around $1,900 to roughly $1,620 by the autumn. The October 2023
break, by contrast, reversed within weeks and gave way to a fresh
record-setting run.
The line in
the sand now is the $4,280 to $4,400 zone, the October 2025 highs. A decisive
close below it confirms the break and, by my read, opens the path toward the
$3,440 floor I have mapped before in my March crash analysis.
How low can gold price go? XAU/USD technical analysis. Source: Tradingview.com
That target
marks the June and July 2025 peaks and the 100% Fibonacci extension of the
January-to-March decline projected off the April bounce, a drop of around 20%
from current levels. A reclaim of $4,400 would keep the break a false signal,
as in 2023.
Level
Type
Notes
$4,800
Resistance
Top of
the March consolidation range
$4,635
Resistance (50-day SMA)
First
overhead hurdle on a bounce
$4,412
200-day SMA
Broken Friday, now resistance
$4,380
200-day EMA
Also
broken, part of the lost shelf
$4,280 to $4,400
Support (decision zone)
October
2025 highs; close below confirms break
$3,440
Downside target
June and
July 2025 peaks, 100% Fibonacci extension
Gold Price Prediction 2026
The
institutional consensus is still bullish, which is exactly why the current
break matters. Goldman Sachs holds a $5,400 year-end target, which I see as out
of reach unless price reclaims $4,400 within weeks. UBS targets $5,600 but has
flagged a late-stage cycle, a caveat my chart now echoes.
UBP rebuilt bullion positions toward a $6,000 call, a level that
looks remote while gold trades below its 200-day average. JPMorgan's $6,300
sits at the top of the range and, in my view, prices in a return to aggressive
Fed easing that the data is not delivering.
The Reuters poll median of $4,746.50 is the most realistic
bull case, though it still assumes the consolidation holds. On the bear side,
the World Gold Council's "Reflation
Return" scenario
of $3,360 to $3,990 lines up almost exactly with my own $3,440 target, and the
triggers it named, a hawkish Fed, higher yields, and a stronger dollar, are now
live. My base case is a test of $3,440 if $4,280 gives way. A weekly close back
above $4,400 is the one signal that would force me to drop the bearish call.
Source
Target
Notes
Damian Chmiel (my chart)
$3,440
100%
Fibonacci extension, around 20% downside if $4,280 breaks
World Gold Council
$3,360 to $3,990
"Reflation
Return" bear scenario, minus 5% to minus 20%
Reuters poll (median, 30 analysts)
$4,746.50
2026 consensus, assumes consolidation holds
Goldman Sachs
$5,400
Year-end 2026
UBS
$5,600
Year-end,
warns of late-stage cycle
UBP
$6,000
Year-end, rebuilt positions
JPMorgan
$6,300
Year-end,
top of the range
FAQ, Gold Price Analysis
Why is gold going down in
June 2026?
Gold fell
to $4,289.87 on June 8, 2026, after Friday's strong US jobs report pushed Fed
rate-hike odds above 50% for the year. The US 10-year yield rose above 4.50%,
raising the opportunity cost of holding non-yielding bullion. Renewed Middle
East tensions lifted oil and inflation fears, reinforcing a higher-for-longer
policy outlook that weighs on gold.
What is gold's 200-day
moving average and why does the break matter?
Gold's
200-day simple moving average sits near $4,412 and the exponential version near
$4,380. On Friday, price closed below both for the first time since October
2023, a signal traders read as a shift in the long-term trend. History is
mixed: the mid-2022 break preceded a slide to $1,620, while the 2023 break
reversed within weeks.
How low can gold go in
2026?
My chart
targets $3,440 if gold closes below the $4,280 support zone, a drop of around
20% that aligns with the June and July 2025 peaks and the 100% Fibonacci
extension. The World Gold Council's bear scenario points to $3,360 to $3,990. A
reclaim of $4,400 would cancel the bearish setup and keep the consolidation
intact.
What is the gold price
prediction for 2026?
Forecasts
span a wide range. The Reuters poll median is $4,746.50, while Goldman Sachs
targets $5,400, UBS $5,600, UBP $6,000, and JPMorgan $6,300 by year-end. On the
bear side, my $3,440 target and the World Gold Council's $3,360 to $3,990
scenario frame the downside. The direction hinges on whether the 200-day
average is reclaimed.
Is gold a buy after the
200-day moving average break?
Not yet, by
my read. A 200-day break is a warning, and confirmation comes only on a daily
close below $4,280, which would open $3,440. A reclaim of $4,400 would flip the
signal, as in 2023. I would wait for one of those two lines to resolve before
taking a directional stance. This is analysis, not investment advice.
Damian Chmiel is a Senior Analyst & Editor at Finance Magnates with more than 15 years of experience in the CFD and online trading industry. Active as both a trader and journalist since 2010, he focuses on broker coverage, fintech innovation, and regulatory developments across Europe, the Middle East, and Asia.
His work includes interviews with C-level leaders at major brokerages and fintech platforms, as well as co-authoring Finance Magnates’ quarterly industry benchmarking reports. Damian’s reporting is data-driven, market-aware, and grounded in direct industry engagement. His analysis and commentary have also been cited by external media outlets, including Investing.com, Binance, The Asset, Stockhead, and Dispatch.
Education:
MA in Finance and Accounting, Cracow University of Economics
Citi Cuts Bitcoin and Ethereum Price Predictions, But Those BTC and ETH Charts Go Even Lower
Featured Videos
FM Daily Brief – 20 July 2026
FM Daily Brief – 20 July 2026
FM Daily Brief – 20 July 2026
FM Daily Brief – 20 July 2026
Today's Monday, the 20th of July 2026, and these are our main stories: two brokers surpass the two-trillion-dollar monthly trading volume mark, Asic posts a record year for civil penalties, and Jump Trading expands its prediction markets team.
Today's Monday, the 20th of July 2026, and these are our main stories: two brokers surpass the two-trillion-dollar monthly trading volume mark, Asic posts a record year for civil penalties, and Jump Trading expands its prediction markets team.
Today's Monday, the 20th of July 2026, and these are our main stories: two brokers surpass the two-trillion-dollar monthly trading volume mark, Asic posts a record year for civil penalties, and Jump Trading expands its prediction markets team.
Today's Monday, the 20th of July 2026, and these are our main stories: two brokers surpass the two-trillion-dollar monthly trading volume mark, Asic posts a record year for civil penalties, and Jump Trading expands its prediction markets team.
4 Finance Leaders Share Their Best Career Advice | iFX EXPO
4 Finance Leaders Share Their Best Career Advice | iFX EXPO
4 Finance Leaders Share Their Best Career Advice | iFX EXPO
4 Finance Leaders Share Their Best Career Advice | iFX EXPO
4 Finance Leaders Share Their Best Career Advice | iFX EXPO
4 Finance Leaders Share Their Best Career Advice | iFX EXPO
What advice has had the biggest impact on your career?
We asked four finance executives to share their number one success tip.
From perseverance to curiosity, their answers offer four different perspectives on building a successful career.
#FinanceMagnates #CareerAdvice #Leadership #Fintech #Shorts
What advice has had the biggest impact on your career?
We asked four finance executives to share their number one success tip.
From perseverance to curiosity, their answers offer four different perspectives on building a successful career.
#FinanceMagnates #CareerAdvice #Leadership #Fintech #Shorts
What advice has had the biggest impact on your career?
We asked four finance executives to share their number one success tip.
From perseverance to curiosity, their answers offer four different perspectives on building a successful career.
#FinanceMagnates #CareerAdvice #Leadership #Fintech #Shorts
What advice has had the biggest impact on your career?
We asked four finance executives to share their number one success tip.
From perseverance to curiosity, their answers offer four different perspectives on building a successful career.
#FinanceMagnates #CareerAdvice #Leadership #Fintech #Shorts
What advice has had the biggest impact on your career?
We asked four finance executives to share their number one success tip.
From perseverance to curiosity, their answers offer four different perspectives on building a successful career.
#FinanceMagnates #CareerAdvice #Leadership #Fintech #Shorts
What advice has had the biggest impact on your career?
We asked four finance executives to share their number one success tip.
From perseverance to curiosity, their answers offer four different perspectives on building a successful career.
#FinanceMagnates #CareerAdvice #Leadership #Fintech #Shorts
FM Daily Brief – 17 July 2026
FM Daily Brief – 17 July 2026
FM Daily Brief – 17 July 2026
FM Daily Brief – 17 July 2026
FM Daily Brief – 17 July 2026
FM Daily Brief – 17 July 2026
Today's Friday, the 17th of July 2026, and these are our main stories: MetaTrader 5 expands native AI capabilities through MCP support, Citadel Securities takes a major stake in Crypto.com, and Kraken launches institutional crypto options.
Today's Friday, the 17th of July 2026, and these are our main stories: MetaTrader 5 expands native AI capabilities through MCP support, Citadel Securities takes a major stake in Crypto.com, and Kraken launches institutional crypto options.
Today's Friday, the 17th of July 2026, and these are our main stories: MetaTrader 5 expands native AI capabilities through MCP support, Citadel Securities takes a major stake in Crypto.com, and Kraken launches institutional crypto options.
Today's Friday, the 17th of July 2026, and these are our main stories: MetaTrader 5 expands native AI capabilities through MCP support, Citadel Securities takes a major stake in Crypto.com, and Kraken launches institutional crypto options.
Today's Friday, the 17th of July 2026, and these are our main stories: MetaTrader 5 expands native AI capabilities through MCP support, Citadel Securities takes a major stake in Crypto.com, and Kraken launches institutional crypto options.
Today's Friday, the 17th of July 2026, and these are our main stories: MetaTrader 5 expands native AI capabilities through MCP support, Citadel Securities takes a major stake in Crypto.com, and Kraken launches institutional crypto options.
The Future of Crypto Payments: Why Merchants Will Go Hybrid | Tim Ferland | LetKnow Pay
The Future of Crypto Payments: Why Merchants Will Go Hybrid | Tim Ferland | LetKnow Pay
The Future of Crypto Payments: Why Merchants Will Go Hybrid | Tim Ferland | LetKnow Pay
The Future of Crypto Payments: Why Merchants Will Go Hybrid | Tim Ferland | LetKnow Pay
The Future of Crypto Payments: Why Merchants Will Go Hybrid | Tim Ferland | LetKnow Pay
The Future of Crypto Payments: Why Merchants Will Go Hybrid | Tim Ferland | LetKnow Pay
Will crypto payments become a standard payment option for merchants?
In this interview from iFX EXPO International 2026, Yam Yehoshua, Editor-in-Chief of Finance Magnates, speaks with Tim Ferland, CEO of LetKnow Pay, about the current state of crypto payments, merchant adoption, regulation, and why the future of payments is likely to be a hybrid of traditional finance and digital assets.
Tim explains how LetKnow Pay enables businesses to accept cryptocurrency while receiving fiat payouts, making crypto payments simple for merchants without exposing them to the complexity of managing digital assets.
In this interview, you'll learn:
- Why merchant adoption is growing more slowly than many expected
- The biggest misconceptions businesses have about crypto payments
- Why education is more important than technology
- How banks continue to influence crypto adoption
- The impact of MiCA and global crypto regulation
- Why Tim believes the future will combine centralized and decentralized finance
- What's next for LetKnow Pay's payment solutions
Whether you're a broker, payment provider, fintech executive, or simply interested in the future of digital payments, this interview offers valuable insights into where the market is heading.
#CryptoPayments #Crypto #Payments #Fintech #DigitalAssets #Blockchain #Stablecoins #Merchants #FintechNews #FinanceMagnates #iFXEXPO #CryptoAdoption
FM Daily Brief – 16 July 2026
FM Daily Brief – 16 July 2026
FM Daily Brief – 16 July 2026
FM Daily Brief – 16 July 2026
FM Daily Brief – 16 July 2026
FM Daily Brief – 16 July 2026
Today's Thursday, the 16th of July 2026, and these are our main stories: Cyprus authorities dismantle a major crypto investment fraud network, Eightcap brings its simulated trading challenges to TradingView, and Belgium reports a sharp fall in WhatsApp stock-tip fraud losses.
Today's Thursday, the 16th of July 2026, and these are our main stories: Cyprus authorities dismantle a major crypto investment fraud network, Eightcap brings its simulated trading challenges to TradingView, and Belgium reports a sharp fall in WhatsApp stock-tip fraud losses.
Today's Thursday, the 16th of July 2026, and these are our main stories: Cyprus authorities dismantle a major crypto investment fraud network, Eightcap brings its simulated trading challenges to TradingView, and Belgium reports a sharp fall in WhatsApp stock-tip fraud losses.
Today's Thursday, the 16th of July 2026, and these are our main stories: Cyprus authorities dismantle a major crypto investment fraud network, Eightcap brings its simulated trading challenges to TradingView, and Belgium reports a sharp fall in WhatsApp stock-tip fraud losses.
Today's Thursday, the 16th of July 2026, and these are our main stories: Cyprus authorities dismantle a major crypto investment fraud network, Eightcap brings its simulated trading challenges to TradingView, and Belgium reports a sharp fall in WhatsApp stock-tip fraud losses.
Today's Thursday, the 16th of July 2026, and these are our main stories: Cyprus authorities dismantle a major crypto investment fraud network, Eightcap brings its simulated trading challenges to TradingView, and Belgium reports a sharp fall in WhatsApp stock-tip fraud losses.