Bitcoin trades at $81,250 on Wednesday, May 6, 2026, the strongest level since late January, up 0.4% on the day in early Asian hours.
The E200 MA at roughly $82,000 is the only resistance left between BTC and a confirmed bull reversal; my chart sits with the bulls above it.
Bitcoin (BTC) traded at
$81,250 on Wednesday, May 6, 2026, testing the $81,760 intraday high that
marked the cryptocurrency's strongest level since late January. The price is up
0.4% on the day after Tuesday's close above the upper boundary of a multi-month
consolidation, the first weekly base-break since the Iran ceasefire failed in
March.
The 200-day
exponential moving average at roughly $82,000 is now the single technical line
separating the four-month downtrend from a confirmed bullish reversal. Spot
Bitcoin ETF assets have crossed $100 billion across the US funds, with
BlackRock's IBIT alone above $63 billion.
The
"how high can Bitcoin go" question depends almost entirely on whether
the 200 EMA holds or breaks over the next three trading sessions.
Follow
me on X for real-time market analysis: @ChmielDk
Why Is Bitcoin Price Going
Up Today?
The bid
pushing Bitcoin higher and the credit signals coming out of DeFi are no longer
the same trade. For most of 2024 and 2025, the spot price and stablecoin yield
curves moved in rough sympathy. The last two weeks have separated them as
cleanly as crypto markets ever manage.
"Bitcoin
trading above $80,000 and DeFi yields were, until recently, framed as one
story. The last fortnight has separated them about as cleanly as the market
ever does," said Adam Haeems, Head of Asset Management at Tesseract Group.
Haeems
pointed to Aave V3 USDC supply rates that spiked to 12% in late April after a
cross-chain bridge exploit, before governance normalized them back to 3.86%.
The same week BTC reclaimed $80,000, lending rates ran their own credit event
with no spillover in either direction.
ETF Bid, Iran
De-escalation, and the Strategy Wildcard
Strategy
(formerly MicroStrategy) Executive Chairman Michael Saylor said on yesterday's
Q1 earnings call that the company may sell part of its 818,334 BTC position to
fund dividend payments, briefly pushing BTC below $81,000 before buyers
absorbed the supply concern.
A potential
sale by the largest corporate Bitcoin holder produced a sub-$500 dip that
recovered inside an hour, the depth of the ETF-anchored bid Haeems described.
"Bitcoin
continues to trade above the $81,000 level, supported by clear momentum from
institutional inflows. However, this upward movement raises fundamental
questions about its sustainability amid a noticeable divergence between price
action and underlying fundamentals," said Rania Gule, Senior Market
Analyst at XS.com.
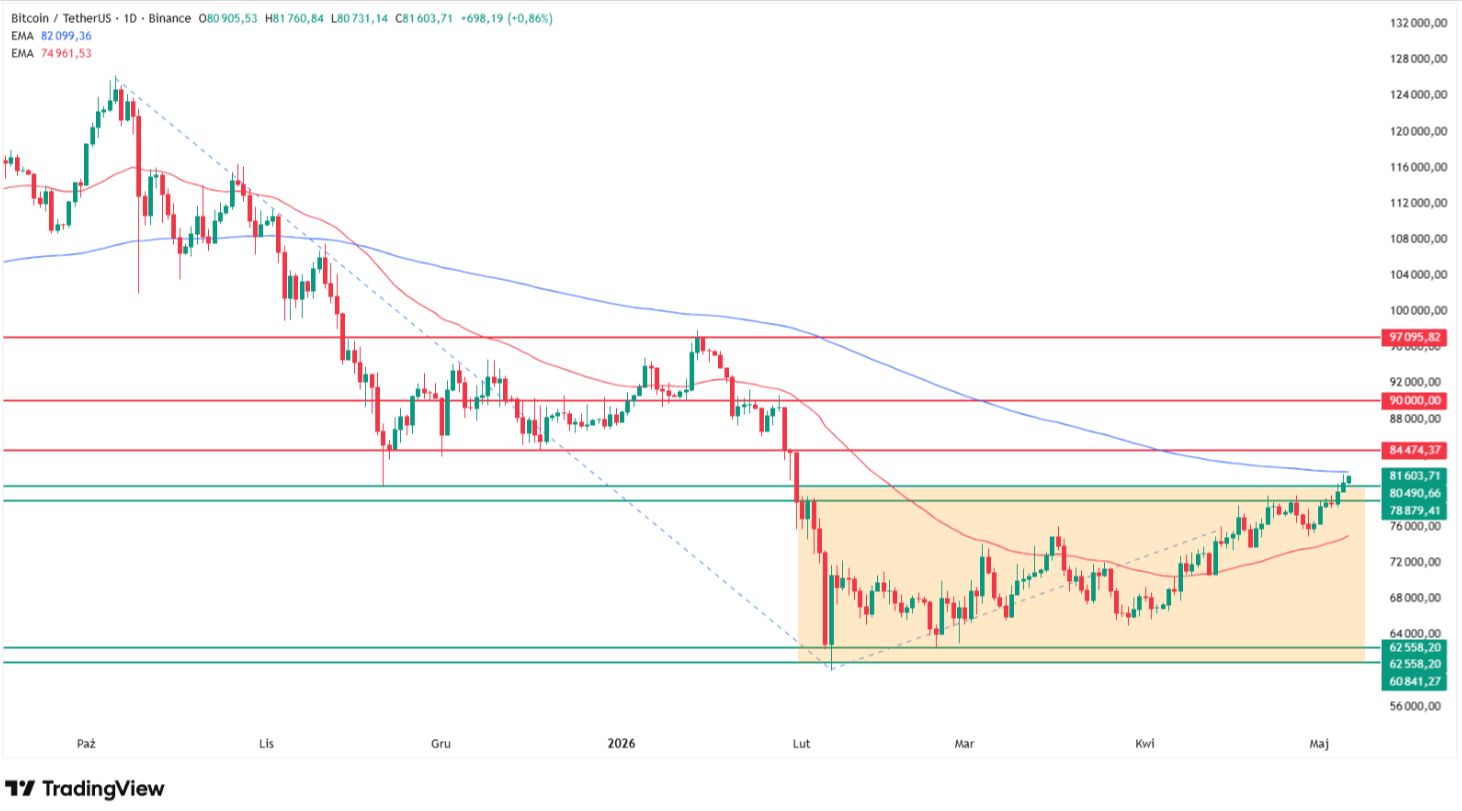
Bitcoin Technical
Analysis: The 200 EMA at $82,000 Is the Whole Trade
Wednesday's
session tested $81,760, the highest print since the end of January, with BTC
holding above the upper boundary of the consolidation that has framed the chart
for months. Tuesday's close above that boundary is the technical confirmation
buyers have been waiting for.
In 15 years
covering crypto and forex markets, where my analyst page archives the running record, I have watched
Bitcoin retest its 200 EMA enough times to know what a clean break looks like
and what a fakeout looks like. The level on my chart sits at roughly $82,000,
the line separating the prevailing downtrend from a confirmed reversal. A daily
close above it is the only signal I trust.
If $82,000
breaks cleanly, the upside path is not necessarily spectacular. Next resistance
sits at the November-December lows around $84,000, then the round-number
$90,000 zone, and then the early-January peaks near $97,000 where heavier
selling started.
The
downside scenario invalidates on a failed breakout. If BTC fails the 200 EMA
test and slips back under $80,000, the chart returns to its consolidation
range, where the 50 EMA at roughly $75,000 acts as dynamic support.
Only a
clean break below $75,000 shifts me back into bearish positioning, with the
lower channel boundary at $61,000 to $63,000, the February lows, as the next
major target.
This is the
same level architecture my April 9 analysis flagged when the $80,000 breakout
was hypothetical, and the call my Monday analysis confirmed once the level held.
Level
Type
Notes
$97,000
Resistance
Early-January
peaks, prior heavy-selling zone
$90,000
Resistance
Round-number psychological barrier
$84,000
Resistance
November-December swing lows
$82,000
200 MA
Bull/bear
pivot, separates trend states
$80,000
Support
Consolidation upper boundary
$75,000
50 MA
Dynamic support inside consolidation
$61,000-$63,000
Support
February
lows, lower channel boundary
ETF Inflows, Whale
Wallets, and the $208M Profit-Take Test
The flow
picture is more constructive than the consolidation chart suggests. Spot
Bitcoin ETFs absorbed $208 million in net realized profit on Sunday alone, a
one-month high, with the price holding above $80,000 into Tuesday despite the
heavy sell-side flow. That is the textbook signature of a thickening cost-basis
layer absorbing supply, not a blowoff top.
Howard's
read aligns with the structural flow picture Tesseract's Haeems described, with
US spot ETF AUM now above $100 billion and BlackRock's IBIT alone at roughly
$63.7 billion, a footprint the same firm extended into Europe through its Swiss-domiciled iShares
Bitcoin ETP.
Strategy's
potential dividend-funding sales are the wildcard, but Sunday's $208 million
profit-take absorption suggests the bid is deep enough.
How High Can Bitcoin Go?
Targets From $100K to $225K
The
"how high" question splits across institutional desks. Standard
Chartered cut its year-end 2026 target to $150,000 in December, and Bernstein
landed on the same figure days later. Bloomberg Intelligence's Eric Balchunas
projects $130,000 on the lower end.
Bit
Mining's Wei Yang holds the $225,000 outlier. Wincent's Howard expects $100,000
by Q4 2026 but does not see a new all-time high above $126,198 within the year.
My read:
the $130,000 to $150,000 cluster is reasonable if the 200 MA breaks cleanly
this week. The $225,000 target needs a Q3 catalyst the chart does not
anticipate. Wincent's $100,000 view fits my roadmap, aligning with $97,000
resistance at the prior heavy-selling zone.
Veteran
trader Peter Brandt's late-April work targets $300,000 to $500,000 by
September-October 2029 conditional on the four-year halving rhythm, but that is
a 2027-2029 thesis, not one that changes the immediate $82,000 test.
Source
Target
My one-sentence view
Standard Chartered
$150K (YE 2026)
Reasonable
if 200 MA breaks; my TA path supports it
Bit Mining (Wei Yang)
$225K (YE 2026)
Stretched;
requires a Q3 catalyst the chart does not anticipate
Bloomberg / Balchunas
$130K (YE 2026)
Most
credible base case, aligns with my $97K next resistance
Wincent / Howard
$100K (Q4 2026)
Closest
to my technical picture, no new ATH this year
Bitcoin Price Analysis, FAQ
How high can Bitcoin go in
2026?
Institutional
year-end 2026 targets cluster at $150,000 (Standard Chartered, Bernstein), with
Bloomberg's Balchunas at $130,000, Wincent's Howard at $100,000 by Q4, and Bit
Mining holding the $225,000 outlier. My technical analysis identifies $97,000
as the next major resistance after the 200 MA at $82,000, with $90,000 as the
round-number psychological level in between.
Why is Bitcoin going up
today?
Bitcoin is
up 0.4% to $81,250 on Wednesday, May 6, 2026, on three converging catalysts:
$2.44 billion in April spot ETF inflows, the Strait of Hormuz reopening to
US-escorted commercial traffic, and absorption of Strategy's signaled possible
BTC sale by the spot ETF bid.
Bitcoin (BTC) traded at
$81,250 on Wednesday, May 6, 2026, testing the $81,760 intraday high that
marked the cryptocurrency's strongest level since late January. The price is up
0.4% on the day after Tuesday's close above the upper boundary of a multi-month
consolidation, the first weekly base-break since the Iran ceasefire failed in
March.
The 200-day
exponential moving average at roughly $82,000 is now the single technical line
separating the four-month downtrend from a confirmed bullish reversal. Spot
Bitcoin ETF assets have crossed $100 billion across the US funds, with
BlackRock's IBIT alone above $63 billion.
The
"how high can Bitcoin go" question depends almost entirely on whether
the 200 EMA holds or breaks over the next three trading sessions.
Follow
me on X for real-time market analysis: @ChmielDk
Why Is Bitcoin Price Going
Up Today?
The bid
pushing Bitcoin higher and the credit signals coming out of DeFi are no longer
the same trade. For most of 2024 and 2025, the spot price and stablecoin yield
curves moved in rough sympathy. The last two weeks have separated them as
cleanly as crypto markets ever manage.
"Bitcoin
trading above $80,000 and DeFi yields were, until recently, framed as one
story. The last fortnight has separated them about as cleanly as the market
ever does," said Adam Haeems, Head of Asset Management at Tesseract Group.
Haeems
pointed to Aave V3 USDC supply rates that spiked to 12% in late April after a
cross-chain bridge exploit, before governance normalized them back to 3.86%.
The same week BTC reclaimed $80,000, lending rates ran their own credit event
with no spillover in either direction.
ETF Bid, Iran
De-escalation, and the Strategy Wildcard
Strategy
(formerly MicroStrategy) Executive Chairman Michael Saylor said on yesterday's
Q1 earnings call that the company may sell part of its 818,334 BTC position to
fund dividend payments, briefly pushing BTC below $81,000 before buyers
absorbed the supply concern.
A potential
sale by the largest corporate Bitcoin holder produced a sub-$500 dip that
recovered inside an hour, the depth of the ETF-anchored bid Haeems described.
"Bitcoin
continues to trade above the $81,000 level, supported by clear momentum from
institutional inflows. However, this upward movement raises fundamental
questions about its sustainability amid a noticeable divergence between price
action and underlying fundamentals," said Rania Gule, Senior Market
Analyst at XS.com.
Bitcoin Technical
Analysis: The 200 EMA at $82,000 Is the Whole Trade
Wednesday's
session tested $81,760, the highest print since the end of January, with BTC
holding above the upper boundary of the consolidation that has framed the chart
for months. Tuesday's close above that boundary is the technical confirmation
buyers have been waiting for.
In 15 years
covering crypto and forex markets, where my analyst page archives the running record, I have watched
Bitcoin retest its 200 EMA enough times to know what a clean break looks like
and what a fakeout looks like. The level on my chart sits at roughly $82,000,
the line separating the prevailing downtrend from a confirmed reversal. A daily
close above it is the only signal I trust.
If $82,000
breaks cleanly, the upside path is not necessarily spectacular. Next resistance
sits at the November-December lows around $84,000, then the round-number
$90,000 zone, and then the early-January peaks near $97,000 where heavier
selling started.
The
downside scenario invalidates on a failed breakout. If BTC fails the 200 EMA
test and slips back under $80,000, the chart returns to its consolidation
range, where the 50 EMA at roughly $75,000 acts as dynamic support.
Only a
clean break below $75,000 shifts me back into bearish positioning, with the
lower channel boundary at $61,000 to $63,000, the February lows, as the next
major target.
This is the
same level architecture my April 9 analysis flagged when the $80,000 breakout
was hypothetical, and the call my Monday analysis confirmed once the level held.
Level
Type
Notes
$97,000
Resistance
Early-January
peaks, prior heavy-selling zone
$90,000
Resistance
Round-number psychological barrier
$84,000
Resistance
November-December swing lows
$82,000
200 MA
Bull/bear
pivot, separates trend states
$80,000
Support
Consolidation upper boundary
$75,000
50 MA
Dynamic support inside consolidation
$61,000-$63,000
Support
February
lows, lower channel boundary
ETF Inflows, Whale
Wallets, and the $208M Profit-Take Test
The flow
picture is more constructive than the consolidation chart suggests. Spot
Bitcoin ETFs absorbed $208 million in net realized profit on Sunday alone, a
one-month high, with the price holding above $80,000 into Tuesday despite the
heavy sell-side flow. That is the textbook signature of a thickening cost-basis
layer absorbing supply, not a blowoff top.
Howard's
read aligns with the structural flow picture Tesseract's Haeems described, with
US spot ETF AUM now above $100 billion and BlackRock's IBIT alone at roughly
$63.7 billion, a footprint the same firm extended into Europe through its Swiss-domiciled iShares
Bitcoin ETP.
Strategy's
potential dividend-funding sales are the wildcard, but Sunday's $208 million
profit-take absorption suggests the bid is deep enough.
How High Can Bitcoin Go?
Targets From $100K to $225K
The
"how high" question splits across institutional desks. Standard
Chartered cut its year-end 2026 target to $150,000 in December, and Bernstein
landed on the same figure days later. Bloomberg Intelligence's Eric Balchunas
projects $130,000 on the lower end.
Bit
Mining's Wei Yang holds the $225,000 outlier. Wincent's Howard expects $100,000
by Q4 2026 but does not see a new all-time high above $126,198 within the year.
My read:
the $130,000 to $150,000 cluster is reasonable if the 200 MA breaks cleanly
this week. The $225,000 target needs a Q3 catalyst the chart does not
anticipate. Wincent's $100,000 view fits my roadmap, aligning with $97,000
resistance at the prior heavy-selling zone.
Veteran
trader Peter Brandt's late-April work targets $300,000 to $500,000 by
September-October 2029 conditional on the four-year halving rhythm, but that is
a 2027-2029 thesis, not one that changes the immediate $82,000 test.
Source
Target
My one-sentence view
Standard Chartered
$150K (YE 2026)
Reasonable
if 200 MA breaks; my TA path supports it
Bit Mining (Wei Yang)
$225K (YE 2026)
Stretched;
requires a Q3 catalyst the chart does not anticipate
Bloomberg / Balchunas
$130K (YE 2026)
Most
credible base case, aligns with my $97K next resistance
Wincent / Howard
$100K (Q4 2026)
Closest
to my technical picture, no new ATH this year
Bitcoin Price Analysis, FAQ
How high can Bitcoin go in
2026?
Institutional
year-end 2026 targets cluster at $150,000 (Standard Chartered, Bernstein), with
Bloomberg's Balchunas at $130,000, Wincent's Howard at $100,000 by Q4, and Bit
Mining holding the $225,000 outlier. My technical analysis identifies $97,000
as the next major resistance after the 200 MA at $82,000, with $90,000 as the
round-number psychological level in between.
Why is Bitcoin going up
today?
Bitcoin is
up 0.4% to $81,250 on Wednesday, May 6, 2026, on three converging catalysts:
$2.44 billion in April spot ETF inflows, the Strait of Hormuz reopening to
US-escorted commercial traffic, and absorption of Strategy's signaled possible
BTC sale by the spot ETF bid.
Damian Chmiel is a Senior Analyst & Editor at Finance Magnates with more than 15 years of experience in the CFD and online trading industry. Active as both a trader and journalist since 2010, he focuses on broker coverage, fintech innovation, and regulatory developments across Europe, the Middle East, and Asia.
His work includes interviews with C-level leaders at major brokerages and fintech platforms, as well as co-authoring Finance Magnates’ quarterly industry benchmarking reports. Damian’s reporting is data-driven, market-aware, and grounded in direct industry engagement. His analysis and commentary have also been cited by external media outlets, including Investing.com, Binance, The Asset, Stockhead, and Dispatch.
Education:
MA in Finance and Accounting, Cracow University of Economics
Bitcoin Price Prediction: BTC Breaks Its 50-Month EMA in the Worst Month Since 2022
Featured Videos
FM Daily Brief – 28 July 2026
FM Daily Brief – 28 July 2026
FM Daily Brief – 28 July 2026
FM Daily Brief – 28 July 2026
Today's Tuesday, the 28th of July 2026, and these are our main stories: tastytrade enters the CFTC regulated prediction markets, Mitrade renews its Argentina football sponsorship, and the Tokyo Stock Exchange pushes to lower the cost of investing.
Today's Tuesday, the 28th of July 2026, and these are our main stories: tastytrade enters the CFTC regulated prediction markets, Mitrade renews its Argentina football sponsorship, and the Tokyo Stock Exchange pushes to lower the cost of investing.
Today's Tuesday, the 28th of July 2026, and these are our main stories: tastytrade enters the CFTC regulated prediction markets, Mitrade renews its Argentina football sponsorship, and the Tokyo Stock Exchange pushes to lower the cost of investing.
Today's Tuesday, the 28th of July 2026, and these are our main stories: tastytrade enters the CFTC regulated prediction markets, Mitrade renews its Argentina football sponsorship, and the Tokyo Stock Exchange pushes to lower the cost of investing.
Today's Monday, the 27th of July 2026, and these are our main stories: iFOREX reports stronger client growth despite currency headwinds, BlackBull's New Zealand business expands, and the FCA highlights Consumer Duty good practice.
Today's Monday, the 27th of July 2026, and these are our main stories: iFOREX reports stronger client growth despite currency headwinds, BlackBull's New Zealand business expands, and the FCA highlights Consumer Duty good practice.
Today's Monday, the 27th of July 2026, and these are our main stories: iFOREX reports stronger client growth despite currency headwinds, BlackBull's New Zealand business expands, and the FCA highlights Consumer Duty good practice.
Today's Monday, the 27th of July 2026, and these are our main stories: iFOREX reports stronger client growth despite currency headwinds, BlackBull's New Zealand business expands, and the FCA highlights Consumer Duty good practice.
Today's Monday, the 27th of July 2026, and these are our main stories: iFOREX reports stronger client growth despite currency headwinds, BlackBull's New Zealand business expands, and the FCA highlights Consumer Duty good practice.
Today's Monday, the 27th of July 2026, and these are our main stories: iFOREX reports stronger client growth despite currency headwinds, BlackBull's New Zealand business expands, and the FCA highlights Consumer Duty good practice.
FM Daily Brief – 24 July 2026
FM Daily Brief – 24 July 2026
FM Daily Brief – 24 July 2026
FM Daily Brief – 24 July 2026
FM Daily Brief – 24 July 2026
FM Daily Brief – 24 July 2026
Today's Friday, the 24th of July 2026, and these are our main stories: the FCA finds major gaps in anti-money laundering controls at alternative asset managers, Wise shares tumble after a US banking licence setback, and Google's EU fines could benefit fintech apps.
Today's Friday, the 24th of July 2026, and these are our main stories: the FCA finds major gaps in anti-money laundering controls at alternative asset managers, Wise shares tumble after a US banking licence setback, and Google's EU fines could benefit fintech apps.
Today's Friday, the 24th of July 2026, and these are our main stories: the FCA finds major gaps in anti-money laundering controls at alternative asset managers, Wise shares tumble after a US banking licence setback, and Google's EU fines could benefit fintech apps.
Today's Friday, the 24th of July 2026, and these are our main stories: the FCA finds major gaps in anti-money laundering controls at alternative asset managers, Wise shares tumble after a US banking licence setback, and Google's EU fines could benefit fintech apps.
Today's Friday, the 24th of July 2026, and these are our main stories: the FCA finds major gaps in anti-money laundering controls at alternative asset managers, Wise shares tumble after a US banking licence setback, and Google's EU fines could benefit fintech apps.
Today's Friday, the 24th of July 2026, and these are our main stories: the FCA finds major gaps in anti-money laundering controls at alternative asset managers, Wise shares tumble after a US banking licence setback, and Google's EU fines could benefit fintech apps.
FM Daily Brief – 23 July 2026
FM Daily Brief – 23 July 2026
FM Daily Brief – 23 July 2026
FM Daily Brief – 23 July 2026
FM Daily Brief – 23 July 2026
FM Daily Brief – 23 July 2026
Today's Thursday, the 23rd of July 2026, and these are our main stories: BitMEX announces it will shut down its crypto trading platform, the Financial Commission launches a certification programme for prop firms, and the SEC settles a records lawsuit with Coinbase.
Today's Thursday, the 23rd of July 2026, and these are our main stories: BitMEX announces it will shut down its crypto trading platform, the Financial Commission launches a certification programme for prop firms, and the SEC settles a records lawsuit with Coinbase.
Today's Thursday, the 23rd of July 2026, and these are our main stories: BitMEX announces it will shut down its crypto trading platform, the Financial Commission launches a certification programme for prop firms, and the SEC settles a records lawsuit with Coinbase.
Today's Thursday, the 23rd of July 2026, and these are our main stories: BitMEX announces it will shut down its crypto trading platform, the Financial Commission launches a certification programme for prop firms, and the SEC settles a records lawsuit with Coinbase.
Today's Thursday, the 23rd of July 2026, and these are our main stories: BitMEX announces it will shut down its crypto trading platform, the Financial Commission launches a certification programme for prop firms, and the SEC settles a records lawsuit with Coinbase.
Today's Thursday, the 23rd of July 2026, and these are our main stories: BitMEX announces it will shut down its crypto trading platform, the Financial Commission launches a certification programme for prop firms, and the SEC settles a records lawsuit with Coinbase.
FM Daily Brief – 22 July 2026
FM Daily Brief – 22 July 2026
FM Daily Brief – 22 July 2026
FM Daily Brief – 22 July 2026
FM Daily Brief – 22 July 2026
FM Daily Brief – 22 July 2026
Today's Wednesday, the 22nd of July 2026, and these are our main stories: retail CFD broker trading volumes ease in the second quarter, Interactive Brokers posts strong quarterly results, and tastytrade faces a Finra fine.
Today's Wednesday, the 22nd of July 2026, and these are our main stories: retail CFD broker trading volumes ease in the second quarter, Interactive Brokers posts strong quarterly results, and tastytrade faces a Finra fine.
Today's Wednesday, the 22nd of July 2026, and these are our main stories: retail CFD broker trading volumes ease in the second quarter, Interactive Brokers posts strong quarterly results, and tastytrade faces a Finra fine.
Today's Wednesday, the 22nd of July 2026, and these are our main stories: retail CFD broker trading volumes ease in the second quarter, Interactive Brokers posts strong quarterly results, and tastytrade faces a Finra fine.
Today's Wednesday, the 22nd of July 2026, and these are our main stories: retail CFD broker trading volumes ease in the second quarter, Interactive Brokers posts strong quarterly results, and tastytrade faces a Finra fine.
Today's Wednesday, the 22nd of July 2026, and these are our main stories: retail CFD broker trading volumes ease in the second quarter, Interactive Brokers posts strong quarterly results, and tastytrade faces a Finra fine.