
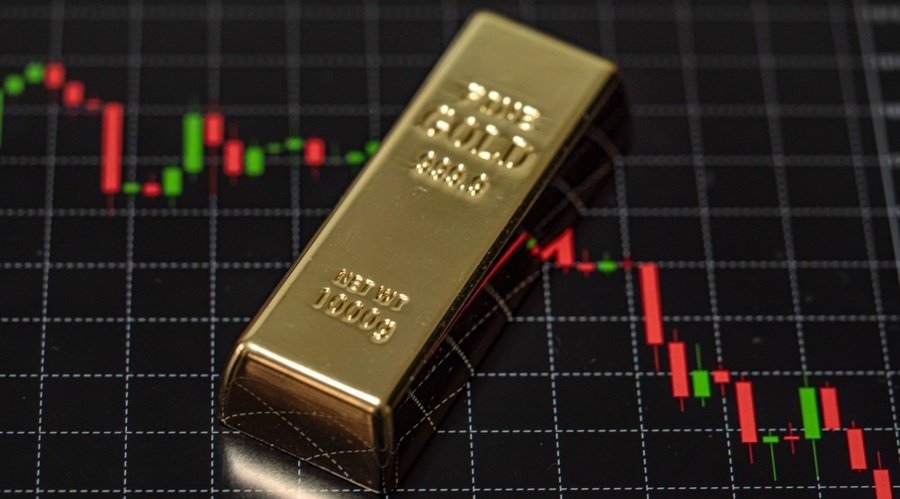
Gold (XAU/USD) traded at $3,976.90 per ounce on Thursday, June 25, 2026, holding below the $4,000 level for the first time since November 2025 after Wednesday's close at $3,991 marked the first sub-$4,000 daily close in seven months.
The metal is down roughly 5% year-to-date and about 29% below the $5,595 record set on January 29, with a stronger dollar and rising Federal Reserve rate-hike odds driving the slide. This week's catalyst is the May PCE inflation report, due Thursday.
In this article, I am answering the question why gold is falling down today and how low its price may go.
Follow me on X for real-time market analysis: @ChmielDk
Gold Technical Analysis: The $4,000 Polarity Flip
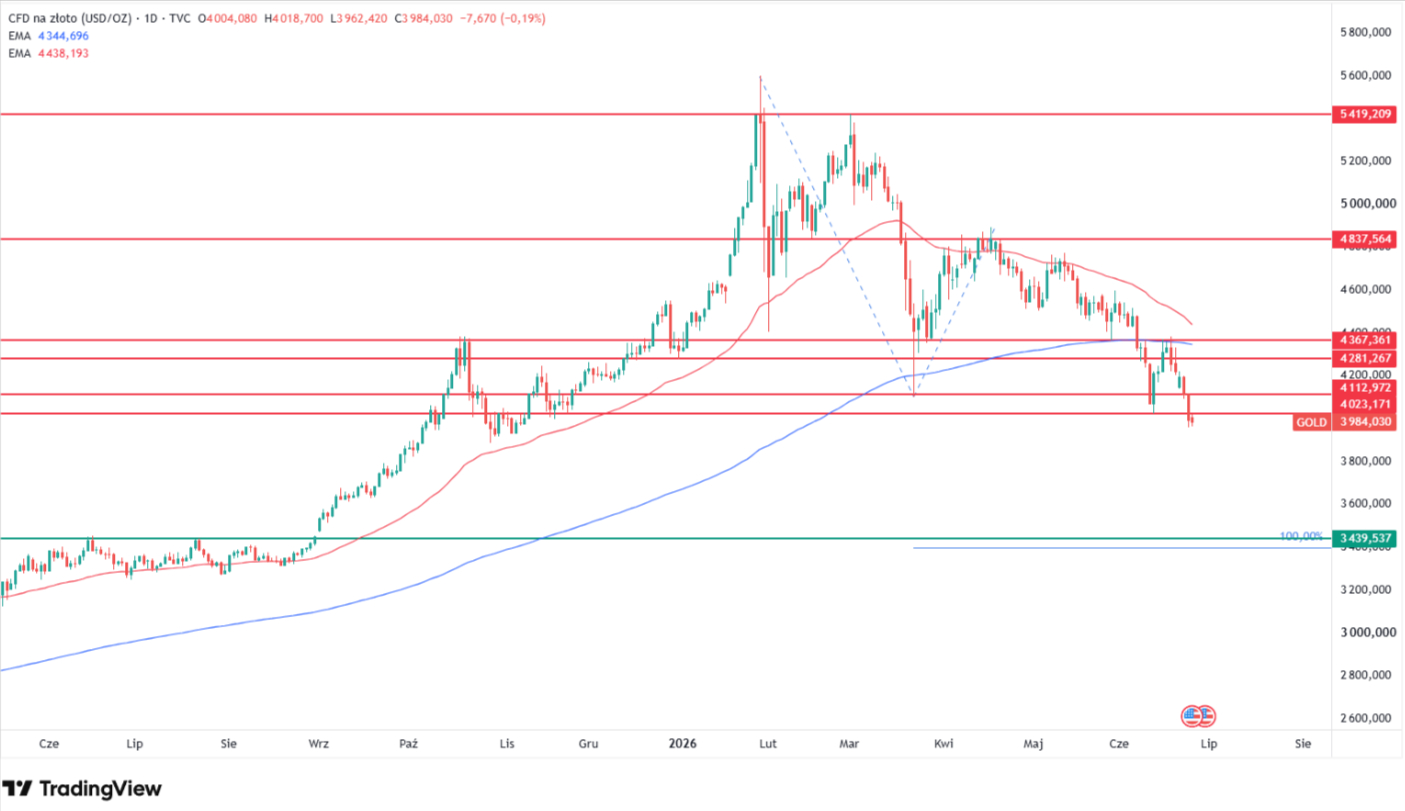
The story on my chart this week is a polarity change. The $4,000 area, which acted as support at the March 2026 lows and again through June, broke on Wednesday's close and is now being retested from below as resistance.
Price tagged an intraday low of $3,959 on Wednesday before stabilizing near $3,976 on Thursday. In 15+ years as a trader and analyst, 10 of them at FinanceMagnates.com, I have watched gold defend the $4,000 zone repeatedly, which is why this first close beneath it carries weight on my analyst page read of the trend.
- Why Gold Price Is Going Down? XAU/USD Price Prediction Based on Death Cross Targets $3,400
- Why Is Gold Falling Today? XAU/USD Price Tests November 2025 Lows, Targets $3,400
- Why Is Gold Going Down? Gold Price Falls Below 200 EMA And This XAU/USD Forecasts Shows -20% Target
The 50-day and 200-day moving averages continue to converge toward a death cross, and they sit closer now than when my June 22 analysis first flagged the setup. The trend turned lower in early June, when gold lost its 200-day average, the level I tracked in my June 8 analysis.
My Fibonacci extension off the 2025 advance still points to $3,440, the 100% level, roughly 15% below spot and about 39% under the January record.
Level | Type | Notes |
$4,300 | Resistance / 200 EMA | Bull/bear line, reclaim neutralizes the setup |
$4,000 | Resistance (flipped) | Former support, now capping from above |
$3,976 | Spot | June 25 price |
$3,959 | Support | June 24 intraday low |
$3,440 | Target | 100% Fibonacci extension, my downside objective |
The bias stays bearish below $4,000. A daily close back above it would reset the flip, and only a reclaim of the 200 EMA near $4,300 would reopen the upside, the same boundary I mapped in my early-May chart work.
Why Is Gold Falling Below $4,000?
Gold is falling because the rate story turned against it. The Federal Reserve held in June but signaled a hawkish bias, and markets now price roughly 68% odds of a September hike, up from 29% a week earlier. That repricing lifted real Treasury yields and pushed the dollar to its highest level in more than a year, both negative for a non-yielding asset.
"Gold prices remain under pressure, reaching multi-month lows," said Bas Kooijman, CEO and Asset Manager at DHF Capital S.A. He attributes the move to expectations of tighter policy and a firm dollar.
The geopolitical bid also faded. Progress in US-Iran talks pulled oil back to a four-month low, removing the war premium that had supported bullion and easing the inflation concern that kept the Fed hawkish. Gold failed to rally during the conflict and is now selling off on its resolution, an unusual sequence that underlines how much the rate channel dominates this tape.
The drivers behind the break below $4,000:
- Fed repricing: September hike odds near 68%, up from 29% a week earlier
- Dollar strength: DXY at a one-year-plus high, raising the cost of gold abroad
- Iran de-escalation: oil at a four-month low, war premium drained
- Real yields: higher carry cost on non-yielding bullion
Institutional Flows and the Rate-Hike Repricing
Attention turns to Thursday's PCE report, which Kooijman expects could prove decisive for the Fed's next move. A hotter reading would reinforce the hike case and pressure gold further, while a soft print could spark a technical bounce into the $4,000 retest. The longer-term bid has not vanished.
Central banks bought 244 net tonnes in the first quarter of 2026, and Kooijman noted that "ongoing central bank purchases support the longer-term outlook for gold." My read is that this official-sector demand limits the depth of the correction over time but has not stopped the rate-driven leg lower.
How Low Can Gold Go? XAU/USD Price Predictions
The institutional range remains wide, and most desks still sit above spot even after trimming targets. Deutsche Bank cut its year-end call to $4,800 from $6,000, a downgrade that still implies a bounce of about 20% from current levels.
Brandon Aversano, founder of Alloy, called the "$4,800 year-end target" reasonable, adding that he does not expect a straight line and sees gold capable of revisiting $5,000 before year-end if geopolitical risk and central-bank buying re-accelerate. My view is that this is the credible upper path, but it needs a catalyst my chart does not show today.
Goldman Sachs still targets $4,900 and the Reuters poll median sits at $4,746, both above spot. My read is that these figures have trailed the 2026 reversal all year and assume a Fed pivot that has not arrived.
The extreme upside belongs to Wells Fargo at $6,100 to $6,300 and JPMorgan at $6,000, both of which I covered when UBP rebuilt its bullion book at $6,000. I track those as ceilings, not near-term paths.
Source | Target | Notes |
Deutsche Bank | $4,800 (Q4 2026) | Cut from $6,000; still ~20% above spot |
Deutsche Bank (bear) | ~$3,800 | If Fed delivers 3 to 4 hikes |
Goldman Sachs | $4,900 | Central-bank buying thesis |
Reuters poll median | $4,746 | 30 analysts, above spot |
JPMorgan | $6,000 | Year-end, structural call |
Wells Fargo | $6,100 to $6,300 | Retained March target |
My technical analysis | $3,440 | 100% Fibonacci extension, downside |
Deutsche Bank's own bear scenario near $3,800 is the closest mainstream forecast to my $3,440 target, and it triggers on the same input I am watching, three to four Fed hikes.
FAQ, Gold Price Analysis
Why is gold falling below $4,000?
Gold lost the $4,000 level because the Federal Reserve signaled a hawkish hold and markets moved to price roughly 68% odds of a September rate hike. That lifted real yields and pushed the dollar to a one-year high. US-Iran de-escalation also drained the war premium, sending oil to a four-month low and removing a key support for bullion.
How low can gold go in 2026?
My Fibonacci extension off the 2025 advance targets $3,440, the 100% level, roughly 15% below the current $3,976 price and about 39% under the January record of $5,595. That objective stays in play while gold trades below $4,000. A daily close back above the 200 EMA near $4,300 would neutralize the bearish setup.
Is the $4,000 level still support for gold?
No. Wednesday's close at $3,991 was the first below $4,000 since November 2025, and on my chart the level has flipped from support to resistance. Gold is now retesting it from below, a polarity change that strengthens the bearish case unless price reclaims $4,000 on a daily closing basis.
What is a death cross and is gold forming one?
A death cross forms when the 50-day moving average falls below the 200-day, a signal traders read as a shift to a bearish medium-term trend. Gold's 50-day and 200-day lines are converging now and sit closer than they did on June 22. The cross is not confirmed yet, but the gap continues to narrow.


