

Gold traded at $4,105 per ounce on Thursday, June 11, 2026, up 0.86% on the day but down close to 5% from its early-June high after sliding to $4,023.95 in intraday trade, the lowest level since November 2025.
The drop confirms the breakdown I flagged earlier this week, when gold lost its 200 EMA near $4,300 and I set a downside target roughly 20% lower. May inflation data and stubbornly high real yields are the immediate catalysts.
In this article I am answering why gold price is falling and how low gold may go in the second part of 2026.
Follow me on X for real-time market analysis: @ChmielDk.
Why Is Gold Falling Today?
The May Consumer Price Index did the damage. Headline inflation rose 0.5% month over month and 4.2% year over year, in line with expectations, while core inflation rose 0.2% and 2.9% year over year, slightly below some forecasts.
The print kept the Federal Reserve's rate-cut path on hold and lifted real Treasury yields, the single biggest headwind for a non-yielding asset.
- Why Is Gold Going Down? Gold Price Falls Below 200 EMA And This XAU/USD Forecasts Shows -20% Target
- Gold Price Falls to $4,400 in 2nd 200 EMA Test of 2026
- Why Is Gold Surging Today? XAU/USD Price Tests Monthly Highs as Wells Fargo Predicts +$6K per Ounce
Gold briefly recovered after the data, then turned lower into the close. "Selling pressure re-emerged later in the session, reflecting a shift in investor sentiment," said Antonio Di Giacomo, Senior Market Analyst at XS.com. The dollar firmed alongside yields and compounded the move.
The backdrop has been dollar-positive since oil pushed above $112 a barrel, feeding inflation and forcing the Fed to stay restrictive. That dynamic, not a collapse in gold's structural case, is driving the correction, as I detailed in my analysis of the metal's slide alongside silver.
Key drivers behind the sell-off:
- May CPI at 4.2% year over year, keeping Fed cuts on hold
- Real Treasury yields rising, raising the cost of holding bullion
- A firmer dollar after oil above $112 sustained inflation pressure
My Gold Technical Analysis
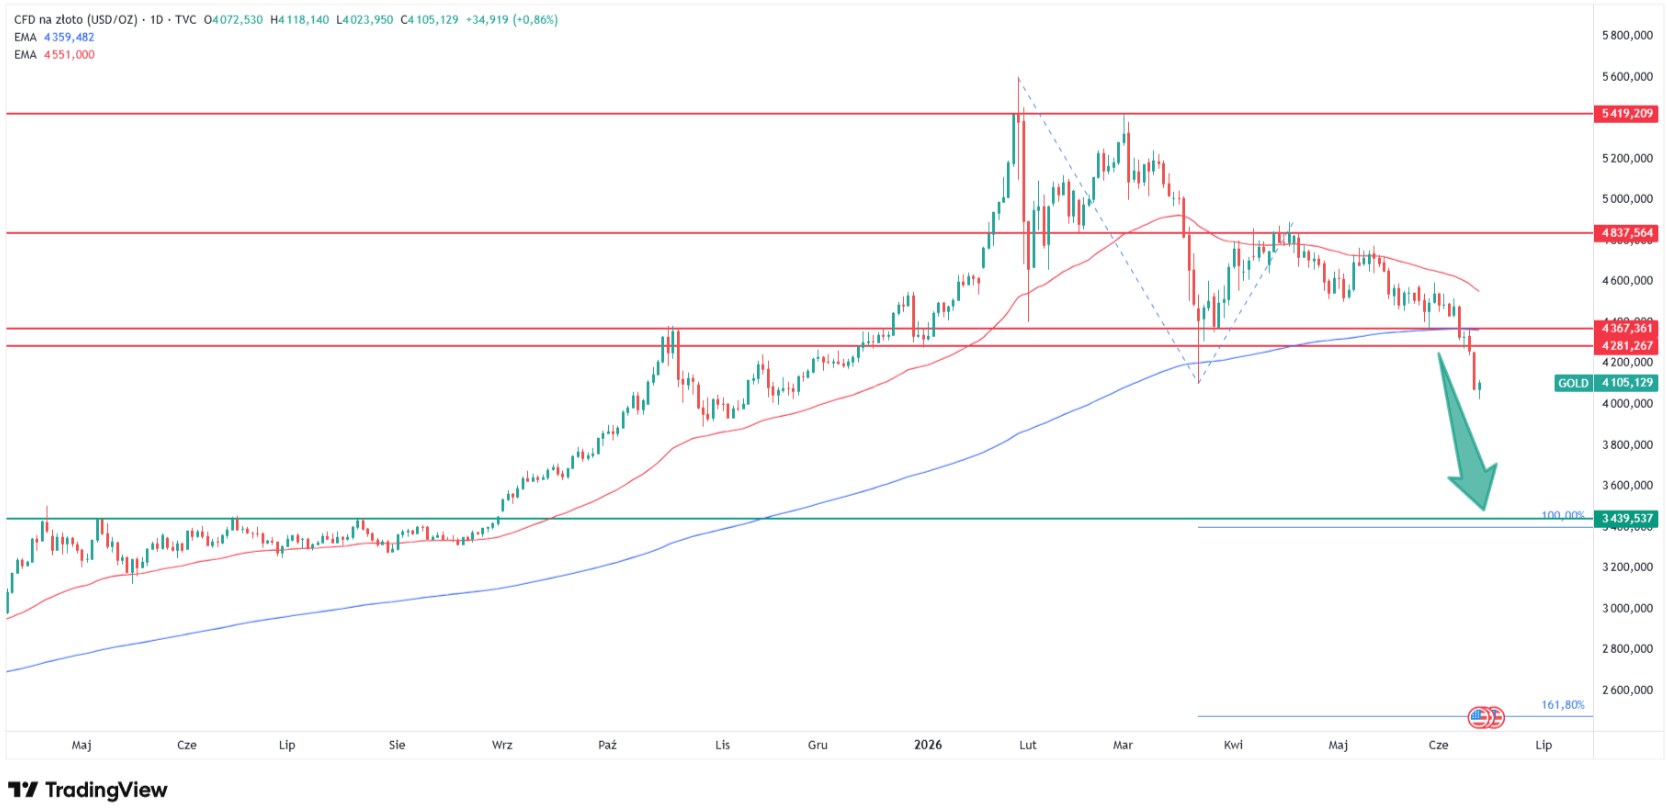
My chart shows the support zone that defined gold since October 2025 has broken. The band between $4,281 and $4,367, built by the 200 EMA, the October 2025 peaks, and the late-2025 lows, gave way this week. Price is now back-testing those former lows from below, a textbook bearish retest rather than a recovery.
In 15-plus years charting metals and FX, I have rarely seen a zone this well-defended fail in a single week. You can follow my prior gold calls on my analyst page. The next reference below spot is the $4,000 psychological level, then my primary downside target.
That target is $3,440, the 100% Fibonacci extension of the 2025 advance, which lines up with the April, June, and July 2025 peaks. It sits about 20% below where the 200 EMA broke. The same $3,440 to $3,450 area is the structural floor I flagged in my Goldman Sachs gold analysis.
Level | Type | Notes |
$4,837 | Resistance | Former support, upper EMA region |
$4,281 to $4,367 | Resistance | Broken support zone, 200 EMA and October 2025 highs |
$4,023 | Support | June 11 low, lowest since November 2025 |
$4,000 | Support | Psychological |
$3,440 | Target | 100% Fibonacci extension, 2025 peaks |
How Low Can Gold Go?
My base case stays bearish while price holds below the broken $4,281 zone. A daily close back above $4,367 would neutralize the setup and put $4,837 back in play. Absent that reclaim, the path of least resistance points lower toward $4,000 and then $3,440.
The signal to watch is the retest: each rejection at $4,281 from below strengthens the case for the next leg down.
The $3,440 target also frames the wider correction. From the $5,589 record set on January 28, that level marks a drop of almost 40%, a deep but not unprecedented unwind after a rally of this scale. My nearer-term 20% figure measures only from this week's broken support, so the two numbers describe the same path at different starting points.
The bull case has not vanished. Central banks bought 244 net tonnes in the first quarter of 2026, and every major institutional year-end target still sits well above spot. A dovish Fed pivot or a fresh geopolitical shock could trigger a rapid short-covering rally back into the broken zone.
For now, the bear case dominates the chart:
- 200 EMA and October 2025 support broken on a weekly basis
- Price retesting yearly lows from below, not reclaiming them
- $4,000 the last defense before the $3,440 Fibonacci target
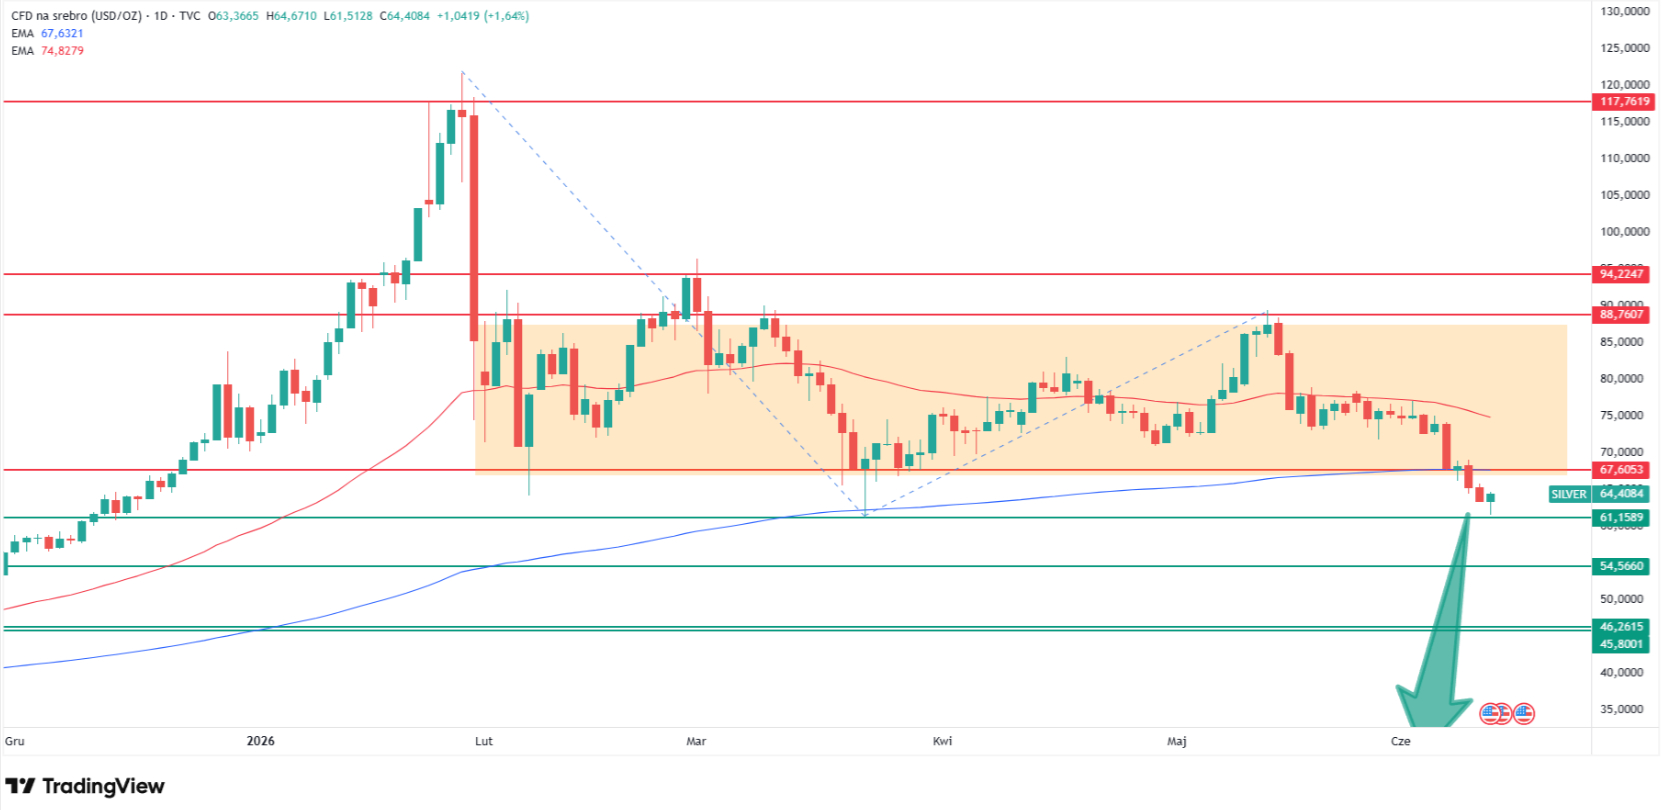
Silver Confirms the Risk-Off Tone
Silver is sending the same signal. The metal traded at $64.41 per ounce on Thursday, up 1.64% on the day but down to an intraday low of $61.51, the lowest since March. It has broken the $67.60 support and the 200 EMA that capped a multi-month consolidation between $67.60 and $88.76.
A confirmed exit from that range opens the door to the $54.57 support and, on an extended breakdown, the April 2025 lows near $30, as I argued in my silver breakdown analysis. Both metals now trade below their 200 EMAs, and both are retesting prior support from the wrong side.
The metals slide also reshapes the brokerage side. Gold contracts already make up the bulk of metals CFD volume, and liquidity has held up even as gold dominates broker flow.
The sharper risk now sits on balance sheets, where volatile gold has shifted brokers' exposure from P&L toward capital protection, a dynamic that intensifies when one-directional moves like this week's accelerate.
FAQ, Gold Price Analysis
Why is gold falling right now?
Gold is falling because May CPI came in at 4.2% year over year, keeping the Federal Reserve restrictive and lifting real Treasury yields. Higher yields raise the cost of holding a non-yielding asset, while a firmer dollar after oil above $112 adds pressure. On the chart, the metal also broke its 200 EMA, triggering technical selling.
How low can gold go in 2026?
My primary target is $3,440, the 100% Fibonacci extension of the 2025 advance, which aligns with the April, June, and July 2025 peaks. That sits about 20% below the broken 200 EMA near $4,300. The $4,000 psychological level is the first checkpoint on the way down and the last defense before $3,440.
What is the 200 EMA and why does it matter for gold?
The 200 EMA is the 200-period exponential moving average, a widely tracked trend gauge that weights recent prices more heavily than a simple average. Gold held above it through the 2025 rally. Losing it near $4,300 this week flipped the medium-term trend bearish and turned former support into resistance.
Is the gold bull market over?
Not necessarily. Central banks bought 244 net tonnes in the first quarter of 2026, and institutional year-end targets still sit above spot. The current move looks like a deep correction inside a longer cycle rather than a structural reversal. A close back above $4,367 would reopen the upside toward $4,837.
What happens if gold breaks $4,000?
A daily close below $4,000 would confirm the breakdown and remove the last psychological support before my $3,440 target. It would also pressure silver, which has already broken its own consolidation. A failure to hold $4,000 likely accelerates selling toward the 2025 peak cluster around $3,440.


