
XRP Price Breaks Its Year-Long Trend Line, but $1.18 Decides the Next Move

Wednesday, 15/07/2026 | 13:52 GMT by Damian Chmiel
  • XRP traded at $1.10 on Wednesday, July 15, 2026, up 2.7% on the day, still stuck in its lowest price zone since November 2024 on the chart.
  • My chart shows XRP broke its descending trend line from July 2025, but the $1.12 to $1.18 supply band is now the harder wall to clear.
  • Standard Chartered keeps an $8 XRP target, though it hinges on the CLARITY Act passing the full Senate and $10 billion in ETF inflows.
Two xrp tokens standing in the front of candle chart
What is the current XRP price today? Let's check the technical analysis and the price predictions

XRP (XRP) broke the descending trend line it had respected for almost a year, and for once my daily chart hands the bulls something to work with. The token traded at $1.10 on Wednesday, July 15, 2026, up about 2.7% on the session, yet still inside the lowest price zone since November 2024. This XRP price prediction starts from that single structural crack and the wall sitting directly above it.

A week ago my monthly read told the opposite story. June closed below the 50-month exponential moving average for the first time in three years, and I mapped a staged path lower. The daily chart is now sending a different, smaller signal, and the gap between the two timeframes is the entire trade.

Follow me on X for real-time XRP market analysis: @ChmielDk

The July 2025 Trend Line Finally Gave Way

The descending line I have tracked since July 19, 2025 is broken. That is the day XRP traded above $3.50, close to its cycle high of $3.65, before a correction erased roughly two-thirds of the price, as I traced in my March analysis of the $2.50 and $0.53 scenarios. My chart shows the line rejecting every rally that followed: October 2025, January, May, and again in June. In early July, price closed through it for the first time.
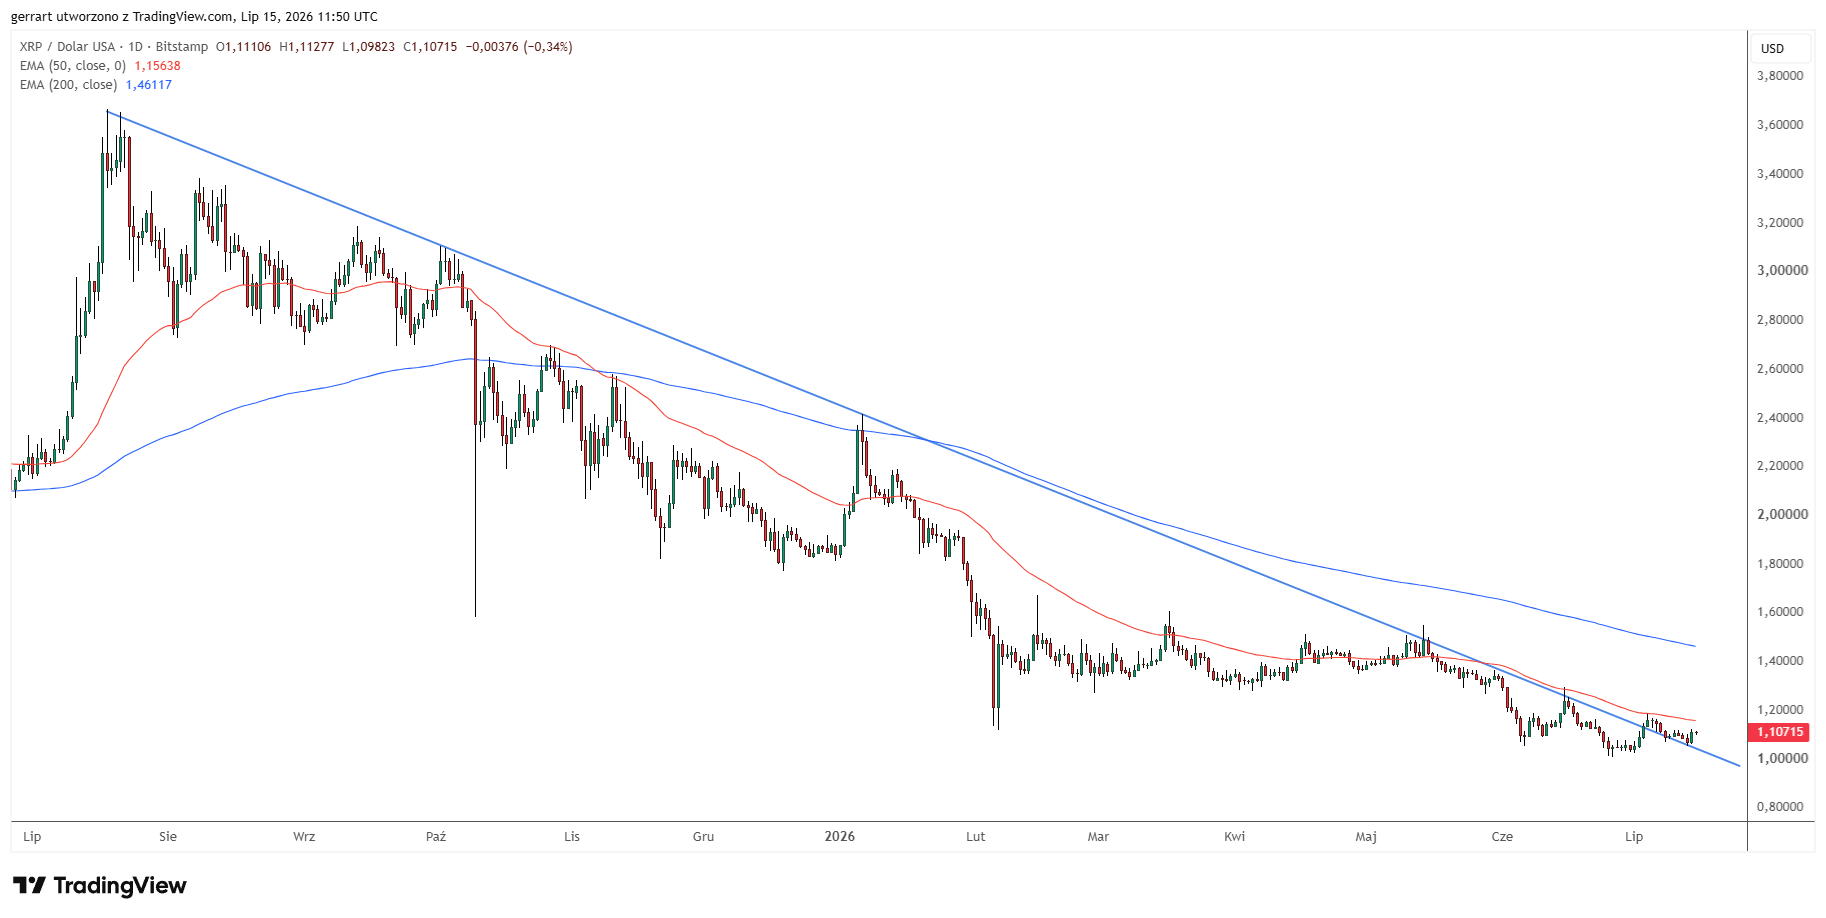
Where can XRP price go after the trend line break? Source: Tradingview.com

The break matters because long structures rarely snap without repositioning behind them. Violating a line that held for twelve months can shake loose accumulated buy and sell orders and force a repricing of risk. That is the theoretical case, and it is why I am no longer treating this purely as another leg in the bear trend I described in my previous XRP analysis of the 50-month EMA break.

What has not changed is the horizontal picture. The 50-day EMA that capped every bounce in 2026 still sits just overhead, and price remains pinned to the floor of the range that has defined the token since late 2024. A broken diagonal is a start. It is not a reversal.

Why $1.18 Matters More Than the Break

The harder wall is only a few cents away. XRP is pressing straight into the supply left by the February 2026 lows, a band that runs roughly from $1.12 to $1.18, about six cents wide. A decade covering XRP at FinanceMagnates.com, documented on my analyst page, has taught me one rule for setups like this: a diagonal break is only as good as the first horizontal level that follows it.

That is the level I am watching, not the trend line. A daily close above $1.18 would clear the February shelf and put the 50-day EMA and the $1.26 area next in line. Fail there, and the break stays a technicality inside a market still printing lower lows.

The downside line is $1.00. A daily close below parity would reopen the staged targets I set out last week, with $0.67 and $0.47 the next Fibonacci-based stops beneath it. As I detailed in my January analysis that first drew this July 2025 downtrend, momentum tends to accelerate once round-number support cracks.

The Catalyst the Bulls Are Really Watching

The technical crack landed the same week two widely followed accounts turned loud on XRP.

On July 14, @MikybullCrypto told 22,000 viewers that "what is coming for XRP will be massive," pointing to the pattern building on the chart. My view: that optimism needs a daily close above $1.18 before it earns the language, because inside the current range the same setup has failed more than once.

The second thread is regulatory. @Xfinancebull framed the CLARITY Act as "the rulebook institutions have been waiting for," arguing Washington's momentum is turning bullish for XRP and other utility tokens.

The read runs ahead of the calendar. The bill passed the House in July 2025 and cleared the Senate Banking Committee 15-9 on May 14, but it has sat on the Senate calendar since June 1 with no floor vote, as the FinanceMagnates.com CLARITY Act explainer laid out.

The hold-up is not support, it is arithmetic and ethics. Republicans need roughly seven Democrats to clear the 60-vote threshold, and President Trump's $1.4 billion crypto income disclosure on July 1 hardened Democratic demands for conflict-of-interest language. Banking groups are still fighting the stablecoin reward rules, as FinanceMagnates.com reported this week, and the realistic window is the handful of sessions before the August 7 recess, with 2026 passage odds near a coin flip. For XRP, CLARITY is a catalyst in waiting, not a delivered one.

XRP Price Prediction: What the Levels Say Next

My base case stays cautious until the chart proves otherwise. The trend-line break earns XRP a shot at $1.18, and only a close above it flips the near-term bias. Below $1.00, the structure I described last week takes over again.

Level

Price

What it means

Resistance

$1.12 to $1.18

February 2026 supply, the immediate test

Resistance

$1.26

Range floor lost in June, first real bull confirmation

Support

$1.00

Parity, the line of last defense

Bear target

$0.67, then $0.47

Fibonacci stops if $1.00 gives way

The institutional forecasts have not moved with the tape. Standard Chartered's Geoffrey Kendrick still carries an $8 target for XRP, but it is explicitly conditional on the CLARITY Act passing and ETF inflows reaching $10 billion. My view: with price under $1.18 and neither condition met, $8 belongs to 2027, not a 2026 base case. Mid-range forecasts near $2.25 to $2.50 still require XRP to reclaim the entire 2026 range first, which is why I treat the $1.18 break as the only number that matters this week.

FAQ: XRP Price Prediction

Why is XRP breaking its trend line now?

The descending line from July 19, 2025 had rejected XRP four times, but early July saw the first daily close above it. The break followed a month in which XRP lost the 50-month EMA, leaving the token oversold and stretched. A diagonal that holds that long often snaps once sellers thin out, which is what the chart now shows.

How high can XRP go if $1.18 breaks?

A daily close above $1.18 clears the February 2026 supply band and exposes the 50-day EMA, then the $1.26 shelf lost in June. Reclaiming $1.26 would be the first genuine bullish signal in months. Beyond it, the $1.51 to $1.57 ceiling that capped every 2026 rally remains the harder structural target for any sustained recovery.

Where is support if XRP loses $1.00?

Parity at $1.00 is the line of last defense. A daily close below it reopens the staged downside I mapped last week, starting at $0.67 and $0.47, both drawn from Fibonacci extensions of the 2025 decline. Those levels only activate on broad crypto weakness, but round-number breaks tend to accelerate, so $1.00 is the level that defines the bear case.

Does the CLARITY Act change the XRP price prediction?

It could, but not yet. The bill would codify XRP's digital-commodity status into federal law, removing regulatory risk that has shadowed the token since 2020. It has cleared the Senate Banking Committee but still needs a full floor vote, roughly seven Democratic votes, and a signature. Until it passes, my analysis stays anchored to the chart rather than the headline.

Is XRP still in a long-term downtrend?

Yes. The monthly close below the 50-month EMA and the loss of the $1.26 shelf keep the higher-timeframe trend bearish. The daily trend-line break is a smaller, tactical signal that sits inside that larger structure. One resolves the other only if XRP reclaims $1.26 on the monthly chart, which has not happened.

XRP (XRP) broke the descending trend line it had respected for almost a year, and for once my daily chart hands the bulls something to work with. The token traded at $1.10 on Wednesday, July 15, 2026, up about 2.7% on the session, yet still inside the lowest price zone since November 2024. This XRP price prediction starts from that single structural crack and the wall sitting directly above it.

A week ago my monthly read told the opposite story. June closed below the 50-month exponential moving average for the first time in three years, and I mapped a staged path lower. The daily chart is now sending a different, smaller signal, and the gap between the two timeframes is the entire trade.

Follow me on X for real-time XRP market analysis: @ChmielDk

The July 2025 Trend Line Finally Gave Way

The descending line I have tracked since July 19, 2025 is broken. That is the day XRP traded above $3.50, close to its cycle high of $3.65, before a correction erased roughly two-thirds of the price, as I traced in my March analysis of the $2.50 and $0.53 scenarios. My chart shows the line rejecting every rally that followed: October 2025, January, May, and again in June. In early July, price closed through it for the first time.

Where can XRP price go after the trend line break? Source: Tradingview.com

The break matters because long structures rarely snap without repositioning behind them. Violating a line that held for twelve months can shake loose accumulated buy and sell orders and force a repricing of risk. That is the theoretical case, and it is why I am no longer treating this purely as another leg in the bear trend I described in my previous XRP analysis of the 50-month EMA break.

What has not changed is the horizontal picture. The 50-day EMA that capped every bounce in 2026 still sits just overhead, and price remains pinned to the floor of the range that has defined the token since late 2024. A broken diagonal is a start. It is not a reversal.

Why $1.18 Matters More Than the Break

The harder wall is only a few cents away. XRP is pressing straight into the supply left by the February 2026 lows, a band that runs roughly from $1.12 to $1.18, about six cents wide. A decade covering XRP at FinanceMagnates.com, documented on my analyst page, has taught me one rule for setups like this: a diagonal break is only as good as the first horizontal level that follows it.

That is the level I am watching, not the trend line. A daily close above $1.18 would clear the February shelf and put the 50-day EMA and the $1.26 area next in line. Fail there, and the break stays a technicality inside a market still printing lower lows.

The downside line is $1.00. A daily close below parity would reopen the staged targets I set out last week, with $0.67 and $0.47 the next Fibonacci-based stops beneath it. As I detailed in my January analysis that first drew this July 2025 downtrend, momentum tends to accelerate once round-number support cracks.

The Catalyst the Bulls Are Really Watching

The technical crack landed the same week two widely followed accounts turned loud on XRP.

On July 14, @MikybullCrypto told 22,000 viewers that "what is coming for XRP will be massive," pointing to the pattern building on the chart. My view: that optimism needs a daily close above $1.18 before it earns the language, because inside the current range the same setup has failed more than once.

The second thread is regulatory. @Xfinancebull framed the CLARITY Act as "the rulebook institutions have been waiting for," arguing Washington's momentum is turning bullish for XRP and other utility tokens.

The read runs ahead of the calendar. The bill passed the House in July 2025 and cleared the Senate Banking Committee 15-9 on May 14, but it has sat on the Senate calendar since June 1 with no floor vote, as the FinanceMagnates.com CLARITY Act explainer laid out.

The hold-up is not support, it is arithmetic and ethics. Republicans need roughly seven Democrats to clear the 60-vote threshold, and President Trump's $1.4 billion crypto income disclosure on July 1 hardened Democratic demands for conflict-of-interest language. Banking groups are still fighting the stablecoin reward rules, as FinanceMagnates.com reported this week, and the realistic window is the handful of sessions before the August 7 recess, with 2026 passage odds near a coin flip. For XRP, CLARITY is a catalyst in waiting, not a delivered one.

XRP Price Prediction: What the Levels Say Next

My base case stays cautious until the chart proves otherwise. The trend-line break earns XRP a shot at $1.18, and only a close above it flips the near-term bias. Below $1.00, the structure I described last week takes over again.

Level

Price

What it means

Resistance

$1.12 to $1.18

February 2026 supply, the immediate test

Resistance

$1.26

Range floor lost in June, first real bull confirmation

Support

$1.00

Parity, the line of last defense

Bear target

$0.67, then $0.47

Fibonacci stops if $1.00 gives way

The institutional forecasts have not moved with the tape. Standard Chartered's Geoffrey Kendrick still carries an $8 target for XRP, but it is explicitly conditional on the CLARITY Act passing and ETF inflows reaching $10 billion. My view: with price under $1.18 and neither condition met, $8 belongs to 2027, not a 2026 base case. Mid-range forecasts near $2.25 to $2.50 still require XRP to reclaim the entire 2026 range first, which is why I treat the $1.18 break as the only number that matters this week.

FAQ: XRP Price Prediction

Why is XRP breaking its trend line now?

The descending line from July 19, 2025 had rejected XRP four times, but early July saw the first daily close above it. The break followed a month in which XRP lost the 50-month EMA, leaving the token oversold and stretched. A diagonal that holds that long often snaps once sellers thin out, which is what the chart now shows.

How high can XRP go if $1.18 breaks?

A daily close above $1.18 clears the February 2026 supply band and exposes the 50-day EMA, then the $1.26 shelf lost in June. Reclaiming $1.26 would be the first genuine bullish signal in months. Beyond it, the $1.51 to $1.57 ceiling that capped every 2026 rally remains the harder structural target for any sustained recovery.

Where is support if XRP loses $1.00?

Parity at $1.00 is the line of last defense. A daily close below it reopens the staged downside I mapped last week, starting at $0.67 and $0.47, both drawn from Fibonacci extensions of the 2025 decline. Those levels only activate on broad crypto weakness, but round-number breaks tend to accelerate, so $1.00 is the level that defines the bear case.

Does the CLARITY Act change the XRP price prediction?

It could, but not yet. The bill would codify XRP's digital-commodity status into federal law, removing regulatory risk that has shadowed the token since 2020. It has cleared the Senate Banking Committee but still needs a full floor vote, roughly seven Democratic votes, and a signature. Until it passes, my analysis stays anchored to the chart rather than the headline.

Is XRP still in a long-term downtrend?

Yes. The monthly close below the 50-month EMA and the loss of the $1.26 shelf keep the higher-timeframe trend bearish. The daily trend-line break is a smaller, tactical signal that sits inside that larger structure. One resolves the other only if XRP reclaims $1.26 on the monthly chart, which has not happened.

About the Author: Damian Chmiel
Damian Chmiel
  • 3741 Articles
  • 115 Followers
About the Author: Damian Chmiel
Damian Chmiel is a Senior Analyst & Editor at Finance Magnates with more than 15 years of experience in the CFD and online trading industry. Active as both a trader and journalist since 2010, he focuses on broker coverage, fintech innovation, and regulatory developments across Europe, the Middle East, and Asia. His work includes interviews with C-level leaders at major brokerages and fintech platforms, as well as co-authoring Finance Magnates’ quarterly industry benchmarking reports. Damian’s reporting is data-driven, market-aware, and grounded in direct industry engagement. His analysis and commentary have also been cited by external media outlets, including Investing.com, Binance, The Asset, Stockhead, and Dispatch. Education: MA in Finance and Accounting, Cracow University of Economics
  • 3741 Articles
  • 115 Followers

More from the Author

Trending

!"#$%&'()*+,-./0123456789:;<=>?@ABCDEFGHIJKLMNOPQRSTUVWXYZ[\]^_`abcdefghijklmnopqrstuvwxyz{|} !"#$%&'()*+,-./0123456789:;<=>?@ABCDEFGHIJKLMNOPQRSTUVWXYZ[\]^_`abcdefghijklmnopqrstuvwxyz{|}