


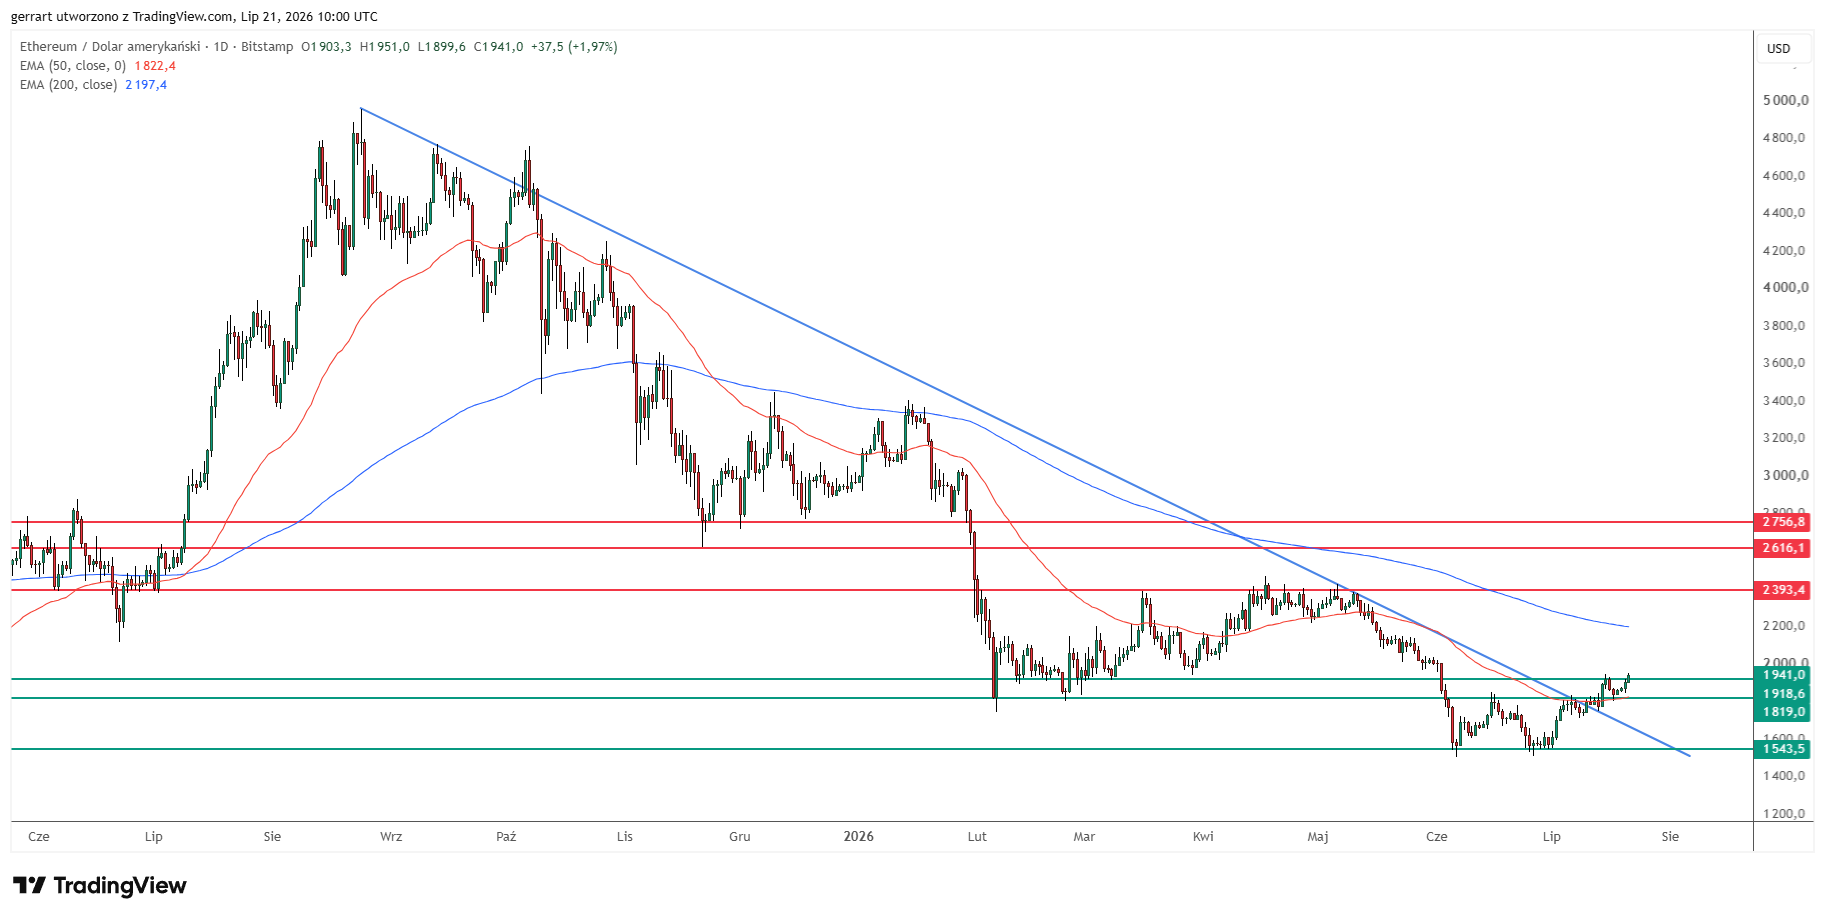
Tuesday's session is doing what last week's could not: putting bitcoin's chip-driven rebound to work across the rest of crypto. Ethereum (ETH) is trading at $1,932 on Tuesday, July 21, 2026, up nearly 2% on the day after intraday prints on Bitstamp touched $1,951, the richest level since June 2, roughly a month and a half ago. The move confirms a break of the downtrend line drawn from last August's peak, and my chart reads it as the first real shot at $2,000 since spring.
Follow me on X for real-time Ethereum market analysis: @ChmielDk
Ethereum Breaks a Trendline That Held for Almost a Year
My daily chart shows Ethereum clearing the descending trendline that has capped every rally attempt since the August 2025 peak, a structural shift after eleven months of lower highs. The break coincides with a bounce off the 50-day EMA and a clean move above the $1,819 to $1,838 band, the February to March consolidation shelf that had acted as resistance since spring.
In 15 years covering crypto markets, the last ten of them at FinanceMagnates.com, on my analyst page, I have watched Ethereum fail at this exact trendline three times since August. Tuesday's close is the first that has actually stuck, and it changes how I read the next few weeks.
- Ethereum Tracks Bitcoin as ETH Price Prediction Signals Further 60% Drop to April Lows
- Ethereum Inches Toward 2021 High as Tokenized Stocks and ETFs Outpace Bitcoin Inflows
- New Ethereum Price Prediction Targets $17K by 2026. Could ETH Gain as Much as 350%?
If ETH holds above $1,838, the path opens toward the $2,000 handle and the 200-day EMA near $2,200. Beyond that, the March to May highs at $2,400 form the next technical ceiling, followed by the wider $2,600 to $2,756 shelf marked by last year's year-end lows. On the downside, $1,540 is the level to watch, the June to July floor that lines up with the lowest prints since April 2025. My reading gives Ethereum little reason to revisit that zone while the breakout holds, and the measured move off the current base points to as much as 40% upside from here.
Bitcoin's Chip Rebound Is Doing the Heavy Lifting
Tuesday's move in Ethereum is riding a broader risk wave rather than trading on its own news. Bitcoin (BTC) touched a two-week high near $65,500 as Asian semiconductor shares reversed last week's slide, with Taiwan Semiconductor and Samsung leading a 2% bounce in the MSCI Asia Pacific gauge. Oil eased at the same time, with Brent slipping toward $88.58 as Iran signaled openness to a 10-day pause in regional strikes.
Sean Farrell, digital asset strategist at Fundstrat, framed the shift this way: "ETH increasingly stands out as one of the more attractive ways to express that view," pointing to a broader improvement in crypto's tactical backdrop. Farrell's team has flagged Ethereum's tendency to lead Bitcoin out of past drawdowns, a pattern that played out in 2022 and appears to be forming again this month.
The Federal Reserve's July 28 to 29 meeting is the event that could cap or extend the rally. Markets currently price only about a 15% chance of a July hike, but a September move stays live, and a fresh spike in yields or oil could just as quickly turn this bounce defensive. Spot volume across the broader crypto market has stayed thin even as prices climb, a sign this is a tape being lifted by returning risk appetite rather than fresh conviction. That gap between price and volume is worth watching heading into next week's Fed decision.
Institutional Flows
U.S. spot Ethereum ETFs have now logged five straight days of inflows totaling more than $600 million, the strongest run since an eight-week outflow streak broke in early July, as Citi's cut to its own Ethereum call, detailed in my prior analysis, missed the reversal now underway. BitMine Immersion Technologies, chaired by Fundstrat's Tom Lee, expanded its ETH treasury to 5.78 million tokens this week and repurchased 5.5 million shares under its $4 billion buyback program. That accumulation, edging toward the firm's stated 5% supply target, gives the ETF inflow trend a corporate demand floor underneath it.
The ETH/BTC ratio has firmed alongside the move, with ether gaining roughly 8% over the past week against bitcoin's 5%. Standard Chartered has flagged that kind of divergence as an early sign of the rotation it expects to build through the rest of 2026.
Ethereum Price Prediction: How High Can This Rally Go?
Standard Chartered's Geoffrey Kendrick remains the most bullish major desk on Ethereum, holding a $7,500 year-end 2026 target built on ETH's dominance in stablecoins and tokenized real-world assets. "I think 2026 will be the year of Ethereum, much like 2021 was," Kendrick said, comparing the current setup to the year ETH last outperformed Bitcoin by a wide margin.
Citi sits at the other end of the institutional range. As I detailed when Ethereum fell to $2,000 in February, the bank cut its Ethereum target to $2,240 from $3,175 on July 1, citing stalled US crypto legislation and zero expected ETF inflows, a call the past three weeks of inflows have already started to undercut.
| Forecaster | 2026 Target | My Take |
|---|---|---|
| Standard Chartered | $7,500 | Directionally right on adoption, but my chart only supports $2,200 to $2,400 near term |
| Citi | $2,240 | Already stale after the trendline break and five days of ETF inflows |
| My technical read | $2,200 to $2,400 | Confirmed by Tuesday's close above $1,838, contingent on holding that level on a retest |
My own targets stay closer to the chart than to either institutional call: $2,200 first, then $2,400 if the 200 EMA gives way, with $1,838 as the level that needs to hold for either scenario to stay on the table. Readers who followed my Bitcoin bear flag analysis in June will recognize the same discipline applied here in reverse: a level either holds or it does not, regardless of which target sounds better in a headline.
FAQ, Ethereum Price Analysis
Why is Ethereum price going up on Tuesday, July 21, 2026?
Ethereum is rising alongside a broader crypto rebound, as Asian semiconductor stocks reversed course and Bitcoin touched a two-week high near $65,500. ETH also broke a technical downtrend line in place since August 2025, adding a chart-based catalyst on top of the macro tailwind. Five straight days of spot ETF inflows have reinforced the move into Tuesday's session.
What price levels confirm Ethereum's breakout above its downtrend line?
The break is confirmed by Tuesday's close above the $1,819 to $1,838 resistance band, the February to March consolidation shelf, alongside a bounce off the 50-day EMA. A daily close back below $1,819 would undo the signal. Holding above it opens the path toward $2,000 and the 200-day EMA near $2,200.
How high can Ethereum go in 2026 according to Wall Street forecasts?
Standard Chartered projects $7,500 by year-end 2026, citing Ethereum's dominance in stablecoins and tokenized real-world assets, while Citi's more conservative call sits at $2,240 after a July 1 downgrade. My own technical targets are closer to the low end, at $2,200 to $2,400, based on the resistance sitting directly above current price.
What happens if Ethereum fails to hold $1,819?
A daily close back below $1,819 would invalidate Tuesday's breakout and put the $1,540 June to July lows back in focus, a level that lines up with the lowest prints since April 2025. Losing $1,540 would open a retest of the broader base built earlier this year, though nothing in current flows points that way yet.
Why does BitMine's ETH treasury matter for the price of Ethereum?
BitMine has built a 5.78 million ETH treasury, roughly 5% of circulating supply, funded partly through its $4 billion buyback program. That scale of corporate accumulation removes tokens from circulating supply and gives spot ETF demand a floor, reinforcing rather than replacing the technical and macro signals driving Tuesday's move.


