
Bitcoin traded near $62,790 on Monday, August 3, slipping 1.23% and testing local support at $62,745.
BTC remains trapped between roughly $58,100 and $67,000, but a descending trendline and the 50-day EMA continue to cap every recovery attempt.
A confirmed break below $58,100 would expose $53,181 and $49,000, implying as much as 22% downside from the current price.
Bitcoin (BTC) slipped back below $63,000 during Monday’s session, trading near $62,790 at 10:03 UTC on August 3 after falling just over 1%.
The decline itself is not a breakout. In fact, very little has changed on the Bitcoin chart during the summer. After the sharp selloff spanning late May and June, BTC has spent weeks rotating inside the same broad consolidation range.
The lower boundary sits near $58,100, while resistance remains concentrated around $67,000. Bitcoin is now testing an intermediate support shelf at $62,745, with the psychologically important $60,000 level immediately below it.
What makes the current setup worth watching is not Monday’s modest decline. It is the way horizontal support, a descending trendline and two moving averages are gradually compressing the price. This range cannot narrow indefinitely.
Bitcoin’s Summer Range Is Compressing Between $58K and $67K
The same line capped the recovery in May and has been tested again since late July. Buyers have so far failed to break it.
Bitcoin also remains below its 50-day exponential moving average, currently near $64,638. The average has turned into dynamic resistance and overlaps with the descending trendline, creating a narrow supply zone above the current market price.
The longer-term picture remains weaker. The 200-day EMA is still far above spot at approximately $72,774. With both moving averages above the price, the prevailing trend remains bearish despite the sideways movement recorded since June.
Monday’s price action is testing the local $62,745 shelf. Below it, the next defenses are located around $60,000 and $58,097.
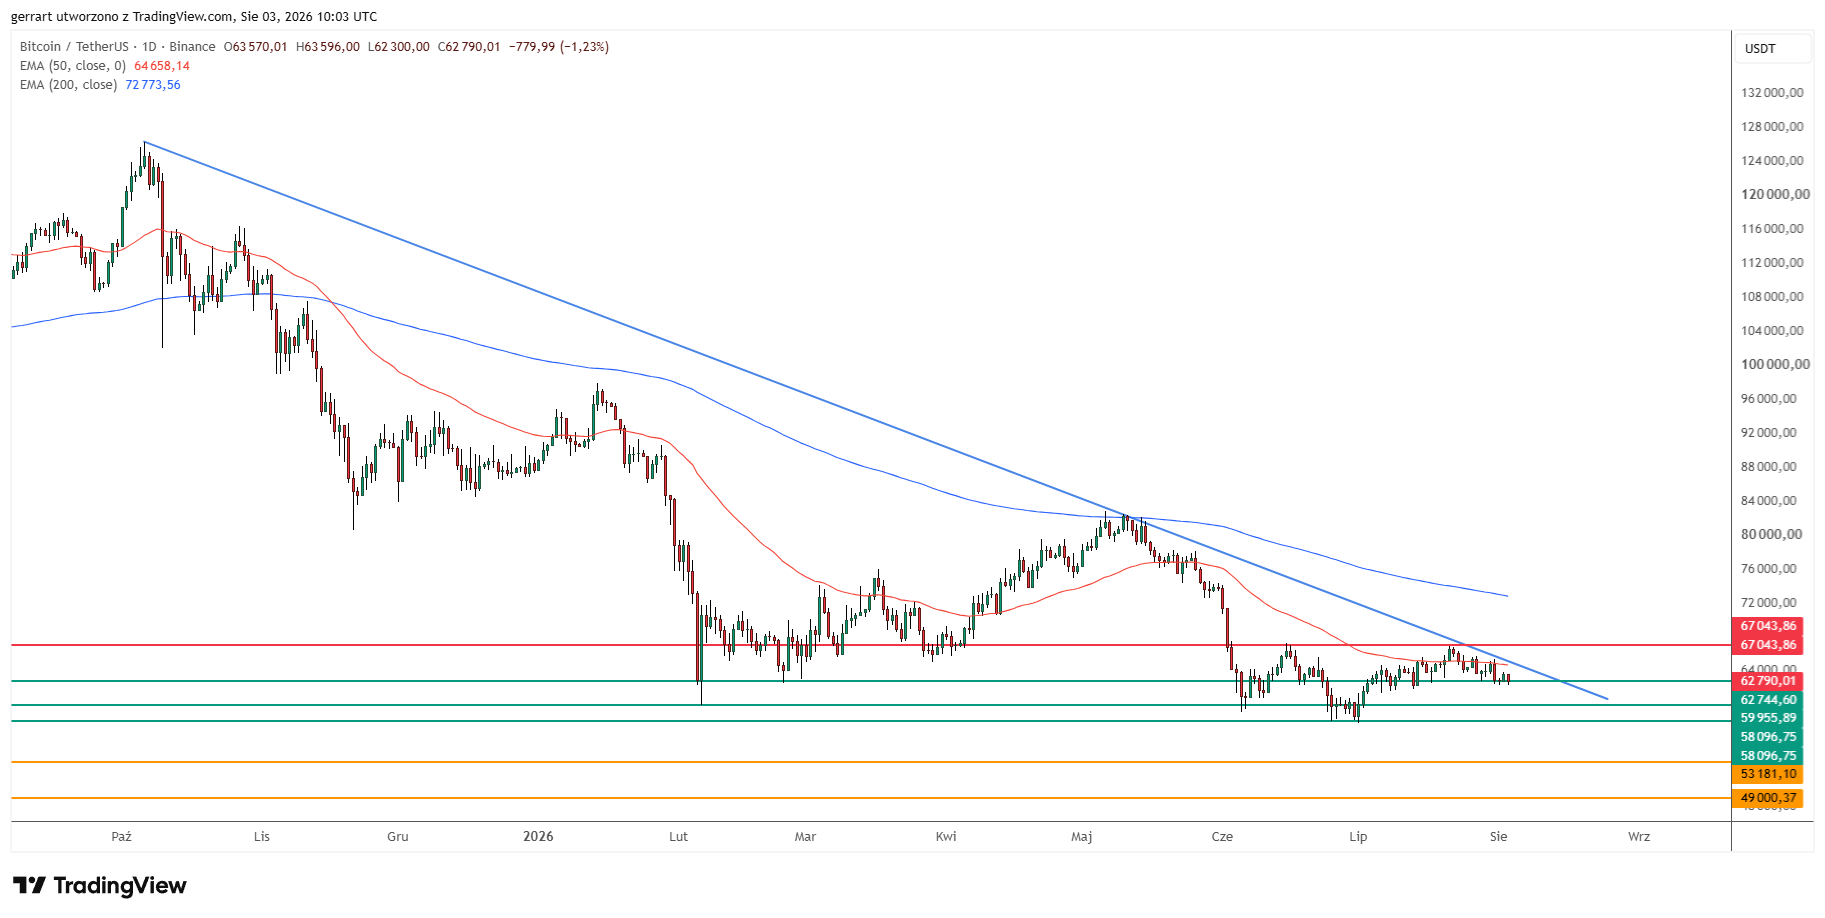
Bitcoin remains below its descending trendline and the 50-day EMA. Source: TradingView
Daily BTC/USDT chart showing the descending trendline from the October 2025 peak, the 50-day EMA near $64,638, the 200-day EMA near $72,774, resistance at $67,044 and support levels at $62,745, $60,000 and $58,097.
Scenario
Confirmation
Target
What Would Invalidate It?
Range continues
BTC holds $58,097
$62,745–$67,044
Break outside the range
Bearish breakdown
Sustained move below $58,097
$53,181, then $49,000
Recovery above $60,000
Bullish recovery
Reclaim of $67,044 and the descending trendline
200-day EMA near $72,774
Rejection back below $64,600
My short-term view remains neutral while Bitcoin stays inside this range. I do not see a clean directional signal between approximately $58,000 and $67,000.
The broader bias, however, remains bearish because price continues to trade below the falling trendline, the 50-day EMA and the 200-day EMA.
Why the $60,000 Bitcoin Level Matters Beyond the Chart
The area around $60,000 is not only a technical support zone.
Jim Ferraioli, Director of Digital Currency Research and Strategy at Charles Schwab, previously noted that “Bitcoin bottomed in February, near $60,000,” linking that level to the production cost of the most efficient miners.
According to Schwab’s official market discussion, operators with the lowest energy costs and most advanced equipment could produce Bitcoin near $60,000. Ferraioli placed the corresponding cost for an average miner much higher, near $95,000.
Production cost should not be treated as a guaranteed price floor. Miners can operate at a temporary loss, sell reserves, shut down less efficient equipment or shift infrastructure toward other applications.
A CoinShares mining report estimated the weighted average cash cost among publicly listed miners at approximately $79,995 per Bitcoin in the fourth quarter of 2025. CoinShares also cautioned that artificial intelligence and high-performance-computing investments can distort some company-level cost calculations.
Still, the convergence between February’s price low, the current $60,000 support and efficient miners’ estimated production cost makes this zone more important than an ordinary round number.
A Break Below $58K Opens the Path to $53K and $49K
The first chart shows the immediate battle. The longer-term chart explains what could happen if buyers lose it.
A sustained break below $58,097 would remove the lower boundary of the current consolidation. The next technical reference sits near $53,181, approximately 15% below Monday’s price.
Below that, my chart points to approximately $49,000. This level was tested repeatedly between July and September 2024 and formed part of the base from which Bitcoin launched its subsequent advance.
From the current price near $62,790, a decline to $49,000 would represent a loss of roughly 22%.
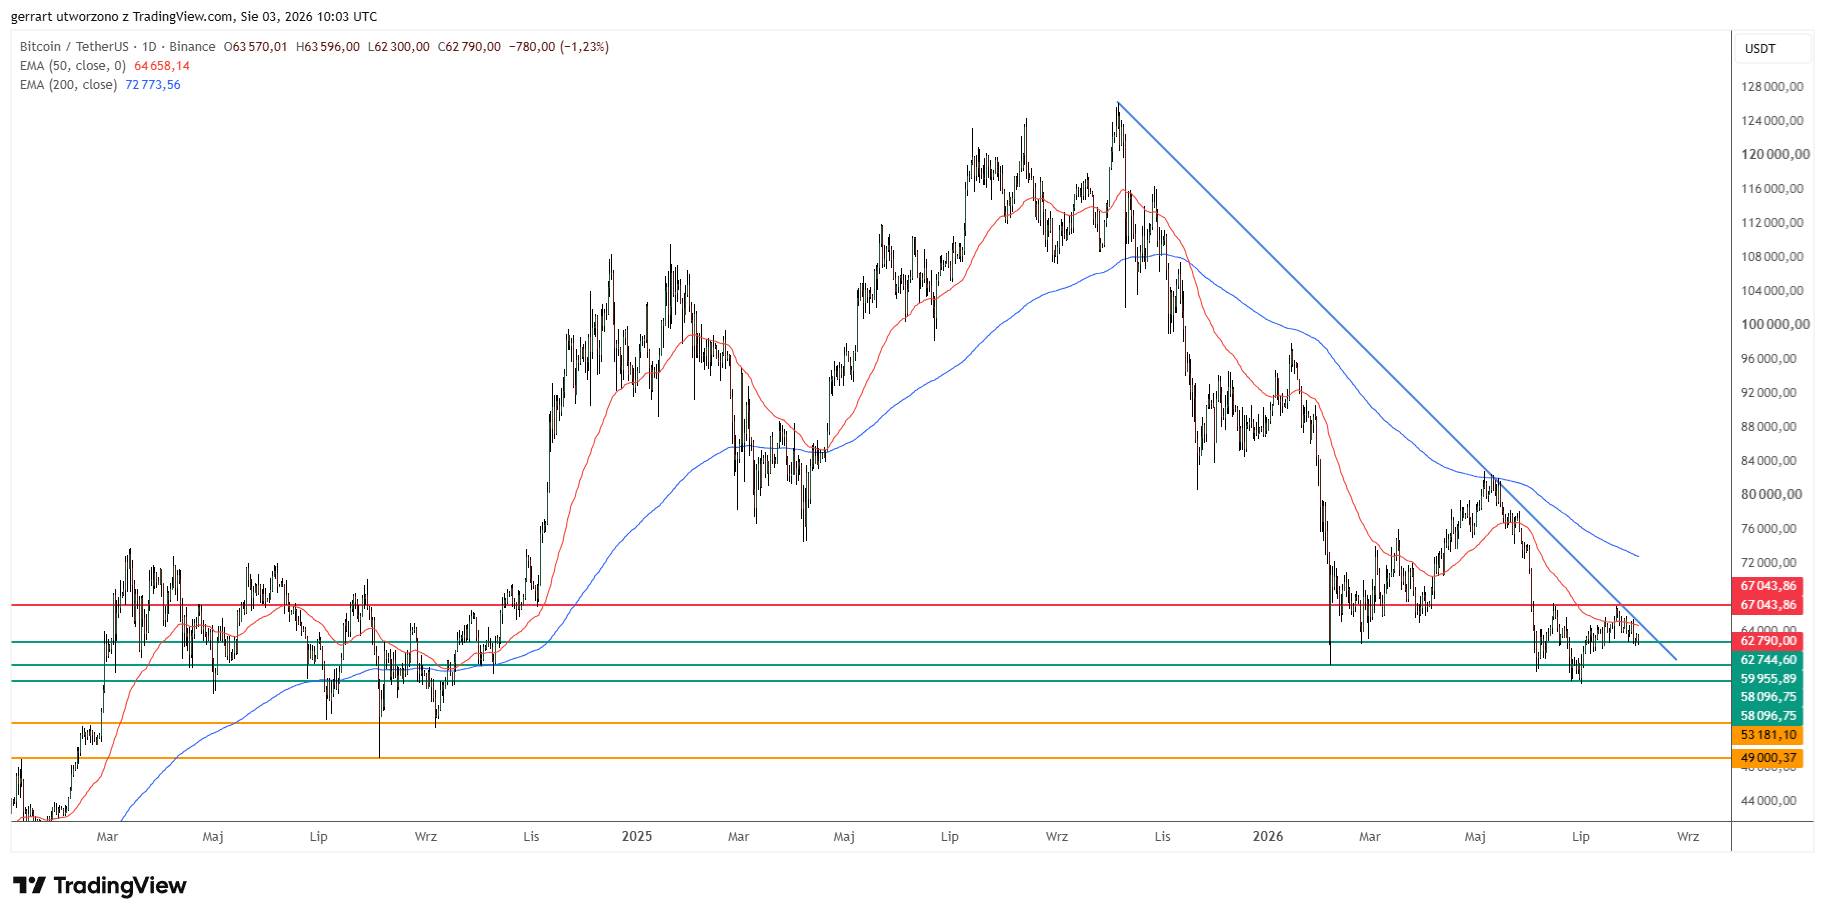
Bitcoin’s multi-year chart exposes $53,181 and $49,000. Source: TradingView
Multi-year BTC/USDT chart showing the historical significance of the $53,181 and $49,000 levels. The chart should illustrate how these areas acted as reaction lows and part of Bitcoin’s accumulation base between July and September 2024.
These are conditional targets, not a prediction that Bitcoin must immediately fall to $49,000. The bearish continuation activates only after the existing range breaks.
A brief intraday move below $58,000 followed by a fast recovery would not be sufficient confirmation. I would want to see the price remain below the range floor, preferably through a daily close, before treating $53,181 as the active target.
What Would Invalidate the Bearish Bitcoin Setup?
The first positive signal would be a recovery above the 50-day EMA near $64,638.
More importantly, Bitcoin would need to break the descending trendline and close above the horizontal resistance at approximately $67,044. Such a move would end the current pattern of lower highs and reopen the path toward the 200-day EMA near $72,774.
Until that happens, price remains compressed inside a broader downtrend.
This daily-chart setup refines rather than replaces my earlier bearish analysis. My July 20 Bitcoin analysis identified a deeper Fibonacci objective near $44,858, while the July 8 monthly chart placed the first long-term support around $49,024.
The new daily chart identifies the nearer decision points: $62,745, $60,000 and, most importantly, $58,097.
The Bottom Line
Bitcoin’s 1% decline below $63,000 is not the signal. The range break will be.
As long as $58,097 holds, BTC can continue drifting sideways between roughly $58,000 and $67,000. A confirmed loss of that floor would activate $53,181 and then $49,000, creating approximately 22% downside risk.
A close above $67,044 would invalidate the immediate bearish structure and shift attention toward the 200-day EMA near $72,774.
Bitcoin (BTC) slipped back below $63,000 during Monday’s session, trading near $62,790 at 10:03 UTC on August 3 after falling just over 1%.
The decline itself is not a breakout. In fact, very little has changed on the Bitcoin chart during the summer. After the sharp selloff spanning late May and June, BTC has spent weeks rotating inside the same broad consolidation range.
The lower boundary sits near $58,100, while resistance remains concentrated around $67,000. Bitcoin is now testing an intermediate support shelf at $62,745, with the psychologically important $60,000 level immediately below it.
What makes the current setup worth watching is not Monday’s modest decline. It is the way horizontal support, a descending trendline and two moving averages are gradually compressing the price. This range cannot narrow indefinitely.
Bitcoin’s Summer Range Is Compressing Between $58K and $67K
The same line capped the recovery in May and has been tested again since late July. Buyers have so far failed to break it.
Bitcoin also remains below its 50-day exponential moving average, currently near $64,638. The average has turned into dynamic resistance and overlaps with the descending trendline, creating a narrow supply zone above the current market price.
The longer-term picture remains weaker. The 200-day EMA is still far above spot at approximately $72,774. With both moving averages above the price, the prevailing trend remains bearish despite the sideways movement recorded since June.
Monday’s price action is testing the local $62,745 shelf. Below it, the next defenses are located around $60,000 and $58,097.
Bitcoin remains below its descending trendline and the 50-day EMA. Source: TradingView
Daily BTC/USDT chart showing the descending trendline from the October 2025 peak, the 50-day EMA near $64,638, the 200-day EMA near $72,774, resistance at $67,044 and support levels at $62,745, $60,000 and $58,097.
Scenario
Confirmation
Target
What Would Invalidate It?
Range continues
BTC holds $58,097
$62,745–$67,044
Break outside the range
Bearish breakdown
Sustained move below $58,097
$53,181, then $49,000
Recovery above $60,000
Bullish recovery
Reclaim of $67,044 and the descending trendline
200-day EMA near $72,774
Rejection back below $64,600
My short-term view remains neutral while Bitcoin stays inside this range. I do not see a clean directional signal between approximately $58,000 and $67,000.
The broader bias, however, remains bearish because price continues to trade below the falling trendline, the 50-day EMA and the 200-day EMA.
Why the $60,000 Bitcoin Level Matters Beyond the Chart
The area around $60,000 is not only a technical support zone.
Jim Ferraioli, Director of Digital Currency Research and Strategy at Charles Schwab, previously noted that “Bitcoin bottomed in February, near $60,000,” linking that level to the production cost of the most efficient miners.
According to Schwab’s official market discussion, operators with the lowest energy costs and most advanced equipment could produce Bitcoin near $60,000. Ferraioli placed the corresponding cost for an average miner much higher, near $95,000.
Production cost should not be treated as a guaranteed price floor. Miners can operate at a temporary loss, sell reserves, shut down less efficient equipment or shift infrastructure toward other applications.
A CoinShares mining report estimated the weighted average cash cost among publicly listed miners at approximately $79,995 per Bitcoin in the fourth quarter of 2025. CoinShares also cautioned that artificial intelligence and high-performance-computing investments can distort some company-level cost calculations.
Still, the convergence between February’s price low, the current $60,000 support and efficient miners’ estimated production cost makes this zone more important than an ordinary round number.
A Break Below $58K Opens the Path to $53K and $49K
The first chart shows the immediate battle. The longer-term chart explains what could happen if buyers lose it.
A sustained break below $58,097 would remove the lower boundary of the current consolidation. The next technical reference sits near $53,181, approximately 15% below Monday’s price.
Below that, my chart points to approximately $49,000. This level was tested repeatedly between July and September 2024 and formed part of the base from which Bitcoin launched its subsequent advance.
From the current price near $62,790, a decline to $49,000 would represent a loss of roughly 22%.
Bitcoin’s multi-year chart exposes $53,181 and $49,000. Source: TradingView
Multi-year BTC/USDT chart showing the historical significance of the $53,181 and $49,000 levels. The chart should illustrate how these areas acted as reaction lows and part of Bitcoin’s accumulation base between July and September 2024.
These are conditional targets, not a prediction that Bitcoin must immediately fall to $49,000. The bearish continuation activates only after the existing range breaks.
A brief intraday move below $58,000 followed by a fast recovery would not be sufficient confirmation. I would want to see the price remain below the range floor, preferably through a daily close, before treating $53,181 as the active target.
What Would Invalidate the Bearish Bitcoin Setup?
The first positive signal would be a recovery above the 50-day EMA near $64,638.
More importantly, Bitcoin would need to break the descending trendline and close above the horizontal resistance at approximately $67,044. Such a move would end the current pattern of lower highs and reopen the path toward the 200-day EMA near $72,774.
Until that happens, price remains compressed inside a broader downtrend.
This daily-chart setup refines rather than replaces my earlier bearish analysis. My July 20 Bitcoin analysis identified a deeper Fibonacci objective near $44,858, while the July 8 monthly chart placed the first long-term support around $49,024.
The new daily chart identifies the nearer decision points: $62,745, $60,000 and, most importantly, $58,097.
The Bottom Line
Bitcoin’s 1% decline below $63,000 is not the signal. The range break will be.
As long as $58,097 holds, BTC can continue drifting sideways between roughly $58,000 and $67,000. A confirmed loss of that floor would activate $53,181 and then $49,000, creating approximately 22% downside risk.
A close above $67,044 would invalidate the immediate bearish structure and shift attention toward the 200-day EMA near $72,774.
Damian Chmiel is a Senior Analyst & Editor at Finance Magnates with more than 15 years of experience in the CFD and online trading industry. Active as both a trader and journalist since 2010, he focuses on broker coverage, fintech innovation, and regulatory developments across Europe, the Middle East, and Asia.
His work includes interviews with C-level leaders at major brokerages and fintech platforms, as well as co-authoring Finance Magnates’ quarterly industry benchmarking reports. Damian’s reporting is data-driven, market-aware, and grounded in direct industry engagement. His analysis and commentary have also been cited by external media outlets, including Investing.com, Binance, The Asset, Stockhead, and Dispatch.
Education:
MA in Finance and Accounting, Cracow University of Economics
Bitcoin Price Prediction: BTC Breaks Its 50-Month EMA in the Worst Month Since 2022
Featured Videos
FM Daily Brief – 31 July 2026
Today's Friday, the 31st of July 2026, and these are our main stories: IG Group's $1.3 billion acquisition of Underdog, XTB's record-breaking share price, and Dubai's emergence as the retail FX industry's new talent hub.
Today's Thursday, the 30th of July 2026, and these are our main stories: Squared Financial's offshore operations appear to have gone dark, XTB's investment products continue to attract new clients, and Trade Nation outlines its European growth strategy.
FM Daily Brief – 29 July 2026
Today's Wednesday, the 29th of July 2026, and these are our main stories: Cyprus and Poland go head-to-head as CFD licensing hubs, but is there a winner? Mas Markets takes a stake in Solid, and Swissquote UK's losses deepen.
FM Daily Brief – 28 July 2026
Today's Tuesday, the 28th of July 2026, and these are our main stories: tastytrade enters the CFTC regulated prediction markets, Mitrade renews its Argentina football sponsorship, and the Tokyo Stock Exchange pushes to lower the cost of investing.
FM Daily Brief – 27 July 2026
Today's Monday, the 27th of July 2026, and these are our main stories: iFOREX reports stronger client growth despite currency headwinds, BlackBull's New Zealand business expands, and the FCA highlights Consumer Duty good practice.