Silver trades at $68.91 on Thursday, June 18, 2026, up 1.5% and back above the 200 EMA it broke just last week.
My chart shows the 50 EMA at $74 as the gate. Clear it and a 30% swing toward the $89 range top opens up.
X traders split: targets run from Jess at $77 to Dr. Potassium at $96, while Damodara Rao sees a $60-$75 base.
Let's check the current price of silver and the newest silve price forecasts
Silver
traded at $68.91 per ounce on Thursday, June 18, 2026, up 1.5% on the day and
back above the 200 EMA it had broken just one week earlier. The reclaim
reverses the bearish signal that defined my last analysis and drops price back
inside the $66 to $89 consolidation that has framed the white metal since
February.
Wednesday's
near 3% drop, triggered by a hawkish Federal Reserve, found a floor almost
exactly at the moving average that matters most.
The setup
now is simple. Silver sits at the bottom of a range it has refused to leave for
four months, and the next directional clue is the 50 EMA at $74. Until that
level breaks, very little has changed on the chart since February.
Follow
me on X for real-time silver market analysis: @ChmielDk
Silver Technical Analysis:
The $74 Gate
A week ago
I wrote that silver had broken below its 200 EMA and warned how low that could
take it, in my analysis of the 200 EMA breakdown. The chart has since flipped. Price
has climbed back above that average, and the consolidation between $66 support
and $89 resistance is live again.
The $66 to
$68 support zone coincides almost to the dollar with the 200 EMA, and that
confluence is what stopped Wednesday's selloff. The upper boundary near $89
traces the local highs from early February, a level last tested in the first
half of May, which is what triggered the most recent leg down.
This is the
same range I mapped when silver crashed to the $70 floor for
the third time in
March. In 15+ years trading and analyzing metals at FinanceMagnates.com, 10 of
them spent covering silver's every major break, a 200 EMA reclaim this fast
after a breakdown is rare, and you can read more of my metals work on my analyst page.
Silver is
trying to bounce, but the move higher has a ceiling: the 50 EMA sits near $74,
a meaningful distance above spot. That is the gate. The swing-trading principle
for range-bound markets is direct. As long as price holds between two
boundaries, it tends to travel from one to the other, so the path to $89 stays
open while $66 holds.
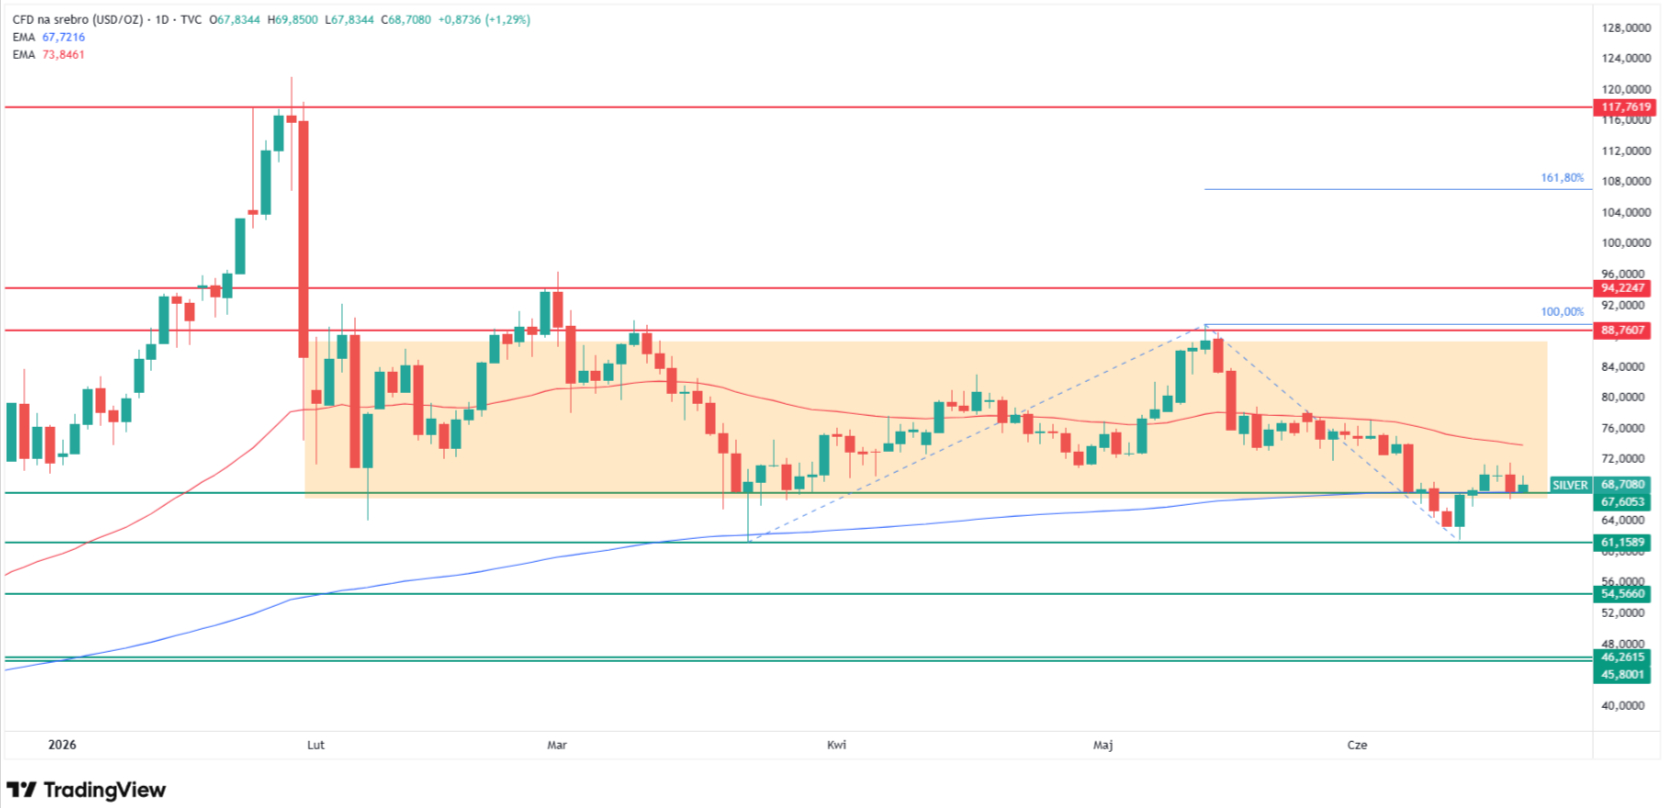
From
current levels, the upside to the top of the channel is roughly 30%. My
Fibonacci extension, stretched across the prior trend, puts the 100% level just
above the $89 boundary, which reinforces a target aligned with the dominant
trend. I do not rule that scenario out, but I want to see $74 taken first.
How high can silver go? XAG/USD daily chart with 50 and 200 EMA. Source: Tradingview.com
Key levels:
Level
Type
Notes
$89
Resistance
Upper
consolidation boundary, early February highs, last tested in May
$74
50 EMA
The gate.
Upside stays capped until a clean break
$68
Spot / pivot
Current
price, just above reclaimed support
$66-$68
Support / 200 EMA
Confluence
floor that held on Wednesday
$62
Support
March
swing low, first downside target if $66 fails
A close
back below $66 reopens the $62 March low and turns the chart bearish again. A
daily close above $74 is the trigger I am watching for the move toward $89.
Why Is Silver Recovering?
Silver
climbed above $69 on Thursday after the US dollar retreated from the spike that
followed Wednesday's Fed decision. President Donald Trump signed an interim
agreement to end the conflict with Iran and reopen the Strait of Hormuz, easing
the oil-driven inflation premium that has weighed on metals all year.
Lower crude
takes pressure off Treasury yields, and softer yields reduce the opportunity
cost of holding non-yielding silver.
The cap on
the rebound is monetary policy. Silver tumbled about 3% on Wednesday after the
Fed signaled growing support for rate hikes this year, with half of FOMC
members projecting that a hike may be needed.
New Fed
Chair Kevin Warsh declined to guide on the next move but stressed that
inflation has run above the 2% target for years. That hawkish tilt is why
silver bounced off support rather than ripping through resistance.
The drivers
behind the current move:
Dollar pullback: The US Dollar Index eased off
its post-Fed spike, the direct trigger for Thursday's bounce.
Hormuz reopening: The US-Iran interim deal
pulled oil lower, easing the inflation channel that suppressed metals.
Hawkish Fed cap: Half of FOMC members flagged a
possible 2026 hike, keeping yields elevated and limiting upside.
How High Can Silver Go? What
Traders on X Are Watching
Sentiment
among chart-focused traders on X leans cautiously bullish, with the $66 zone
treated as the line in the sand.
"My
view remains bullish while price stays above $60," said Jess, the trader
behind @JessXAUUSD, who flagged $71 as the breakout trigger
toward $77. That aligns with my own read: $66 holding keeps the bullish
structure intact, though I put the real gate higher, at the $74 50 EMA.
$xag#Gümüş takip ettiğimiz 66 bölgesinde yer alan mavi kutu desteğine geldi. Destekte tutunduktan sonra yükseliş yeniden devam edebilir.
71 tepesini kırdığında takip edeceğimiz dirençler 77-89 tepeleridir. Bu bölge önemli, üzerlerinde kapanış yapıp kalıcılık… pic.twitter.com/NoD5W47UkQ
Kamile Uray
(@remdocan)
sees the same $66 support holding and points to $77 and $89 as the resistances
above a $71 break. The clustering around $89 from independent analysts is
notable, since it matches the top of my consolidation channel exactly.
The most
aggressive target comes from Dr. Potassium (@potassium_phd),
who wrote that silver's "next target is $96.01, likely sometime in
June," conditional on the October 2025 trendline holding as support. That
sits well above my channel, and I would need a clean $89 break to entertain it.
Silver 🥈 — $77.04 — still not out of dead cat bounce territory until getting at least above the 50% level of the prior daily candle, but looks promising that the October 2025 trend line will hold as support and that the sell-off is essentially over.
Not
everyone is positioned for a breakout. "Silver is entering a multi-month
sideways consolidation between $60 and $75," said Damodara Rao (@damodara_SEBIRA), arguing selling momentum is drying up while the market builds a base.
That range-bound thesis is closest to what my chart has shown since February.
Silver is entering a multi-month sideways consolidation between $60 and $75 as the previous parabolic uptrend cools down and selling momentum is also drying up which signals that the market lacks the pressure to break lower but needs time to build a new base. pic.twitter.com/73W7YC3nOP
— Damodara Rao (SEBI RA) (@damodara_SEBIRA) June 13, 2026
Janey (@Janey_Analyst)
framed an intraday long setup off the $67.65 area with short-term targets up to
$70.15, a near-term echo of the broader bullish-while-above-support structure.
#SILVER#XAGUSD Trading Setup – Buy Opportunity (1-Hour Chart)#XAGUSD is approaching a key demand zone, and buying power is emerging. As long as the price remains above the current market area, the bullish outlook remains valid.
The
forecast range for silver remains extraordinarily wide, and the spread between
X traders and institutions tells the story. Back in April I laid out the full institutional case from BofA,
Citi and Reuters as
COMEX inventory tightened. My own structure says the question is binary: hold
$66 and grind toward $89, or lose it and revisit $62.
Source
Target
Notes
Damodara Rao (@damodara_SEBIRA)
$60-$75 range
June 2026, base-building consolidation
Jess (@JessXAUUSD)
$77
On a break above $71
Kamile Uray (@remdocan)
$77, then $89
Resistances above a $71 break
Dr. Potassium (@potassium_phd)
$96
June
2026, if Oct 2025 trendline holds
Citigroup (Max Layton)
$150
3-month
target from January, gold-silver ratio compression
HSBC
$68.25 avg
2026 average forecast
My view on
each: Damodara Rao's $60-$75 base is the scenario my chart most supports, since
silver has refused to leave this range since February. Jess and Uray's $77 is
realistic but only after the $74 50 EMA falls, which neither flags explicitly.
Dr. Potassium's $96 requires breaking $89 first, a level that has capped every
rally this year.
Citi's $150 call was made in January near the $120
highs and looks stretched against current action. HSBC's $68.25 average is almost exactly where silver
trades today, which makes it the most credible institutional anchor on the
board.
FAQ, Silver Price Analysis
How high can silver go in
2026?
My chart
puts the immediate ceiling at $89, the top of the consolidation that has held
since February, roughly 30% above the $68.91 price on June 18. A daily close
above the $74 50 EMA is the trigger for that move. Independent X traders target
$77 to $96, while Citigroup's January call of $150 looks stretched against
current action.
What is the key level for
silver right now?
The 50 EMA
at $74 is the gate. Silver reclaimed its 200 EMA near $66 to $68 this week,
putting price back inside its range, but upside stays capped until $74 breaks
on a closing basis. Below, the $66 confluence floor is the line that keeps the
bullish structure intact.
Why did silver fall this
week?
Silver
dropped about 3% on Wednesday, June 17, after the Federal Reserve signaled
growing support for rate hikes in 2026, with half of FOMC members projecting a
hike may be needed. The hawkish tilt lifted the dollar and Treasury yields,
both headwinds for non-yielding silver, before a US-Iran deal reopening the
Strait of Hormuz sparked Thursday's bounce.
What is silver's support
level?
The $66 to
$68 zone is critical support, coinciding almost exactly with the 200 EMA, and
it held on Wednesday's selloff. A daily close below it reopens the $62 March
swing low as the next downside target. As long as $66 holds, the four-month
consolidation between $66 and $89 stays intact.
Silver
traded at $68.91 per ounce on Thursday, June 18, 2026, up 1.5% on the day and
back above the 200 EMA it had broken just one week earlier. The reclaim
reverses the bearish signal that defined my last analysis and drops price back
inside the $66 to $89 consolidation that has framed the white metal since
February.
Wednesday's
near 3% drop, triggered by a hawkish Federal Reserve, found a floor almost
exactly at the moving average that matters most.
The setup
now is simple. Silver sits at the bottom of a range it has refused to leave for
four months, and the next directional clue is the 50 EMA at $74. Until that
level breaks, very little has changed on the chart since February.
Follow
me on X for real-time silver market analysis: @ChmielDk
Silver Technical Analysis:
The $74 Gate
A week ago
I wrote that silver had broken below its 200 EMA and warned how low that could
take it, in my analysis of the 200 EMA breakdown. The chart has since flipped. Price
has climbed back above that average, and the consolidation between $66 support
and $89 resistance is live again.
The $66 to
$68 support zone coincides almost to the dollar with the 200 EMA, and that
confluence is what stopped Wednesday's selloff. The upper boundary near $89
traces the local highs from early February, a level last tested in the first
half of May, which is what triggered the most recent leg down.
This is the
same range I mapped when silver crashed to the $70 floor for
the third time in
March. In 15+ years trading and analyzing metals at FinanceMagnates.com, 10 of
them spent covering silver's every major break, a 200 EMA reclaim this fast
after a breakdown is rare, and you can read more of my metals work on my analyst page.
Silver is
trying to bounce, but the move higher has a ceiling: the 50 EMA sits near $74,
a meaningful distance above spot. That is the gate. The swing-trading principle
for range-bound markets is direct. As long as price holds between two
boundaries, it tends to travel from one to the other, so the path to $89 stays
open while $66 holds.
From
current levels, the upside to the top of the channel is roughly 30%. My
Fibonacci extension, stretched across the prior trend, puts the 100% level just
above the $89 boundary, which reinforces a target aligned with the dominant
trend. I do not rule that scenario out, but I want to see $74 taken first.
How high can silver go? XAG/USD daily chart with 50 and 200 EMA. Source: Tradingview.com
Key levels:
Level
Type
Notes
$89
Resistance
Upper
consolidation boundary, early February highs, last tested in May
$74
50 EMA
The gate.
Upside stays capped until a clean break
$68
Spot / pivot
Current
price, just above reclaimed support
$66-$68
Support / 200 EMA
Confluence
floor that held on Wednesday
$62
Support
March
swing low, first downside target if $66 fails
A close
back below $66 reopens the $62 March low and turns the chart bearish again. A
daily close above $74 is the trigger I am watching for the move toward $89.
Why Is Silver Recovering?
Silver
climbed above $69 on Thursday after the US dollar retreated from the spike that
followed Wednesday's Fed decision. President Donald Trump signed an interim
agreement to end the conflict with Iran and reopen the Strait of Hormuz, easing
the oil-driven inflation premium that has weighed on metals all year.
Lower crude
takes pressure off Treasury yields, and softer yields reduce the opportunity
cost of holding non-yielding silver.
The cap on
the rebound is monetary policy. Silver tumbled about 3% on Wednesday after the
Fed signaled growing support for rate hikes this year, with half of FOMC
members projecting that a hike may be needed.
New Fed
Chair Kevin Warsh declined to guide on the next move but stressed that
inflation has run above the 2% target for years. That hawkish tilt is why
silver bounced off support rather than ripping through resistance.
The drivers
behind the current move:
Dollar pullback: The US Dollar Index eased off
its post-Fed spike, the direct trigger for Thursday's bounce.
Hormuz reopening: The US-Iran interim deal
pulled oil lower, easing the inflation channel that suppressed metals.
Hawkish Fed cap: Half of FOMC members flagged a
possible 2026 hike, keeping yields elevated and limiting upside.
How High Can Silver Go? What
Traders on X Are Watching
Sentiment
among chart-focused traders on X leans cautiously bullish, with the $66 zone
treated as the line in the sand.
"My
view remains bullish while price stays above $60," said Jess, the trader
behind @JessXAUUSD, who flagged $71 as the breakout trigger
toward $77. That aligns with my own read: $66 holding keeps the bullish
structure intact, though I put the real gate higher, at the $74 50 EMA.
$xag#Gümüş takip ettiğimiz 66 bölgesinde yer alan mavi kutu desteğine geldi. Destekte tutunduktan sonra yükseliş yeniden devam edebilir.
71 tepesini kırdığında takip edeceğimiz dirençler 77-89 tepeleridir. Bu bölge önemli, üzerlerinde kapanış yapıp kalıcılık… pic.twitter.com/NoD5W47UkQ
Kamile Uray
(@remdocan)
sees the same $66 support holding and points to $77 and $89 as the resistances
above a $71 break. The clustering around $89 from independent analysts is
notable, since it matches the top of my consolidation channel exactly.
The most
aggressive target comes from Dr. Potassium (@potassium_phd),
who wrote that silver's "next target is $96.01, likely sometime in
June," conditional on the October 2025 trendline holding as support. That
sits well above my channel, and I would need a clean $89 break to entertain it.
Silver 🥈 — $77.04 — still not out of dead cat bounce territory until getting at least above the 50% level of the prior daily candle, but looks promising that the October 2025 trend line will hold as support and that the sell-off is essentially over.
Not
everyone is positioned for a breakout. "Silver is entering a multi-month
sideways consolidation between $60 and $75," said Damodara Rao (@damodara_SEBIRA), arguing selling momentum is drying up while the market builds a base.
That range-bound thesis is closest to what my chart has shown since February.
Silver is entering a multi-month sideways consolidation between $60 and $75 as the previous parabolic uptrend cools down and selling momentum is also drying up which signals that the market lacks the pressure to break lower but needs time to build a new base. pic.twitter.com/73W7YC3nOP
— Damodara Rao (SEBI RA) (@damodara_SEBIRA) June 13, 2026
Janey (@Janey_Analyst)
framed an intraday long setup off the $67.65 area with short-term targets up to
$70.15, a near-term echo of the broader bullish-while-above-support structure.
#SILVER#XAGUSD Trading Setup – Buy Opportunity (1-Hour Chart)#XAGUSD is approaching a key demand zone, and buying power is emerging. As long as the price remains above the current market area, the bullish outlook remains valid.
The
forecast range for silver remains extraordinarily wide, and the spread between
X traders and institutions tells the story. Back in April I laid out the full institutional case from BofA,
Citi and Reuters as
COMEX inventory tightened. My own structure says the question is binary: hold
$66 and grind toward $89, or lose it and revisit $62.
Source
Target
Notes
Damodara Rao (@damodara_SEBIRA)
$60-$75 range
June 2026, base-building consolidation
Jess (@JessXAUUSD)
$77
On a break above $71
Kamile Uray (@remdocan)
$77, then $89
Resistances above a $71 break
Dr. Potassium (@potassium_phd)
$96
June
2026, if Oct 2025 trendline holds
Citigroup (Max Layton)
$150
3-month
target from January, gold-silver ratio compression
HSBC
$68.25 avg
2026 average forecast
My view on
each: Damodara Rao's $60-$75 base is the scenario my chart most supports, since
silver has refused to leave this range since February. Jess and Uray's $77 is
realistic but only after the $74 50 EMA falls, which neither flags explicitly.
Dr. Potassium's $96 requires breaking $89 first, a level that has capped every
rally this year.
Citi's $150 call was made in January near the $120
highs and looks stretched against current action. HSBC's $68.25 average is almost exactly where silver
trades today, which makes it the most credible institutional anchor on the
board.
FAQ, Silver Price Analysis
How high can silver go in
2026?
My chart
puts the immediate ceiling at $89, the top of the consolidation that has held
since February, roughly 30% above the $68.91 price on June 18. A daily close
above the $74 50 EMA is the trigger for that move. Independent X traders target
$77 to $96, while Citigroup's January call of $150 looks stretched against
current action.
What is the key level for
silver right now?
The 50 EMA
at $74 is the gate. Silver reclaimed its 200 EMA near $66 to $68 this week,
putting price back inside its range, but upside stays capped until $74 breaks
on a closing basis. Below, the $66 confluence floor is the line that keeps the
bullish structure intact.
Why did silver fall this
week?
Silver
dropped about 3% on Wednesday, June 17, after the Federal Reserve signaled
growing support for rate hikes in 2026, with half of FOMC members projecting a
hike may be needed. The hawkish tilt lifted the dollar and Treasury yields,
both headwinds for non-yielding silver, before a US-Iran deal reopening the
Strait of Hormuz sparked Thursday's bounce.
What is silver's support
level?
The $66 to
$68 zone is critical support, coinciding almost exactly with the 200 EMA, and
it held on Wednesday's selloff. A daily close below it reopens the $62 March
swing low as the next downside target. As long as $66 holds, the four-month
consolidation between $66 and $89 stays intact.
Damian Chmiel is a Senior Analyst & Editor at Finance Magnates with more than 15 years of experience in the CFD and online trading industry. Active as both a trader and journalist since 2010, he focuses on broker coverage, fintech innovation, and regulatory developments across Europe, the Middle East, and Asia.
His work includes interviews with C-level leaders at major brokerages and fintech platforms, as well as co-authoring Finance Magnates’ quarterly industry benchmarking reports. Damian’s reporting is data-driven, market-aware, and grounded in direct industry engagement. His analysis and commentary have also been cited by external media outlets, including Investing.com, Binance, The Asset, Stockhead, and Dispatch.
Education:
MA in Finance and Accounting, Cracow University of Economics
Bitcoin Price Prediction: BTC Breaks Its 50-Month EMA in the Worst Month Since 2022
Featured Videos
FM Daily Brief – 28 July 2026
FM Daily Brief – 28 July 2026
FM Daily Brief – 28 July 2026
FM Daily Brief – 28 July 2026
Today's Tuesday, the 28th of July 2026, and these are our main stories: tastytrade enters the CFTC regulated prediction markets, Mitrade renews its Argentina football sponsorship, and the Tokyo Stock Exchange pushes to lower the cost of investing.
Today's Tuesday, the 28th of July 2026, and these are our main stories: tastytrade enters the CFTC regulated prediction markets, Mitrade renews its Argentina football sponsorship, and the Tokyo Stock Exchange pushes to lower the cost of investing.
Today's Tuesday, the 28th of July 2026, and these are our main stories: tastytrade enters the CFTC regulated prediction markets, Mitrade renews its Argentina football sponsorship, and the Tokyo Stock Exchange pushes to lower the cost of investing.
Today's Tuesday, the 28th of July 2026, and these are our main stories: tastytrade enters the CFTC regulated prediction markets, Mitrade renews its Argentina football sponsorship, and the Tokyo Stock Exchange pushes to lower the cost of investing.
Today's Monday, the 27th of July 2026, and these are our main stories: iFOREX reports stronger client growth despite currency headwinds, BlackBull's New Zealand business expands, and the FCA highlights Consumer Duty good practice.
Today's Monday, the 27th of July 2026, and these are our main stories: iFOREX reports stronger client growth despite currency headwinds, BlackBull's New Zealand business expands, and the FCA highlights Consumer Duty good practice.
Today's Monday, the 27th of July 2026, and these are our main stories: iFOREX reports stronger client growth despite currency headwinds, BlackBull's New Zealand business expands, and the FCA highlights Consumer Duty good practice.
Today's Monday, the 27th of July 2026, and these are our main stories: iFOREX reports stronger client growth despite currency headwinds, BlackBull's New Zealand business expands, and the FCA highlights Consumer Duty good practice.
Today's Monday, the 27th of July 2026, and these are our main stories: iFOREX reports stronger client growth despite currency headwinds, BlackBull's New Zealand business expands, and the FCA highlights Consumer Duty good practice.
Today's Monday, the 27th of July 2026, and these are our main stories: iFOREX reports stronger client growth despite currency headwinds, BlackBull's New Zealand business expands, and the FCA highlights Consumer Duty good practice.
FM Daily Brief – 24 July 2026
FM Daily Brief – 24 July 2026
FM Daily Brief – 24 July 2026
FM Daily Brief – 24 July 2026
FM Daily Brief – 24 July 2026
FM Daily Brief – 24 July 2026
Today's Friday, the 24th of July 2026, and these are our main stories: the FCA finds major gaps in anti-money laundering controls at alternative asset managers, Wise shares tumble after a US banking licence setback, and Google's EU fines could benefit fintech apps.
Today's Friday, the 24th of July 2026, and these are our main stories: the FCA finds major gaps in anti-money laundering controls at alternative asset managers, Wise shares tumble after a US banking licence setback, and Google's EU fines could benefit fintech apps.
Today's Friday, the 24th of July 2026, and these are our main stories: the FCA finds major gaps in anti-money laundering controls at alternative asset managers, Wise shares tumble after a US banking licence setback, and Google's EU fines could benefit fintech apps.
Today's Friday, the 24th of July 2026, and these are our main stories: the FCA finds major gaps in anti-money laundering controls at alternative asset managers, Wise shares tumble after a US banking licence setback, and Google's EU fines could benefit fintech apps.
Today's Friday, the 24th of July 2026, and these are our main stories: the FCA finds major gaps in anti-money laundering controls at alternative asset managers, Wise shares tumble after a US banking licence setback, and Google's EU fines could benefit fintech apps.
Today's Friday, the 24th of July 2026, and these are our main stories: the FCA finds major gaps in anti-money laundering controls at alternative asset managers, Wise shares tumble after a US banking licence setback, and Google's EU fines could benefit fintech apps.
FM Daily Brief – 23 July 2026
FM Daily Brief – 23 July 2026
FM Daily Brief – 23 July 2026
FM Daily Brief – 23 July 2026
FM Daily Brief – 23 July 2026
FM Daily Brief – 23 July 2026
Today's Thursday, the 23rd of July 2026, and these are our main stories: BitMEX announces it will shut down its crypto trading platform, the Financial Commission launches a certification programme for prop firms, and the SEC settles a records lawsuit with Coinbase.
Today's Thursday, the 23rd of July 2026, and these are our main stories: BitMEX announces it will shut down its crypto trading platform, the Financial Commission launches a certification programme for prop firms, and the SEC settles a records lawsuit with Coinbase.
Today's Thursday, the 23rd of July 2026, and these are our main stories: BitMEX announces it will shut down its crypto trading platform, the Financial Commission launches a certification programme for prop firms, and the SEC settles a records lawsuit with Coinbase.
Today's Thursday, the 23rd of July 2026, and these are our main stories: BitMEX announces it will shut down its crypto trading platform, the Financial Commission launches a certification programme for prop firms, and the SEC settles a records lawsuit with Coinbase.
Today's Thursday, the 23rd of July 2026, and these are our main stories: BitMEX announces it will shut down its crypto trading platform, the Financial Commission launches a certification programme for prop firms, and the SEC settles a records lawsuit with Coinbase.
Today's Thursday, the 23rd of July 2026, and these are our main stories: BitMEX announces it will shut down its crypto trading platform, the Financial Commission launches a certification programme for prop firms, and the SEC settles a records lawsuit with Coinbase.
FM Daily Brief – 22 July 2026
FM Daily Brief – 22 July 2026
FM Daily Brief – 22 July 2026
FM Daily Brief – 22 July 2026
FM Daily Brief – 22 July 2026
FM Daily Brief – 22 July 2026
Today's Wednesday, the 22nd of July 2026, and these are our main stories: retail CFD broker trading volumes ease in the second quarter, Interactive Brokers posts strong quarterly results, and tastytrade faces a Finra fine.
Today's Wednesday, the 22nd of July 2026, and these are our main stories: retail CFD broker trading volumes ease in the second quarter, Interactive Brokers posts strong quarterly results, and tastytrade faces a Finra fine.
Today's Wednesday, the 22nd of July 2026, and these are our main stories: retail CFD broker trading volumes ease in the second quarter, Interactive Brokers posts strong quarterly results, and tastytrade faces a Finra fine.
Today's Wednesday, the 22nd of July 2026, and these are our main stories: retail CFD broker trading volumes ease in the second quarter, Interactive Brokers posts strong quarterly results, and tastytrade faces a Finra fine.
Today's Wednesday, the 22nd of July 2026, and these are our main stories: retail CFD broker trading volumes ease in the second quarter, Interactive Brokers posts strong quarterly results, and tastytrade faces a Finra fine.
Today's Wednesday, the 22nd of July 2026, and these are our main stories: retail CFD broker trading volumes ease in the second quarter, Interactive Brokers posts strong quarterly results, and tastytrade faces a Finra fine.