Silver price breaks its 200-day moving average for the first time since April 2025, losing almost half its value from this year's record high.
Technical targets range from $46 to near $30, with the trend now firmly bearish heading into the second half of 2026.
Why silver price is going down today and what are the newest silver price forecasts?
Silver is
trading at $64 per ounce on Wednesday, 10 June, 2026, the lowest price in three
months, as a confluence of macro headwinds and technical deterioration pushes
the white metal into what analysts now classify as a confirmed downtrend.
The
silver price is going down for the second straight week, shedding nearly 6% so far this
week alone after losing 10% the week before. For context, silver hit an
all-time high above $120 per ounce in late January, meaning the metal has shed
nearly half its value in less than five months.
Why Silver Is Falling
Today? Macro Drivers
The drop
mirrors a broader selloff in precious metals. Gold has been
falling since last week, trading below $4,200 per ounce Wednesday and deepening its own
three-month lows. The catalyst for both moves was a blowout US jobs report
released on June 6, which showed nonfarm payrolls rising 172,000 - more than
twice the 85,000 expected - according to the Bureau of Labor Statistics.
The
mechanics behind why the silver price is going down extend
well beyond one jobs report. Several forces have been compounding since early
2026:
Driver
Impact on Silver
Strong US
jobs data (May NFP: 172k vs 85k est.)
Pushes
Fed rate-hike odds higher, raising cost of carry
Rising US
Treasury yields (10Y near 4.5%)
Reduces
appeal of non-yielding metals
Stronger US dollar
Makes
dollar-denominated silver more expensive abroad
Forced
early liquidations that started the initial selloff
Bas
Kooijman, CEO and co-founder of DHF Capital, put it plainly: "Silver
prices stabilized to a certain extent after a decline last week. The metal
benefited from a retreat in the US dollar and bond yields following a decline
in oil prices and inflation fears to some extent.”
He added
that "the monetary policy backdrop continues to present challenges for
silver," noting that a return to Middle East tensions "could lift oil
prices and bond yields and weigh on silver" - a scenario that appears to
be playing out precisely.
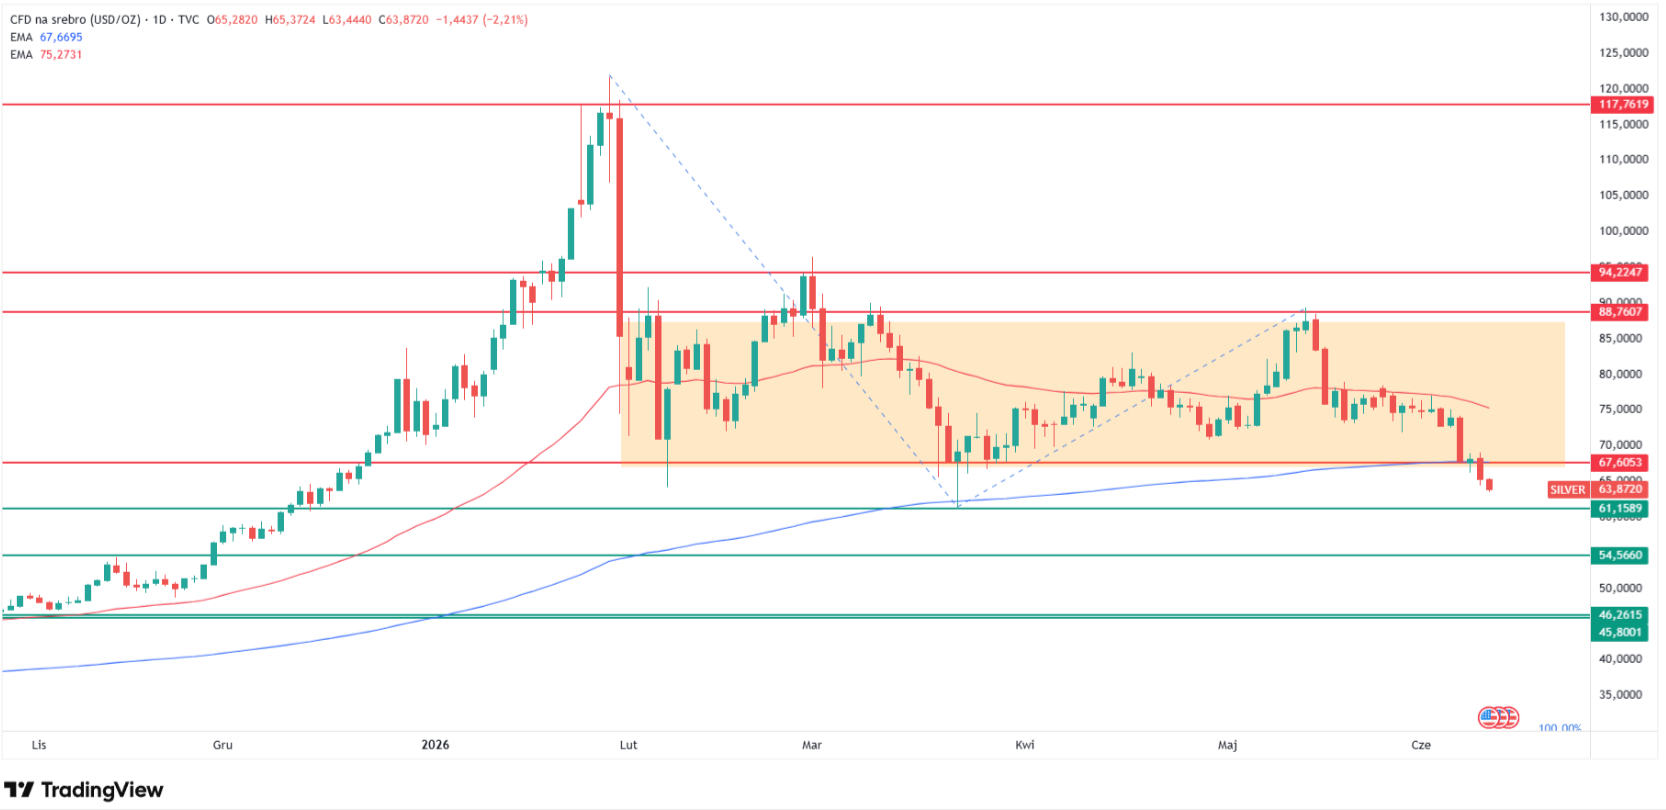
Silver Price Technical
Analysis: The 200 EMA Break
The most
consequential technical development this week is the break of the
200-day exponential moving average (200 EMA), a threshold widely regarded
as the dividing line between bull and bear regimes.
This is the
first time silver has traded beneath that level since mid-April 2025 - a
stretch of more than 13 months during which the metal rallied from around $30
to its January peak above $120, a gain of roughly 300%.
To put that
into perspective: in April 2025, the 200 EMA break proved short-lived, quickly
reversed as bulls defended the level. A similar brief test occurred around the
turn of 2025, when silver dipped below the average only to bounce. The last
sustained period below the 200 EMA before this week goes back to July 2023 -
nearly three years ago - which illustrates just how powerful and durable the
silver bull market was.
The technical analysis of XAG/USD chart. Source: Tradingview.com
The break
is not merely a data point. It signals that the structural floor supporting the
rally has given way.
The Consolidation Zone Is
Gone
For most of
the period from early February through the end of May, silver had been
oscillating in a well-defined range, broadly between $67 and just below $89.
This week's
move below the 200 EMA has broken out of that consolidation zone entirely. When
multiple layers of support converge at the same price level - in this case the
200 EMA, the lower boundary of the February-to-May range, and prior structural
highs - traders call it a "confluence." Breaking that
confluence now opens the chart to a fresh leg lower.
Here is
where the XAGUSD hi-lo picture stands right now, and the
levels that will define price action in the weeks ahead:
Level
Price
Significance
Current price
$64
3-month low, below 200 EMA
First support target
$61
March
2026 year-to-date lows
Key structural support
$55
October/November
2025 highs, now acting as support
Bear target (primary)
$46
Late
October 2025 lows, 28% downside from here
Fibonacci extension target
$30
100% of
the Jan-to-Mar decline, projected from May peak; 56% downside
The $61
level will be the first test. That level represents the year-to-date low set in
March, and a failure there would shift attention toward $55 -
the zone carved by October and November 2025 highs, which now serve as major
structural support.
The primary
bear case places the downside target at approximately $46 per ounce,
corresponding to the late-October 2025 lows. From the current $64 level, that
represents a decline of roughly 28%. It is worth remembering that silver fell
from $121 to below $60 inside of weeks earlier this year, so moves of this
magnitude are not without precedent in this market.
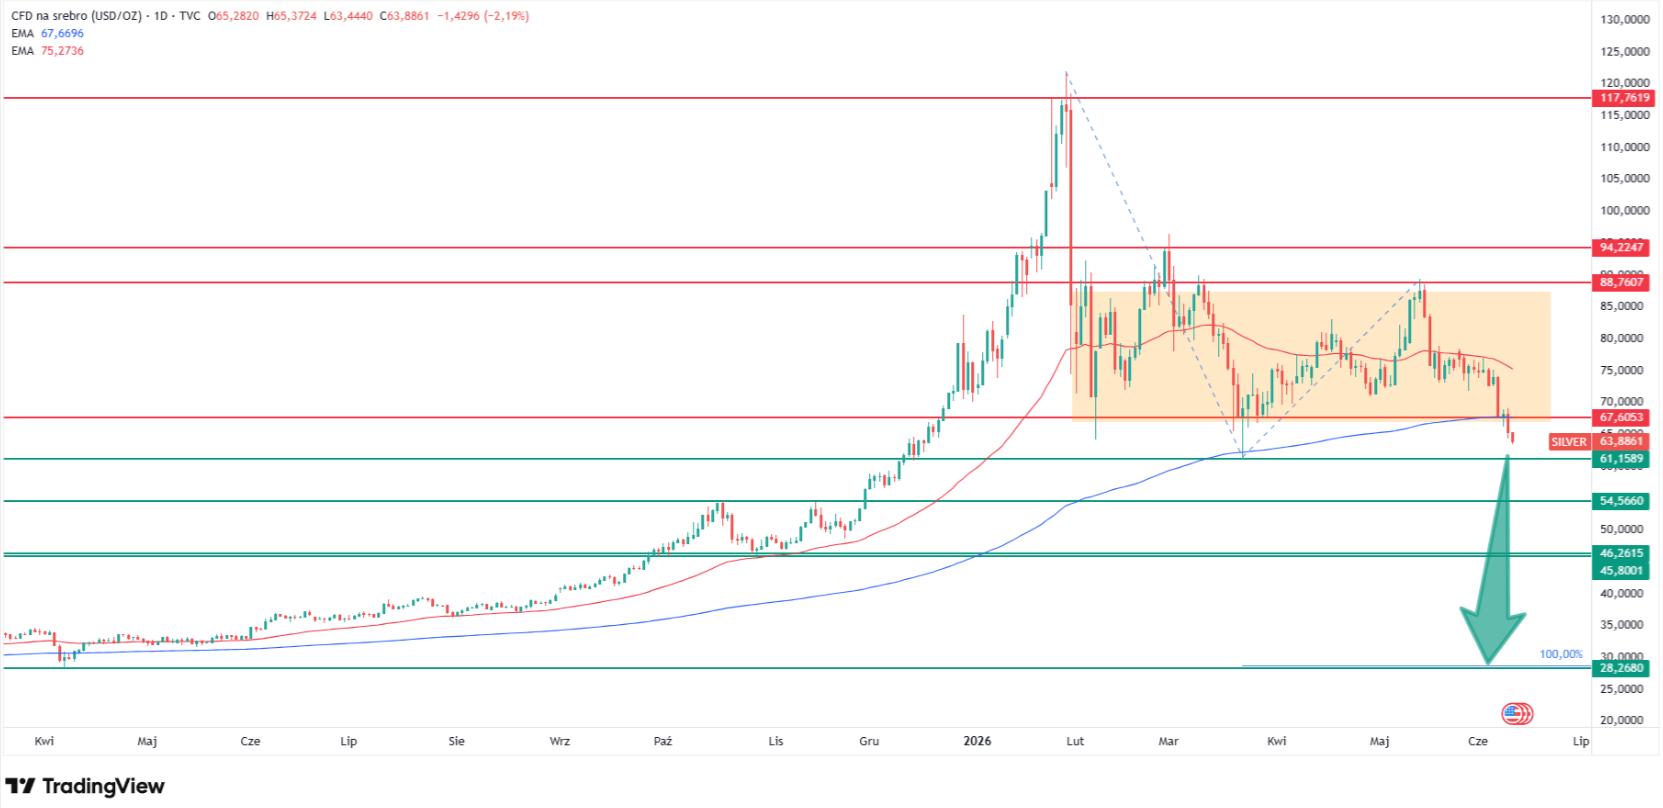
How Low Can Silver Go? Fibonacci
Extension Points to $30
Applying
Fibonacci extension analysis to the current move offers a more extreme - though
not impossible - scenario. Using the decline from the January all-time high to
the March lows as the base leg, and then projecting from the subsequent
recovery that took silver back toward $89 in early May, the 100% Fibonacci
extension of that corrective structure falls just below $30 per ounce.
That level
aligns with the April 2025 lows - the price level from which the entire rally
to $120 began. A return there would represent a 56% decline from
current prices and would essentially erase the entire historic silver rally of
2025-2026.
How low can silver go in 2026? Source: Tradingview.com
While that
is the outer boundary of the bear case rather than the base scenario, the
technical structure does not rule it out if key intermediate supports at $55
and $46 give way without resistance.
The industrial
demand argument has not disappeared. Silver's use in solar panels, EV
components, and AI data center infrastructure remains a structural tailwind
that distinguishes it from gold.
A sustained
bearish outlook is not guaranteed. Several catalysts could shift the picture:
A US-Iran peace deal that reduces oil price
pressure, eases inflation fears, and gives the Fed room to hold or cut
rates
A dovish Fed pivot or weaker-than-expected
inflation data pulling rate-hike expectations back below 30%
A sharp US dollar reversal reducing the cost of
holding silver for international buyers
Industrial demand data showing supply deficits
tightening faster than macro headwinds can weaken the price
As Kooijman
noted, "any clear progress toward a diplomatic resolution in the Middle
East could help reduce the pressure on silver." The metal's dual nature -
part safe-haven, part industrial input - means the catalysts for a recovery
could come from either direction.
But until
one of those catalysts materializes, the chart suggests the path of least
resistance remains lower.
FAQ, Silver Price Analysis
Why is the silver price
falling today?
Silver is
falling because the metal broke below its 200-day exponential moving average
this week for the first time since April 2025. The trigger was a
stronger-than-expected US jobs report on June 6, which doubled market
expectations, pushed Federal Reserve rate-hike odds above 50%, lifted Treasury
yields, and strengthened the US dollar - all factors that raise the cost of
holding non-yielding assets like silver.
How low can silver go?
The primary
bear target from current levels of $64 is $46 per ounce - the late-October 2025
lows - representing a potential further decline of around 28%. A Fibonacci
extension analysis applied to the corrective structure from January's all-time
high projects an outer target just below $30, which would mark a 56% decline
from current prices. The next key intermediate support before $46 is $55.
What is the silver price
prediction for 2026?
Institutional
forecasts remain wide. JPMorgan's range of $60 to $90 for 2026 still
technically encompasses current levels, while some analysts surveyed by Yahoo
Finance expect a year-end price above $80. More aggressive bull cases from Bank
of America ($135-$309) assume a return to the structural bull market. The
technical picture, however, now points to the $46-$55 zone as the near-term
destination, with $30 as a tail-risk scenario if major supports break.
Is silver still a good
investment in 2026?
Silver
retains long-term structural support from industrial demand in solar, EV, and
data center applications. However, the near-term macro environment - rising
interest rates, a strong dollar, and elevated energy prices - is creating
significant headwinds. Any investor assessing silver should factor in the
broken technical structure and the possibility of continued price weakness
before the industrial demand thesis reasserts itself.
Silver is
trading at $64 per ounce on Wednesday, 10 June, 2026, the lowest price in three
months, as a confluence of macro headwinds and technical deterioration pushes
the white metal into what analysts now classify as a confirmed downtrend.
The
silver price is going down for the second straight week, shedding nearly 6% so far this
week alone after losing 10% the week before. For context, silver hit an
all-time high above $120 per ounce in late January, meaning the metal has shed
nearly half its value in less than five months.
Why Silver Is Falling
Today? Macro Drivers
The drop
mirrors a broader selloff in precious metals. Gold has been
falling since last week, trading below $4,200 per ounce Wednesday and deepening its own
three-month lows. The catalyst for both moves was a blowout US jobs report
released on June 6, which showed nonfarm payrolls rising 172,000 - more than
twice the 85,000 expected - according to the Bureau of Labor Statistics.
The
mechanics behind why the silver price is going down extend
well beyond one jobs report. Several forces have been compounding since early
2026:
Driver
Impact on Silver
Strong US
jobs data (May NFP: 172k vs 85k est.)
Pushes
Fed rate-hike odds higher, raising cost of carry
Rising US
Treasury yields (10Y near 4.5%)
Reduces
appeal of non-yielding metals
Stronger US dollar
Makes
dollar-denominated silver more expensive abroad
Forced
early liquidations that started the initial selloff
Bas
Kooijman, CEO and co-founder of DHF Capital, put it plainly: "Silver
prices stabilized to a certain extent after a decline last week. The metal
benefited from a retreat in the US dollar and bond yields following a decline
in oil prices and inflation fears to some extent.”
He added
that "the monetary policy backdrop continues to present challenges for
silver," noting that a return to Middle East tensions "could lift oil
prices and bond yields and weigh on silver" - a scenario that appears to
be playing out precisely.
Silver Price Technical
Analysis: The 200 EMA Break
The most
consequential technical development this week is the break of the
200-day exponential moving average (200 EMA), a threshold widely regarded
as the dividing line between bull and bear regimes.
This is the
first time silver has traded beneath that level since mid-April 2025 - a
stretch of more than 13 months during which the metal rallied from around $30
to its January peak above $120, a gain of roughly 300%.
To put that
into perspective: in April 2025, the 200 EMA break proved short-lived, quickly
reversed as bulls defended the level. A similar brief test occurred around the
turn of 2025, when silver dipped below the average only to bounce. The last
sustained period below the 200 EMA before this week goes back to July 2023 -
nearly three years ago - which illustrates just how powerful and durable the
silver bull market was.
The technical analysis of XAG/USD chart. Source: Tradingview.com
The break
is not merely a data point. It signals that the structural floor supporting the
rally has given way.
The Consolidation Zone Is
Gone
For most of
the period from early February through the end of May, silver had been
oscillating in a well-defined range, broadly between $67 and just below $89.
This week's
move below the 200 EMA has broken out of that consolidation zone entirely. When
multiple layers of support converge at the same price level - in this case the
200 EMA, the lower boundary of the February-to-May range, and prior structural
highs - traders call it a "confluence." Breaking that
confluence now opens the chart to a fresh leg lower.
Here is
where the XAGUSD hi-lo picture stands right now, and the
levels that will define price action in the weeks ahead:
Level
Price
Significance
Current price
$64
3-month low, below 200 EMA
First support target
$61
March
2026 year-to-date lows
Key structural support
$55
October/November
2025 highs, now acting as support
Bear target (primary)
$46
Late
October 2025 lows, 28% downside from here
Fibonacci extension target
$30
100% of
the Jan-to-Mar decline, projected from May peak; 56% downside
The $61
level will be the first test. That level represents the year-to-date low set in
March, and a failure there would shift attention toward $55 -
the zone carved by October and November 2025 highs, which now serve as major
structural support.
The primary
bear case places the downside target at approximately $46 per ounce,
corresponding to the late-October 2025 lows. From the current $64 level, that
represents a decline of roughly 28%. It is worth remembering that silver fell
from $121 to below $60 inside of weeks earlier this year, so moves of this
magnitude are not without precedent in this market.
How Low Can Silver Go? Fibonacci
Extension Points to $30
Applying
Fibonacci extension analysis to the current move offers a more extreme - though
not impossible - scenario. Using the decline from the January all-time high to
the March lows as the base leg, and then projecting from the subsequent
recovery that took silver back toward $89 in early May, the 100% Fibonacci
extension of that corrective structure falls just below $30 per ounce.
That level
aligns with the April 2025 lows - the price level from which the entire rally
to $120 began. A return there would represent a 56% decline from
current prices and would essentially erase the entire historic silver rally of
2025-2026.
How low can silver go in 2026? Source: Tradingview.com
While that
is the outer boundary of the bear case rather than the base scenario, the
technical structure does not rule it out if key intermediate supports at $55
and $46 give way without resistance.
The industrial
demand argument has not disappeared. Silver's use in solar panels, EV
components, and AI data center infrastructure remains a structural tailwind
that distinguishes it from gold.
A sustained
bearish outlook is not guaranteed. Several catalysts could shift the picture:
A US-Iran peace deal that reduces oil price
pressure, eases inflation fears, and gives the Fed room to hold or cut
rates
A dovish Fed pivot or weaker-than-expected
inflation data pulling rate-hike expectations back below 30%
A sharp US dollar reversal reducing the cost of
holding silver for international buyers
Industrial demand data showing supply deficits
tightening faster than macro headwinds can weaken the price
As Kooijman
noted, "any clear progress toward a diplomatic resolution in the Middle
East could help reduce the pressure on silver." The metal's dual nature -
part safe-haven, part industrial input - means the catalysts for a recovery
could come from either direction.
But until
one of those catalysts materializes, the chart suggests the path of least
resistance remains lower.
FAQ, Silver Price Analysis
Why is the silver price
falling today?
Silver is
falling because the metal broke below its 200-day exponential moving average
this week for the first time since April 2025. The trigger was a
stronger-than-expected US jobs report on June 6, which doubled market
expectations, pushed Federal Reserve rate-hike odds above 50%, lifted Treasury
yields, and strengthened the US dollar - all factors that raise the cost of
holding non-yielding assets like silver.
How low can silver go?
The primary
bear target from current levels of $64 is $46 per ounce - the late-October 2025
lows - representing a potential further decline of around 28%. A Fibonacci
extension analysis applied to the corrective structure from January's all-time
high projects an outer target just below $30, which would mark a 56% decline
from current prices. The next key intermediate support before $46 is $55.
What is the silver price
prediction for 2026?
Institutional
forecasts remain wide. JPMorgan's range of $60 to $90 for 2026 still
technically encompasses current levels, while some analysts surveyed by Yahoo
Finance expect a year-end price above $80. More aggressive bull cases from Bank
of America ($135-$309) assume a return to the structural bull market. The
technical picture, however, now points to the $46-$55 zone as the near-term
destination, with $30 as a tail-risk scenario if major supports break.
Is silver still a good
investment in 2026?
Silver
retains long-term structural support from industrial demand in solar, EV, and
data center applications. However, the near-term macro environment - rising
interest rates, a strong dollar, and elevated energy prices - is creating
significant headwinds. Any investor assessing silver should factor in the
broken technical structure and the possibility of continued price weakness
before the industrial demand thesis reasserts itself.
Damian Chmiel is a Senior Analyst & Editor at Finance Magnates with more than 15 years of experience in the CFD and online trading industry. Active as both a trader and journalist since 2010, he focuses on broker coverage, fintech innovation, and regulatory developments across Europe, the Middle East, and Asia.
His work includes interviews with C-level leaders at major brokerages and fintech platforms, as well as co-authoring Finance Magnates’ quarterly industry benchmarking reports. Damian’s reporting is data-driven, market-aware, and grounded in direct industry engagement. His analysis and commentary have also been cited by external media outlets, including Investing.com, Binance, The Asset, Stockhead, and Dispatch.
Education:
MA in Finance and Accounting, Cracow University of Economics
Belgian Police Arrest Teen in €500K Phishing and Crypto Laundering Scheme
Featured Videos
FM Daily Brief – 21 July 2026
FM Daily Brief – 21 July 2026
FM Daily Brief – 21 July 2026
FM Daily Brief – 21 July 2026
Today's Tuesday, the 21st of July 2026, and these are our main stories: has BDSwiss’s offshore been shuttered? Esma reports strong growth in cross border retail investing across Europe, and the London Stock Exchange plans overnight trading.
Today's Tuesday, the 21st of July 2026, and these are our main stories: has BDSwiss’s offshore been shuttered? Esma reports strong growth in cross border retail investing across Europe, and the London Stock Exchange plans overnight trading.
Today's Tuesday, the 21st of July 2026, and these are our main stories: has BDSwiss’s offshore been shuttered? Esma reports strong growth in cross border retail investing across Europe, and the London Stock Exchange plans overnight trading.
Today's Tuesday, the 21st of July 2026, and these are our main stories: has BDSwiss’s offshore been shuttered? Esma reports strong growth in cross border retail investing across Europe, and the London Stock Exchange plans overnight trading.
Fintech Education Explained: How Finance Magnates Academy Helps You Build a Career
Fintech Education Explained: How Finance Magnates Academy Helps You Build a Career
Fintech Education Explained: How Finance Magnates Academy Helps You Build a Career
Fintech Education Explained: How Finance Magnates Academy Helps You Build a Career
Fintech Education Explained: How Finance Magnates Academy Helps You Build a Career
Fintech Education Explained: How Finance Magnates Academy Helps You Build a Career
What does it take to build a successful career in fintech?
In this exclusive interview, Dora Christofi, Head of Marketing at Finance Magnates, sits down with Jeff Patterson, Head of Education at Finance Magnates Academy, to discuss why fintech education has become more important than ever.
They explore how Finance Magnates Academy is helping students, professionals, career changers, HR teams, and fintech companies build practical industry knowledge through expert-led courses and recognised certifications.
In this interview:
✅ Why fintech needs specialised education
✅ The difference between theory and practical learning
✅ How Finance Magnates Academy prepares professionals for real careers
✅ The value of industry-recognised certifications
✅ How companies can improve employee onboarding and training
✅ What's coming next for Finance Magnates Academy
Whether you're looking to start a career in fintech, grow within the financial services industry, or improve your team's onboarding process, this conversation offers valuable insights from one of the industry's leading education initiatives.
Learn more about Finance Magnates Academy:
👉 https://academy.financemagnates.com
About Finance Magnates Academy
Finance Magnates Academy provides practical fintech education through expert-led courses, professional certifications, and corporate training. Designed for individuals and organisations, the Academy helps professionals build real-world skills across brokerage operations, trading, compliance, payments, financial markets, and fintech.
Connect with Finance Magnates
🌐 Website: https://www.financemagnates.com
🔗 LinkedIn: https://www.linkedin.com/company/finance-magnates
📺 Subscribe for more interviews, market insights, and fintech education.
#Fintech #FintechEducation #FinanceMagnates #FintechCareers #FinancialServices #CorporateTraining #OnlineLearning #FintechTraining
The FX & CFD Market Is Changing Fast. Here's What's Coming Next (2026)
The FX & CFD Market Is Changing Fast. Here's What's Coming Next (2026)
The FX & CFD Market Is Changing Fast. Here's What's Coming Next (2026)
The FX & CFD Market Is Changing Fast. Here's What's Coming Next (2026)
The FX & CFD Market Is Changing Fast. Here's What's Coming Next (2026)
The FX & CFD Market Is Changing Fast. Here's What's Coming Next (2026)
Where is the FX & CFD industry really heading in 2026?
In this free Finance Magnates Intelligence masterclass, industry experts explore the latest data shaping the global FX & CFD market, how regulation and regional demand influence expansion planning, and how brokerages benchmark performance across 265 firms on the FM Intelligence Portal.
In this session you'll learn:
✔ Where the FX/CFD industry is heading in H2 2026
✔ Why compliance should guide regional expansion decisions
✔ How internal performance compares when benchmarked against 265 brokers
✔ Regional demand shifts across Europe, APAC, and LATAM
✔Broker volume rankings, verification, and FM Intelligence Portal data
Speakers:
• Ramzi Ahmad, Director of Intelligence, Finance Magnates
• Sylwester Majewski, Head of Insights & Reporting Hub, Finance Magnates
• Philios Petrides, Data & Business Intelligence Consultant
If you work in brokerage, fintech, compliance, business development or market strategy, this session offers practical insights backed by verified industry data.
Access the FM Intelligence Portal at: https://datalab.financemagnates.com/
🔔 Subscribe to Finance Magnates for more webinars, interviews and market intelligence covering the global online trading industry.
#FinanceMagnates #FX #CFD #Fintech #Trading #Brokerage #MarketIntelligence #RegTech #Compliance #Forex
How Finance Leaders Adapt to Change | iFX EXPO
How Finance Leaders Adapt to Change | iFX EXPO
How Finance Leaders Adapt to Change | iFX EXPO
How Finance Leaders Adapt to Change | iFX EXPO
How Finance Leaders Adapt to Change | iFX EXPO
How Finance Leaders Adapt to Change | iFX EXPO
Markets never stop changing.
We asked finance executives for their number one success tip, and many came back to the same idea: adapt, stay informed and keep looking ahead.
Featuring executives from Shift Markets, Letknow Pay, Base Markets and SPAYZ.io.
#FinanceMagnates #Leadership #BusinessStrategy #Fintech #Shorts
FM Daily Brief – 20 July 2026
FM Daily Brief – 20 July 2026
FM Daily Brief – 20 July 2026
FM Daily Brief – 20 July 2026
FM Daily Brief – 20 July 2026
FM Daily Brief – 20 July 2026
Today's Monday, the 20th of July 2026, and these are our main stories: two brokers surpass the two-trillion-dollar monthly trading volume mark, Asic posts a record year for civil penalties, and Jump Trading expands its prediction markets team.
Today's Monday, the 20th of July 2026, and these are our main stories: two brokers surpass the two-trillion-dollar monthly trading volume mark, Asic posts a record year for civil penalties, and Jump Trading expands its prediction markets team.
Today's Monday, the 20th of July 2026, and these are our main stories: two brokers surpass the two-trillion-dollar monthly trading volume mark, Asic posts a record year for civil penalties, and Jump Trading expands its prediction markets team.
Today's Monday, the 20th of July 2026, and these are our main stories: two brokers surpass the two-trillion-dollar monthly trading volume mark, Asic posts a record year for civil penalties, and Jump Trading expands its prediction markets team.
Today's Monday, the 20th of July 2026, and these are our main stories: two brokers surpass the two-trillion-dollar monthly trading volume mark, Asic posts a record year for civil penalties, and Jump Trading expands its prediction markets team.
Today's Monday, the 20th of July 2026, and these are our main stories: two brokers surpass the two-trillion-dollar monthly trading volume mark, Asic posts a record year for civil penalties, and Jump Trading expands its prediction markets team.