

XRP slipped 0.55% to approximately $1.0055 at 07:07 UTC on Tuesday, August 11, extending Monday's decline. The token broke below its June lows and traded at its weakest level since November 2024.
The move also pushed XRP through the $1.0138 support area. Price has not yet confirmed a break below $1, but parity is now the only immediate barrier separating XRP from substantially lower historical levels.
XRP Tests the $1 Level Flagged in July
The current move activates the risk described in my July 7 XRP analysis. At the time, XRP traded near $1.13, and I identified $1 as the final support before a staged decline toward levels last traded in 2024.
The daily chart now shows XRP at that decision point. Tuesday's price moved below the June support near $1.0138, although a sustained break or daily close below $1 would provide stronger confirmation than a brief intraday move.
- How High Can XRP Go? This Trader New Price Prediction Targets $20 Level
- Why Is XRP Going Up Today? XRP Price Prediction Targets $1.80 and $2.00
- Why Is XRP Going Up? ETH and XRP Prices Surge as Crypto Rally Extends to $73K Bitcoin
The trend remains bearish above that level as well. XRP trades below its 50-day exponential moving average at approximately $1.0962. This average has acted as dynamic resistance since the market lost momentum earlier this year.
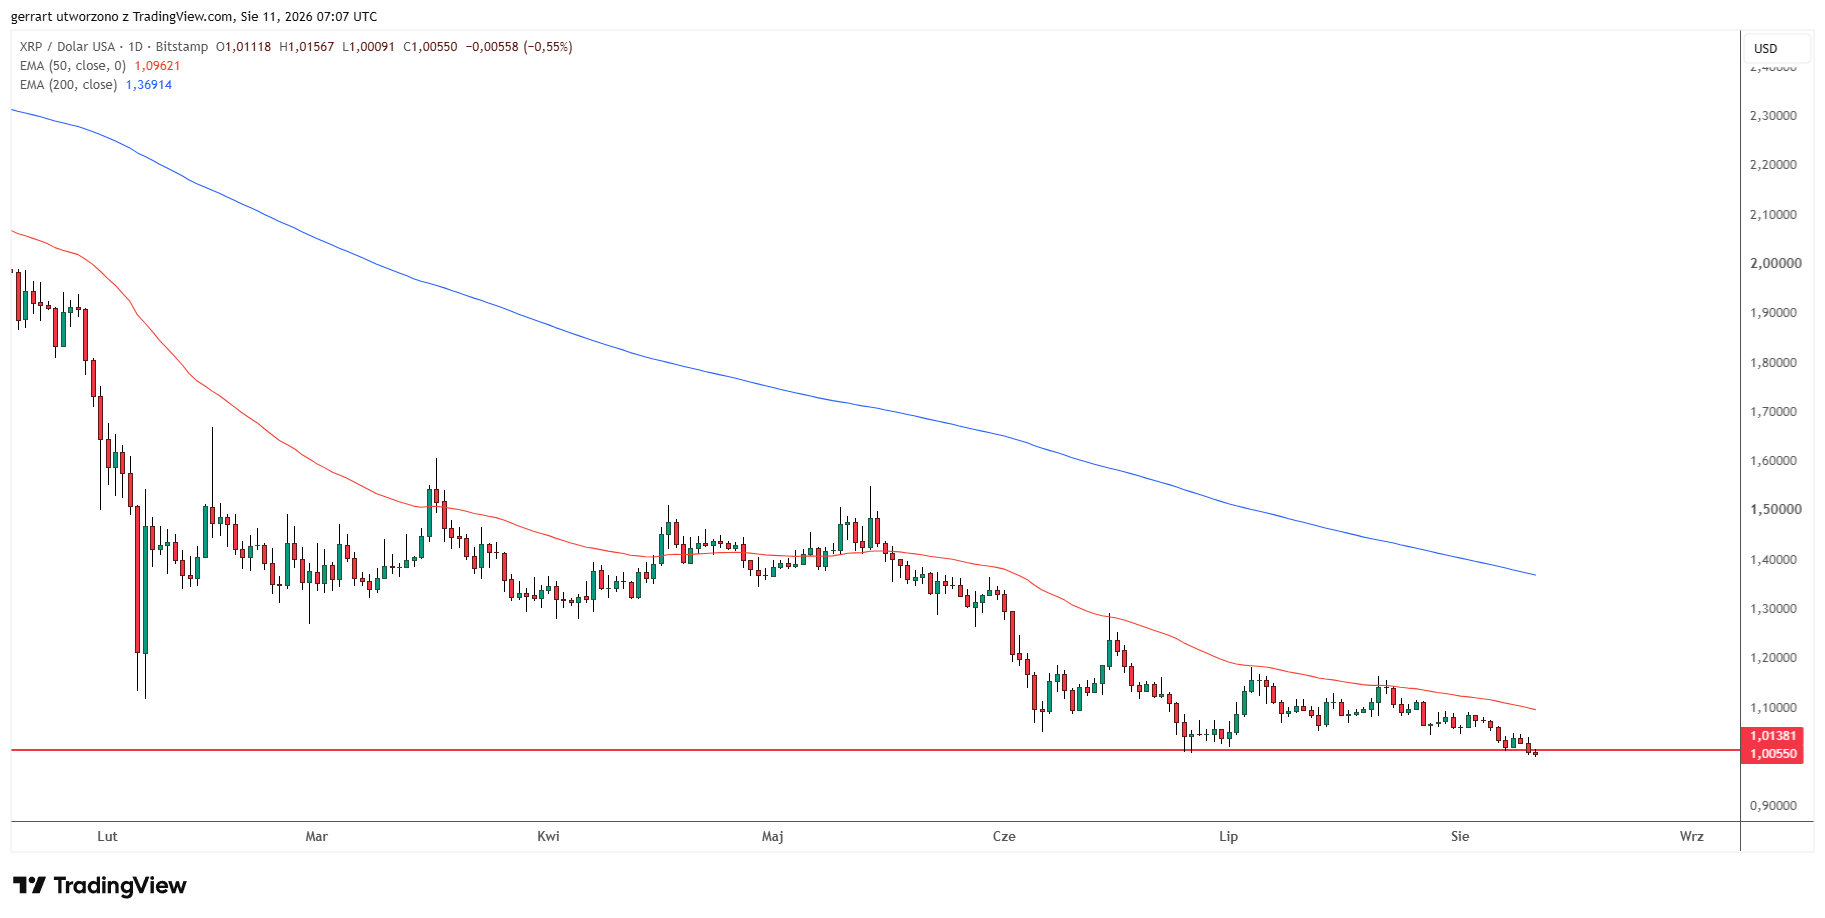
The 200-day EMA is much higher at approximately $1.3691. XRP would need to gain about 36% from Tuesday's price merely to test that longer-term trend boundary.
| Scenario | Confirmation | Target | Invalidation |
|---|---|---|---|
| Parity holds | XRP recovers above $1.0138 | 50-day EMA near $1.0962 | Daily close below $1 |
| First bearish target | Confirmed loss of $1 | $0.6422, about 36% lower | Recovery above $1.0138 |
| Extended decline | $0.6422 also fails | $0.4279, about 57% lower | Return above $0.6422 |
| Structural recovery | Break above both daily EMAs | Above $1.3691 | Rejection below the 200-day EMA |
A Parity Break Exposes $0.64 and $0.43
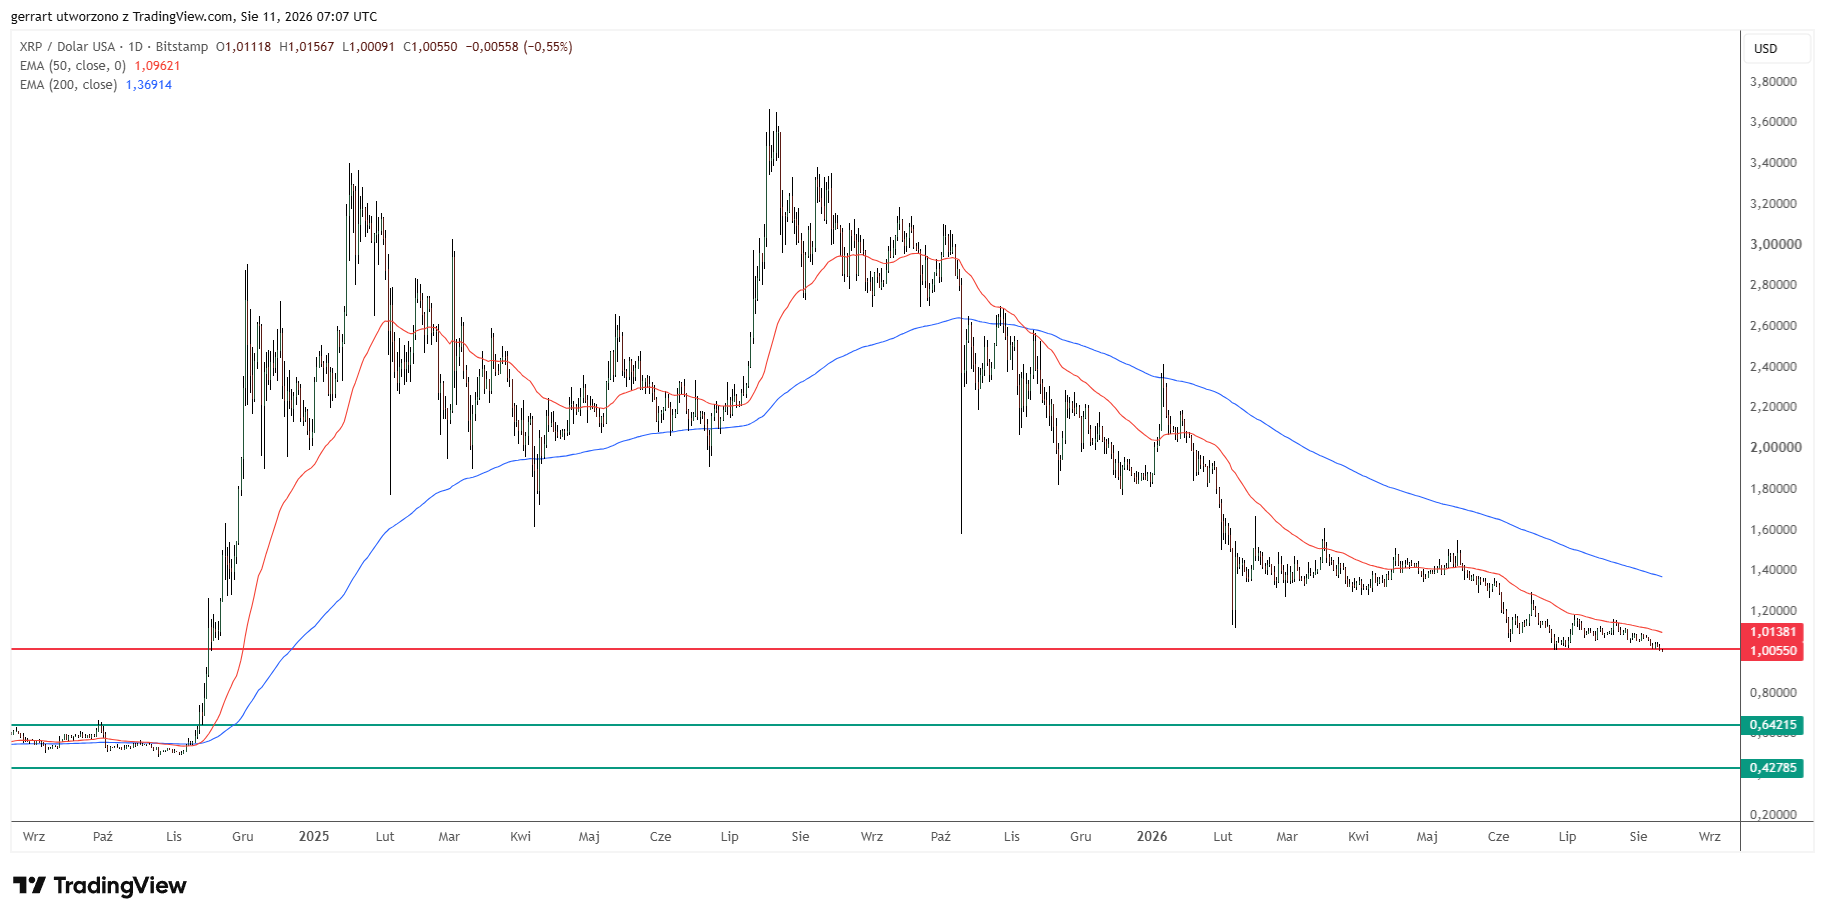
The first target on my longer-term chart is $0.6422. This area capped XRP several times between July and September 2024, before the token's November breakout carried it above $1.
A decline from $1.0055 to $0.6422 would cut approximately 36% from XRP's value. The level is close to the first downside area identified in my July analysis, which placed historical support near $0.67.
The second target sits at $0.4279, about 57% below Tuesday's price. This area covers the 2024 lows and the base XRP formed before the rally that began in November of that year.
That target also updates the bearish scenario from my June analysis, which placed the next major downside objective near $0.53. The new chart uses the full 2024 structure and shows that a failure at $0.64 could extend the decline toward $0.43.
Neither target becomes automatic after a single trade below $1. A daily close beneath parity, followed by an unsuccessful attempt to recover the level, would provide stronger evidence that the breakdown is holding.
What Would Invalidate the Bearish XRP Price Prediction?
The first improvement would be a return above the broken $1.0138 support. That would reduce the immediate breakdown risk, but it would leave XRP below both daily moving averages.
A move above the 50-day EMA near $1.0962 would be the first evidence that short-term selling pressure is easing. XRP would still face the 200-day EMA near $1.3691, which remains the more important test of the broader trend.
The gap between price and the moving averages also puts bullish institutional forecasts into perspective. Standard Chartered's Geoffrey Kendrick previously projected XRP could reach $8 by the end of 2026 under assumptions including substantial ETF inflows, as detailed in an earlier XRP price prediction comparison.
Reaching $8 from Tuesday's price would require a gain of approximately 696%. The daily chart currently offers no technical confirmation for that scenario while XRP remains below $1.0138, the 50-day EMA and the 200-day EMA.
A recovery above $1.0962 would weaken the immediate bearish setup. A sustained move above $1.3691 would provide the first structural reason to reconsider the targets at $0.6422 and $0.4279.


