
Will Bitcoin Hit $100,000? BTC Posts Best Quarter Since 2024 With 42% Rally

Monday, 05/10/2026 | 09:15 GMT by Damian Chmiel
  • The third-quarter gain ended a run of three losing quarters and lifted the price back into the range that held for most of the past year.
  • A barrier near $87,000 has turned the price back twice since September 21, with little resistance above it before six figures.
The picture of Bitcoin token in the forefront with a candle chart in the background.
Bitcoin token with a candle chart in the background. Source: Shutterstock

Bitcoin (BTC) traded near $86,250 on Binance today (Monday), after closing the third quarter 42.6% higher at $83,624. It was the cryptocurrency's best quarter since the final three months of 2024, when it gained 47.8%.

The rally ended a run of three losing quarters. Spot bitcoin ETFs took in about $3.1 billion over nine September sessions, according to Oliver Carding, head of marketing at Tesseract Group.

My charts now put the next decision at $87,000, a level that has turned BTC back twice since September 21.

London's trading industry is coming home!

Why Did Bitcoin Have Its Best Quarter Since 2024?

On my quarterly chart, Bitcoin bounced from support near $58,700. It is the level of the 2021 highs, and the price retested it as support in early 2024 and again later that year.

Last time, contact with this zone sent BTC toward a new all-time high, which it set near $126,200 in October 2025. Whether the pattern repeats is harder to say. The top of the current consolidation on the higher timeframes sits at $114,277, about 32% above the current price.
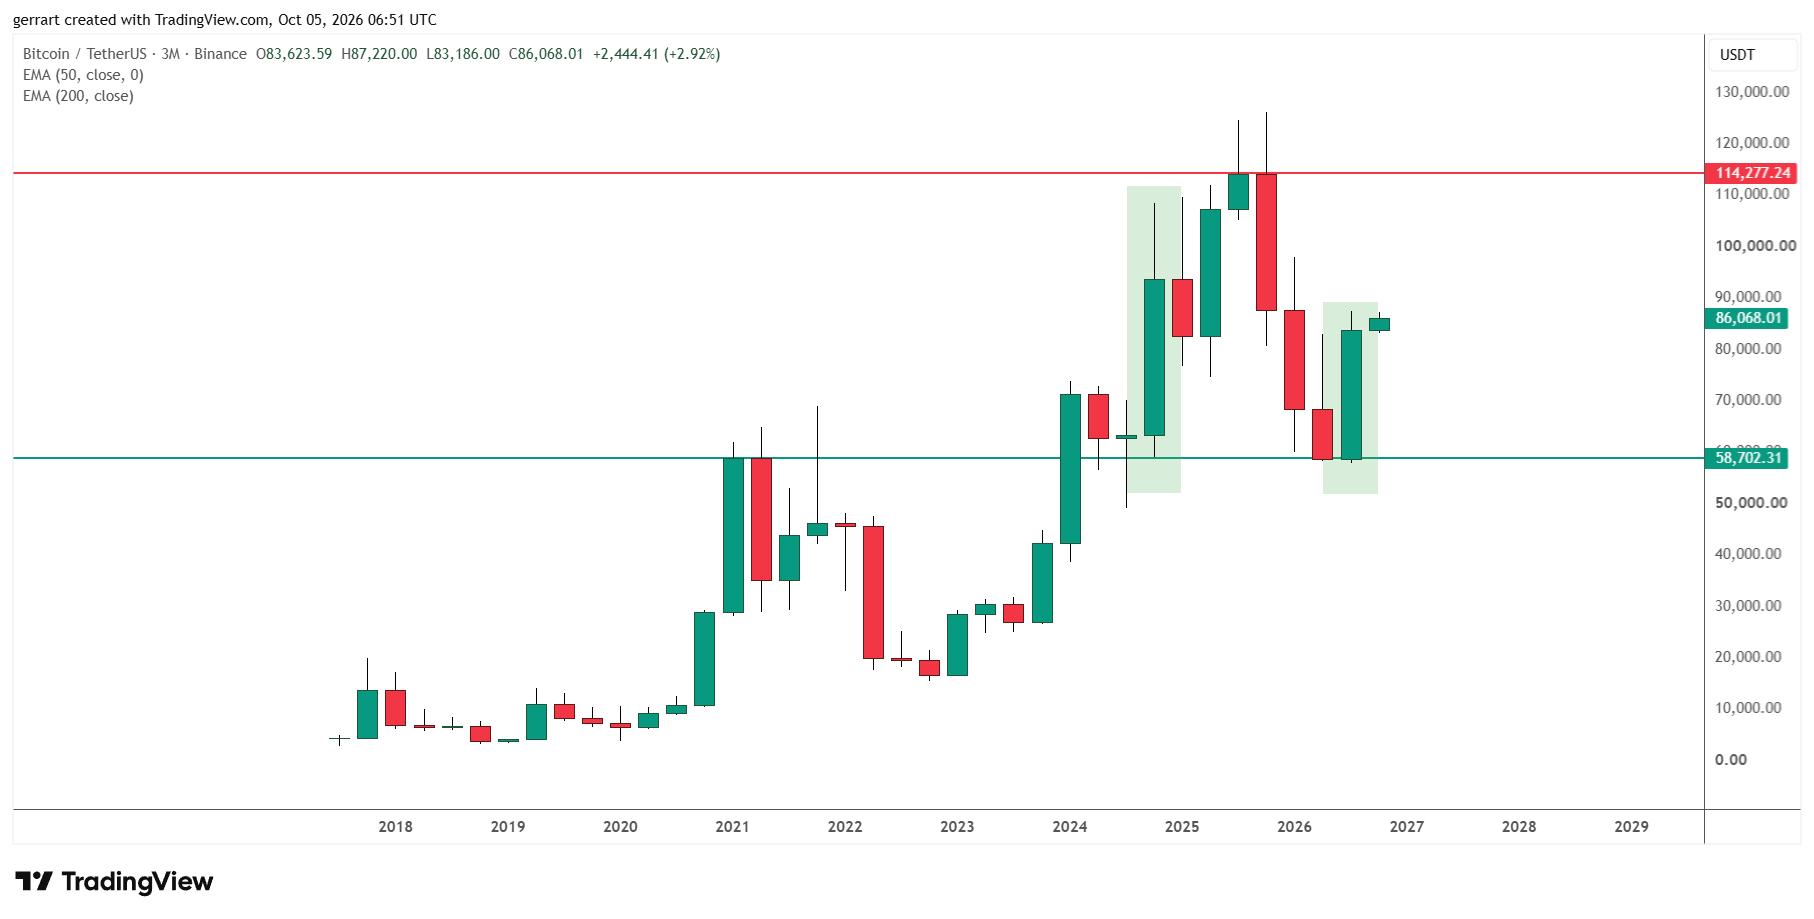
Bitcoin bounced from 2021-era support after three losing quarters. Source: TradingView, Binance.

The quarterly close also kept alive the call from my September 22 bitcoin analysis, which flagged the breakout above $82,614 and set targets up to $100,000.

The gain came even as bond yields climbed. Maxime Seiler, CEO and co-founder of STS Digital, said the usual link between the two had broken.

"Since July, the 10-year yield has jumped more than 80 basis points to around 5.3%, while Bitcoin is up 45%. In the old playbook, a bond move like that would have crushed risk assets," Seiler said.

What Does the Monthly Chart Say About Bitcoin?

BTC has now risen for three straight months, gaining 7.3% in July, 25% in August and 6.4% in September. That is its first run of three monthly gains since April to July 2025, when four straight advances carried it toward record highs.

The quarterly support is reinforced on the monthly chart by the 50-month exponential moving average, now near $67,434. The September close at $83,624 was the highest monthly close since December 2025.

Above the current price, I see no serious resistance on the monthly chart. The natural next level is $100,000.
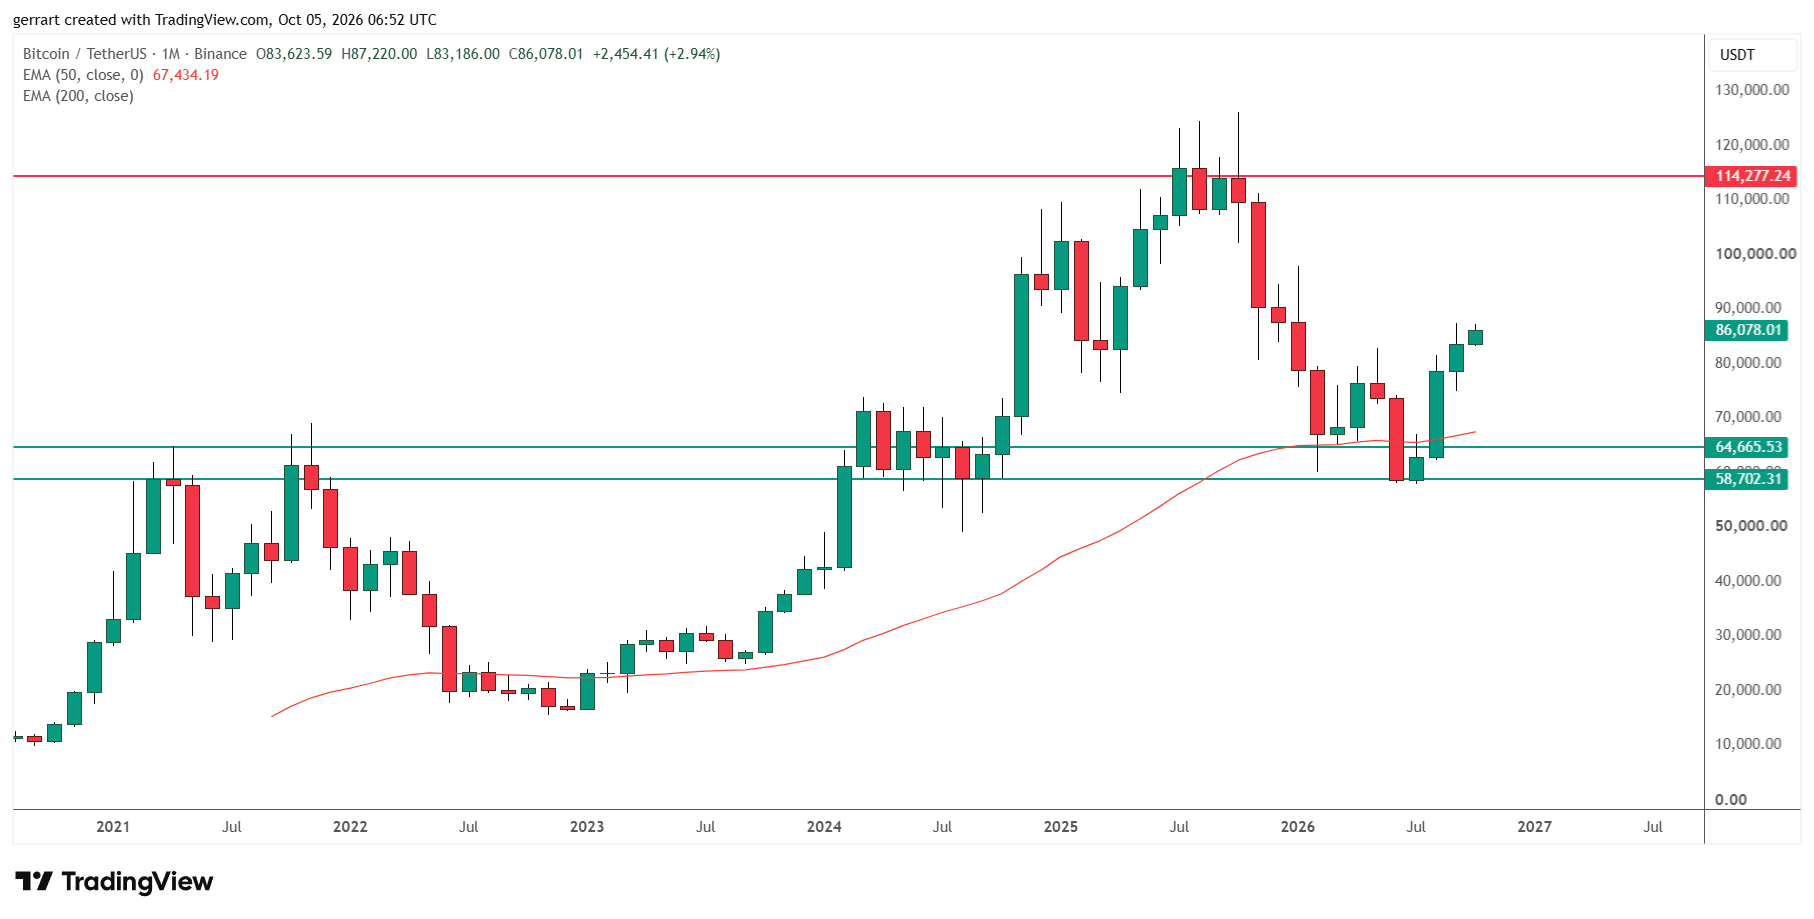
Bitcoin posted three green monthly candles above its 50-month EMA. Source: TradingView, Binance.

Why Is $87,000 the Level to Watch?

The weekly chart shows local resistance near $86,976, a level set by the lows of late 2025. It could cap further gains for now, even though last week's close at $86,530 was the highest weekly close since the week of January 19.
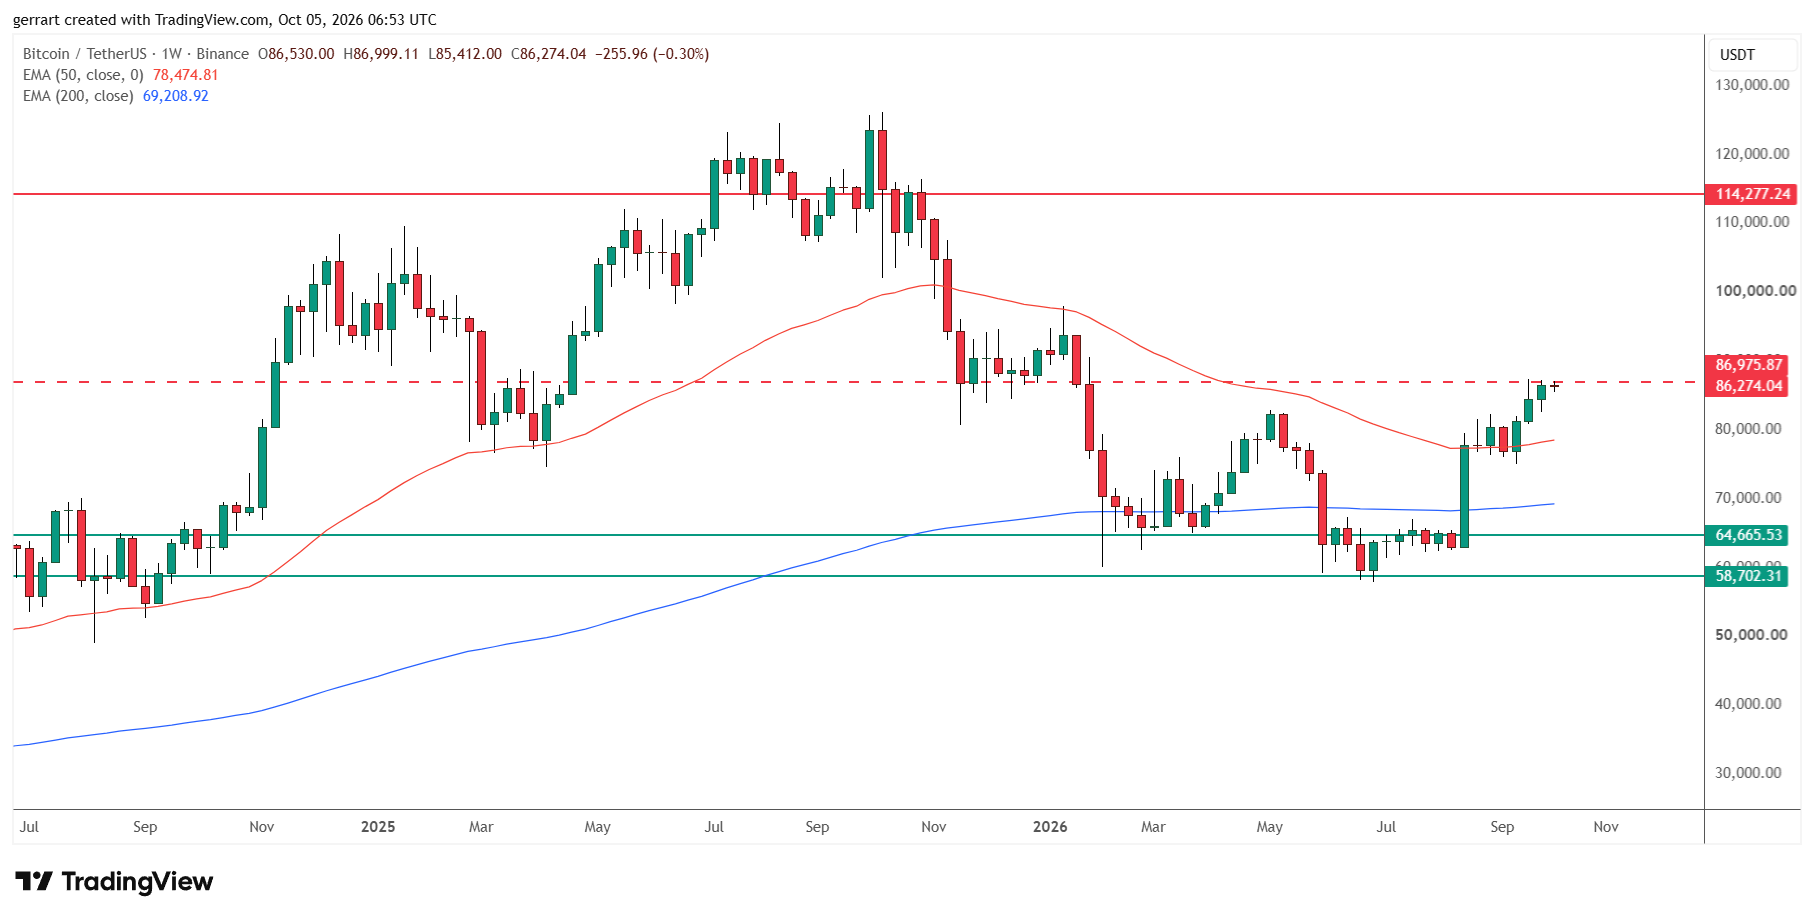
Bitcoin is testing weekly resistance set by lows from late 2025. Source: TradingView, Binance.

The daily chart shows it more precisely. BTC peaked at $87,396 on September 21 and at $87,220 on October 2, and both times the price pulled back from the $87,100 area. This year's opening price of $87,648 sits just above it.

On the other hand, the May highs near $82,206, which still acted as resistance in late August and early September, were broken decisively and now act as new support.

That support held during the pullback covered on September 24, and BTC has not closed a day below $83,500 since. The 50-day exponential moving average at $79,188 is above the 200-day average at $74,985, and both are rising.
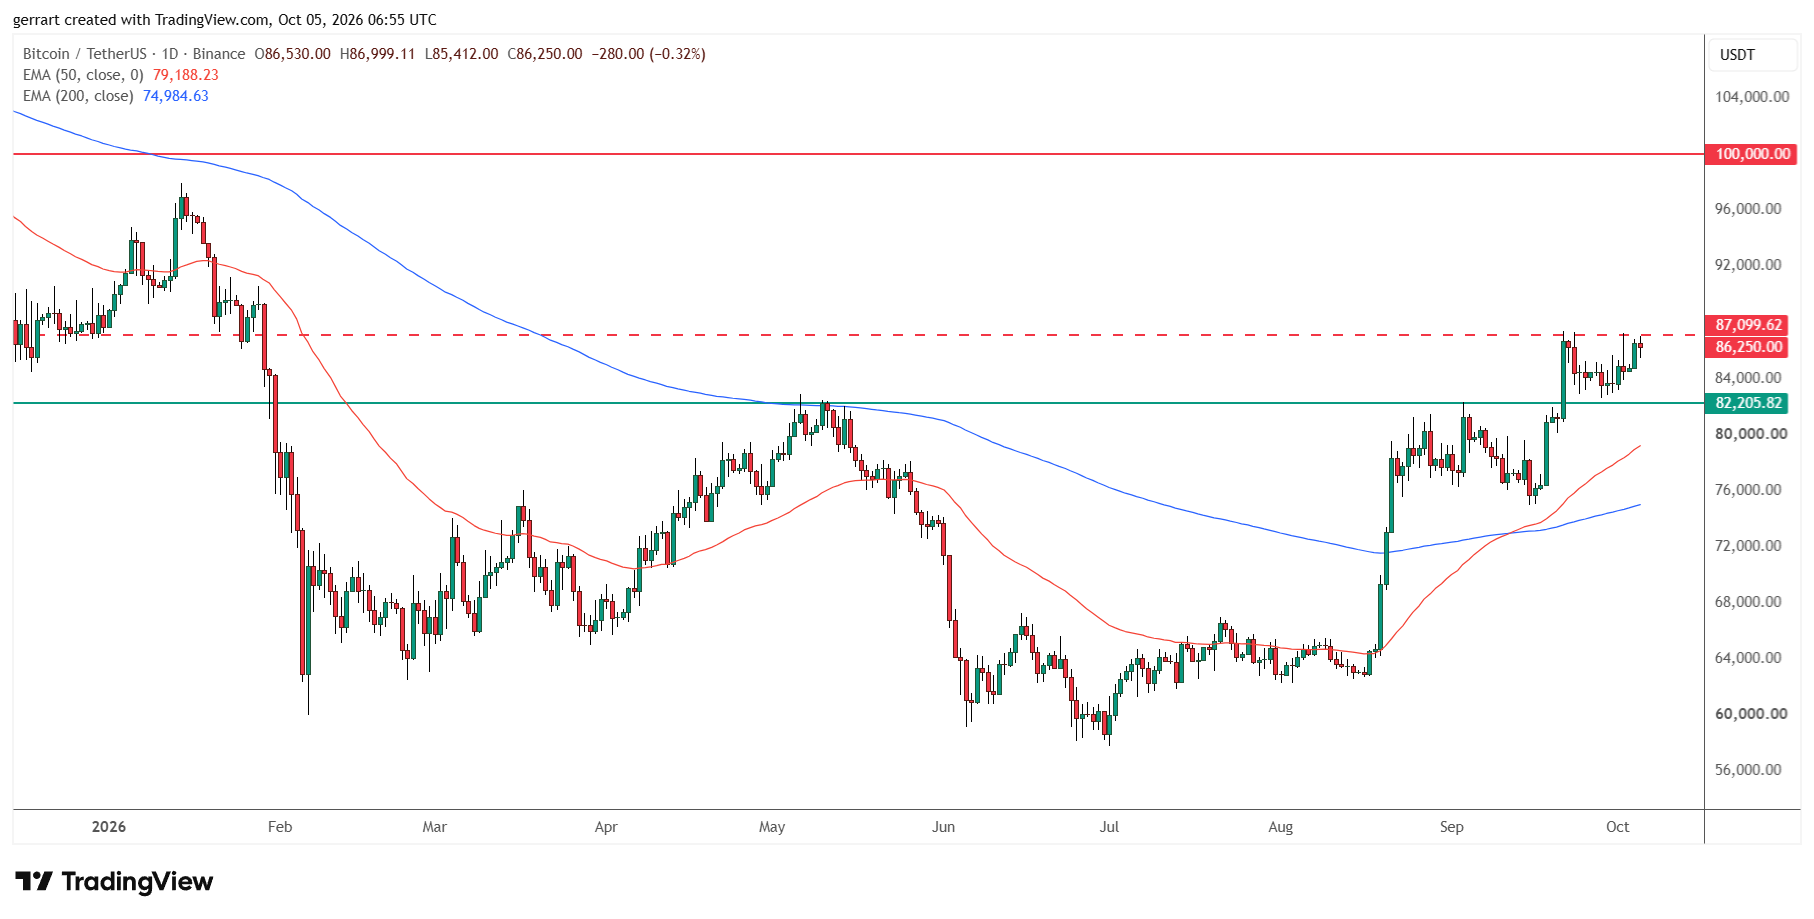
Bitcoin is trading between $82,206 support and $87,100 resistance. Source: TradingView, Binance.

If BTC clears $87,000, my base case is that the move toward $100,000 is fully open, about 15% above the resistance.

Paul Howard, senior director at Wincent, said his expectation for bitcoin to break $100,000 by year-end remains intact, adding that a sustained break above $90,000 could meet relatively limited resistance.

ScenarioConfirmationTargetInvalidation
BreakoutDaily close above $87,100$100,000Return below $87,000
RangeRejection at $87,100$82,206 supportDaily close above $87,100
BreakdownDaily close below $82,20650-day EMA near $79,188Recovery above $82,206

What Could Stop the Bitcoin Rally?

The main risk is rates. Carding pointed to the first net ETF outflow since September 16, about $149 million on September 30, and to the 10-year real yield , which closed that day at 2.93%.

"I use a 10-year real yield of about 3% as a monitoring level, and a sustained move above it would make a retest of $80,000 to $82,000 more likely than a run at $90,000," Carding said.

That band is where BTC traded on September 18, three days before the breakout, when bitcoin topped $80,000 as ether, XRP and dogecoin rose.

A daily close below $82,206 would push BTC back into its August and September range. On the quarterly chart, the bullish case holds as long as the price stays above $58,700.

Bitcoin (BTC) traded near $86,250 on Binance today (Monday), after closing the third quarter 42.6% higher at $83,624. It was the cryptocurrency's best quarter since the final three months of 2024, when it gained 47.8%.

The rally ended a run of three losing quarters. Spot bitcoin ETFs took in about $3.1 billion over nine September sessions, according to Oliver Carding, head of marketing at Tesseract Group.

My charts now put the next decision at $87,000, a level that has turned BTC back twice since September 21.

London's trading industry is coming home!

Why Did Bitcoin Have Its Best Quarter Since 2024?

On my quarterly chart, Bitcoin bounced from support near $58,700. It is the level of the 2021 highs, and the price retested it as support in early 2024 and again later that year.

Last time, contact with this zone sent BTC toward a new all-time high, which it set near $126,200 in October 2025. Whether the pattern repeats is harder to say. The top of the current consolidation on the higher timeframes sits at $114,277, about 32% above the current price.

Bitcoin bounced from 2021-era support after three losing quarters. Source: TradingView, Binance.

The quarterly close also kept alive the call from my September 22 bitcoin analysis, which flagged the breakout above $82,614 and set targets up to $100,000.

The gain came even as bond yields climbed. Maxime Seiler, CEO and co-founder of STS Digital, said the usual link between the two had broken.

"Since July, the 10-year yield has jumped more than 80 basis points to around 5.3%, while Bitcoin is up 45%. In the old playbook, a bond move like that would have crushed risk assets," Seiler said.

What Does the Monthly Chart Say About Bitcoin?

BTC has now risen for three straight months, gaining 7.3% in July, 25% in August and 6.4% in September. That is its first run of three monthly gains since April to July 2025, when four straight advances carried it toward record highs.

The quarterly support is reinforced on the monthly chart by the 50-month exponential moving average, now near $67,434. The September close at $83,624 was the highest monthly close since December 2025.

Above the current price, I see no serious resistance on the monthly chart. The natural next level is $100,000.

Bitcoin posted three green monthly candles above its 50-month EMA. Source: TradingView, Binance.

Why Is $87,000 the Level to Watch?

The weekly chart shows local resistance near $86,976, a level set by the lows of late 2025. It could cap further gains for now, even though last week's close at $86,530 was the highest weekly close since the week of January 19.

Bitcoin is testing weekly resistance set by lows from late 2025. Source: TradingView, Binance.

The daily chart shows it more precisely. BTC peaked at $87,396 on September 21 and at $87,220 on October 2, and both times the price pulled back from the $87,100 area. This year's opening price of $87,648 sits just above it.

On the other hand, the May highs near $82,206, which still acted as resistance in late August and early September, were broken decisively and now act as new support.

That support held during the pullback covered on September 24, and BTC has not closed a day below $83,500 since. The 50-day exponential moving average at $79,188 is above the 200-day average at $74,985, and both are rising.

Bitcoin is trading between $82,206 support and $87,100 resistance. Source: TradingView, Binance.

If BTC clears $87,000, my base case is that the move toward $100,000 is fully open, about 15% above the resistance.

Paul Howard, senior director at Wincent, said his expectation for bitcoin to break $100,000 by year-end remains intact, adding that a sustained break above $90,000 could meet relatively limited resistance.

ScenarioConfirmationTargetInvalidation
BreakoutDaily close above $87,100$100,000Return below $87,000
RangeRejection at $87,100$82,206 supportDaily close above $87,100
BreakdownDaily close below $82,20650-day EMA near $79,188Recovery above $82,206

What Could Stop the Bitcoin Rally?

The main risk is rates. Carding pointed to the first net ETF outflow since September 16, about $149 million on September 30, and to the 10-year real yield , which closed that day at 2.93%.

"I use a 10-year real yield of about 3% as a monitoring level, and a sustained move above it would make a retest of $80,000 to $82,000 more likely than a run at $90,000," Carding said.

That band is where BTC traded on September 18, three days before the breakout, when bitcoin topped $80,000 as ether, XRP and dogecoin rose.

A daily close below $82,206 would push BTC back into its August and September range. On the quarterly chart, the bullish case holds as long as the price stays above $58,700.

About the Author: Damian Chmiel
Damian Chmiel
  • 4005 Articles
  • 117 Followers
About the Author: Damian Chmiel
Damian Chmiel is a Senior Analyst & Editor at Finance Magnates with more than 15 years of experience in the CFD and online trading industry. Active as both a trader and journalist since 2010, he focuses on broker coverage, fintech innovation, and regulatory developments across Europe, the Middle East, and Asia. His work includes interviews with C-level leaders at major brokerages and fintech platforms, as well as co-authoring Finance Magnates’ quarterly industry benchmarking reports. Damian’s reporting is data-driven, market-aware, and grounded in direct industry engagement. His analysis and commentary have also been cited by external media outlets, including Investing.com, Binance, The Asset, Stockhead, and Dispatch. Education: MA in Finance and Accounting, Cracow University of Economics
  • 4005 Articles
  • 117 Followers

More from the Author

Trending

!"#$%&'()*+,-./0123456789:;<=>?@ABCDEFGHIJKLMNOPQRSTUVWXYZ[\]^_`abcdefghijklmnopqrstuvwxyz{|} !"#$%&'()*+,-./0123456789:;<=>?@ABCDEFGHIJKLMNOPQRSTUVWXYZ[\]^_`abcdefghijklmnopqrstuvwxyz{|}