How High Can Nvidia Stock Go After Hitting a Record Near $240?

Tuesday, 06/10/2026 | 11:23 GMT by Damian Chmiel
  • A weak September jobs report cooled Fed hike bets and lifted chipmakers, while the Nasdaq 100 also closed at a record.
  • My daily chart shows the first close above the May peak, with Fibonacci targets at $262 and $307 if the breakout holds.
Nvidia earnings AI
Nvidia is largely seen as a bellweather for the wider AI industry (Nvidia).

Nvidia (NVDA) stock hit a record high yesterday (Monday) and closed up 2.1% at $238.90. Buyers stepped in after a weak US jobs report cut bets on another Federal Reserve rate hike in October.

The close took Nvidia out of the box it had traded in since its May peak, and the stock traded near $241 before the opening bell. My daily chart reads that as a breakout, with Fibonacci projections pointing to about $262 first and $307 if the move extends.

London's trading industry is coming home!

Why Is Nvidia Stock Going Up?

US payrolls rose by only 29,000 in September and unemployment edged up to 4.2%. The previous two months were revised down by a combined 60,000.

Traders took that as a reason for the Fed to hold off on another hike this month, and LMAX Group said in its Monday note that equities entered the week supported by softer Fed hike expectations.

Nvidia led the megacap gains. The Nasdaq 100 rose 0.9% to a record close of 31,076 points, and Nvidia's intraday market value reached about $5.78 trillion, according to Yahoo Finance.

The company gave the stock its own reason to rise on September 28, when it lifted its buyback authorization by $150 billion, leaving $235 billion available, as BNN Bloomberg reported. The shares closed at $228.86 that day, a week before Monday's record.

How High Can Nvidia Stock Go?

Nvidia peaked at $236.51 in May and then failed to close above that level for almost five months. The deepest pullback, in late July, stopped at $189.66, right on the 200-day exponential moving average (EMA). Since August, the 50-day EMA has held every dip toward $210.

Monday's session was the first daily close above the $233.37 to $236.51 resistance band. I measured the Fibonacci extension of the April to May rally, which started near $164, and projected it from the July low.

The 100% extension, where the second leg matches the first, sits at $262.24, about 10% above Monday's close. The 161.8% extension points to $307.08, roughly 29% higher.
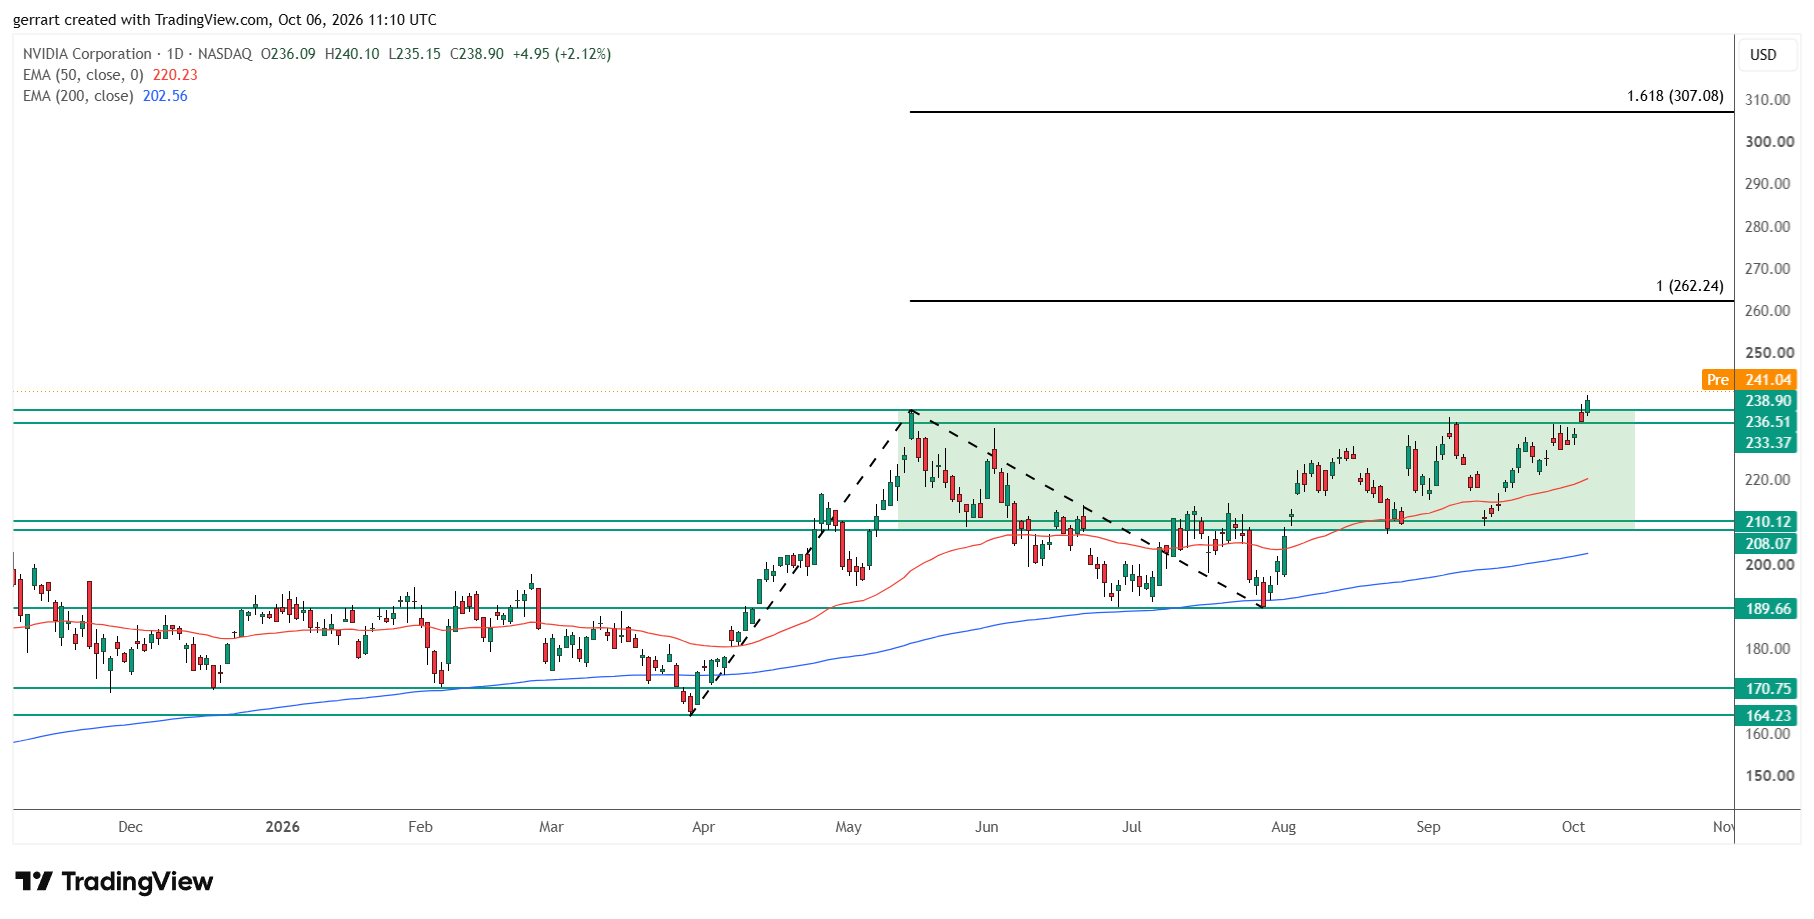
Nvidia closed above its May peak on Monday. Source: TradingView, Nasdaq.

When I looked at Nvidia's targets in May 2025, the stock had closed at $134 and Jefferies and Bernstein had $185 targets on it. Monday's close is 78% above that $134 level and 29% above those targets.

ScenarioConfirmationTargetInvalidation
Breakout holdsDaily closes above $236.51, then a weekly close above it on Friday$262.24, then $307.08Daily close below $233.37
Failed breakoutDaily close back below $233.37Return to the range, 50-day EMA near $220Recovery above $236.51
Deeper pullbackDaily close below $208.07July low at $189.66, 200-day EMA near $203Recovery above $210.12

Is the Nasdaq Also at a Record High?

Yes. The Nasdaq 100 cash index broke above its June peak, a resistance band between 30,681.7 and 30,764.8 points, and traded at 31,206.8 on IG this morning.

That former ceiling, about 1.7% below the current price, is now the first support on my chart. The 50-day EMA sits lower, at 29,896.1.
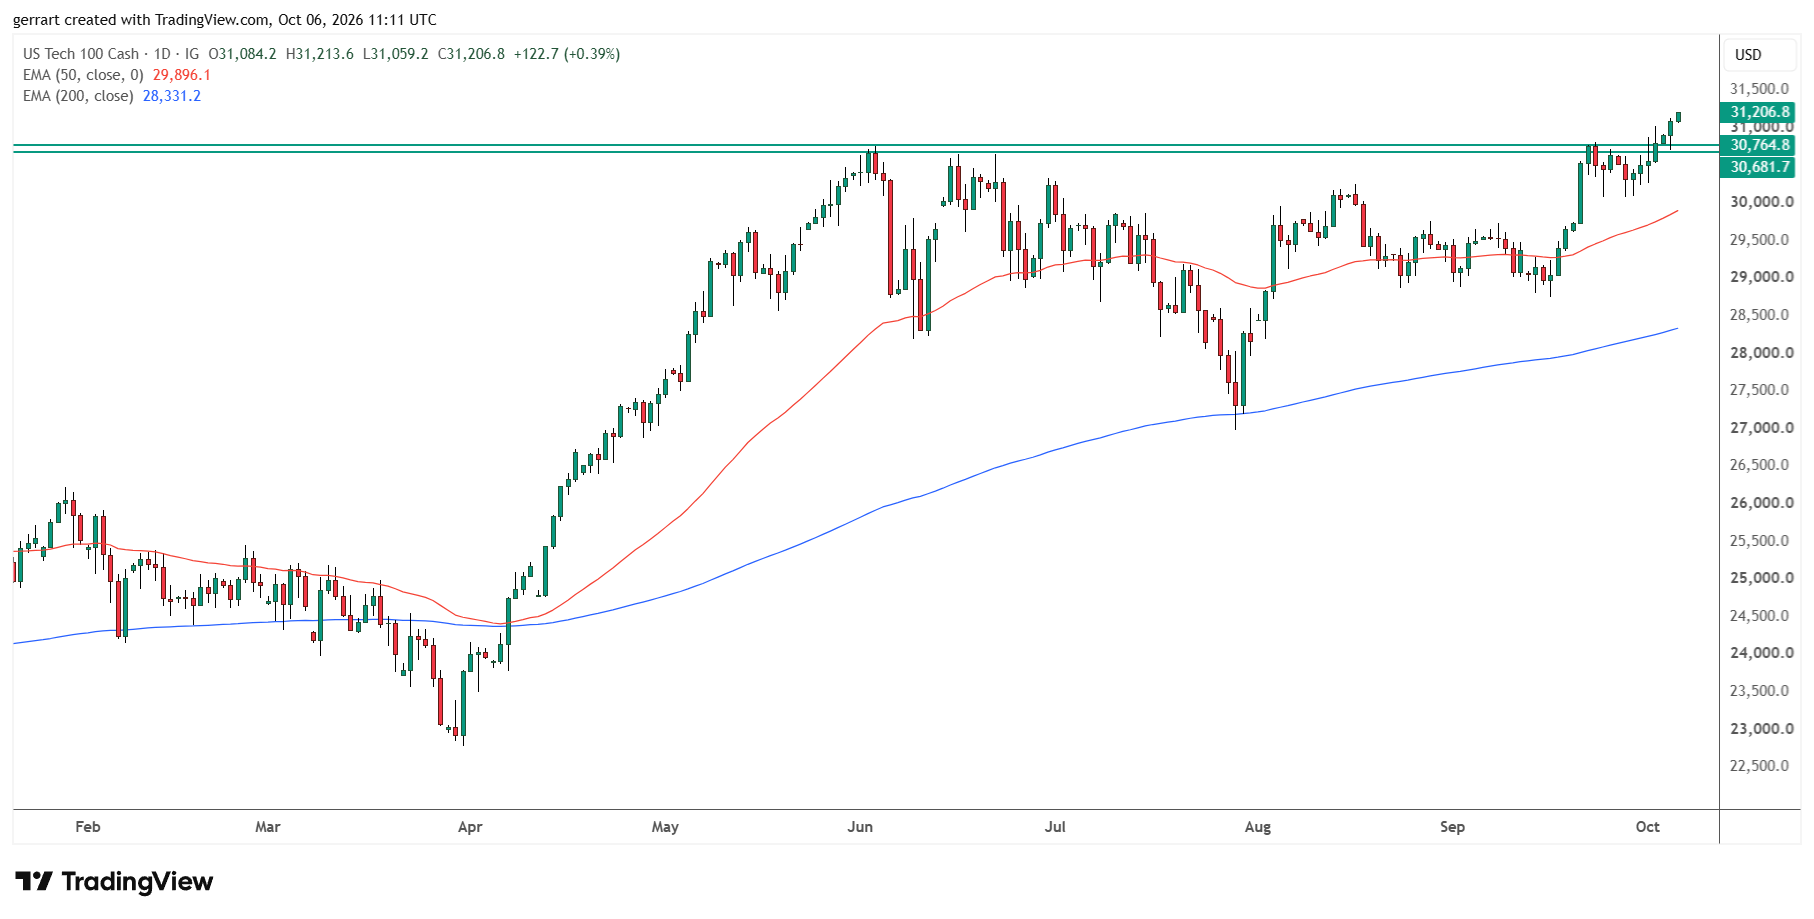
The Nasdaq 100 cleared its June highs and is trading above 31,000 points. Source: TradingView, IG.

What Could Stop the Nvidia Rally?

Bonds. The US 10-year Treasury yield stands near 5.25%, and Kathleen Brooks, research director at XTB, pointed to the gap between the two markets in a note on Monday, writing about the selloff in European debt.

"It is remarkable how calm stocks have been in the face of the recent bond market distress," Brooks wrote.

The next test comes on Wednesday. Madhur Kakkar, founder and CEO of Elevate Financial Services, flagged the minutes of the September Fed meeting and the 10-year Treasury auction that day as signals for the Fed's policy outlook and for demand for US government debt.

For my breakout call, the line is $233.37. A daily close back below it would put Nvidia back inside the range it spent five months in, with the 50-day EMA near $220 as the next test.

Nvidia (NVDA) stock hit a record high yesterday (Monday) and closed up 2.1% at $238.90. Buyers stepped in after a weak US jobs report cut bets on another Federal Reserve rate hike in October.

The close took Nvidia out of the box it had traded in since its May peak, and the stock traded near $241 before the opening bell. My daily chart reads that as a breakout, with Fibonacci projections pointing to about $262 first and $307 if the move extends.

London's trading industry is coming home!

Why Is Nvidia Stock Going Up?

US payrolls rose by only 29,000 in September and unemployment edged up to 4.2%. The previous two months were revised down by a combined 60,000.

Traders took that as a reason for the Fed to hold off on another hike this month, and LMAX Group said in its Monday note that equities entered the week supported by softer Fed hike expectations.

Nvidia led the megacap gains. The Nasdaq 100 rose 0.9% to a record close of 31,076 points, and Nvidia's intraday market value reached about $5.78 trillion, according to Yahoo Finance.

The company gave the stock its own reason to rise on September 28, when it lifted its buyback authorization by $150 billion, leaving $235 billion available, as BNN Bloomberg reported. The shares closed at $228.86 that day, a week before Monday's record.

How High Can Nvidia Stock Go?

Nvidia peaked at $236.51 in May and then failed to close above that level for almost five months. The deepest pullback, in late July, stopped at $189.66, right on the 200-day exponential moving average (EMA). Since August, the 50-day EMA has held every dip toward $210.

Monday's session was the first daily close above the $233.37 to $236.51 resistance band. I measured the Fibonacci extension of the April to May rally, which started near $164, and projected it from the July low.

The 100% extension, where the second leg matches the first, sits at $262.24, about 10% above Monday's close. The 161.8% extension points to $307.08, roughly 29% higher.

Nvidia closed above its May peak on Monday. Source: TradingView, Nasdaq.

When I looked at Nvidia's targets in May 2025, the stock had closed at $134 and Jefferies and Bernstein had $185 targets on it. Monday's close is 78% above that $134 level and 29% above those targets.

ScenarioConfirmationTargetInvalidation
Breakout holdsDaily closes above $236.51, then a weekly close above it on Friday$262.24, then $307.08Daily close below $233.37
Failed breakoutDaily close back below $233.37Return to the range, 50-day EMA near $220Recovery above $236.51
Deeper pullbackDaily close below $208.07July low at $189.66, 200-day EMA near $203Recovery above $210.12

Is the Nasdaq Also at a Record High?

Yes. The Nasdaq 100 cash index broke above its June peak, a resistance band between 30,681.7 and 30,764.8 points, and traded at 31,206.8 on IG this morning.

That former ceiling, about 1.7% below the current price, is now the first support on my chart. The 50-day EMA sits lower, at 29,896.1.

The Nasdaq 100 cleared its June highs and is trading above 31,000 points. Source: TradingView, IG.

What Could Stop the Nvidia Rally?

Bonds. The US 10-year Treasury yield stands near 5.25%, and Kathleen Brooks, research director at XTB, pointed to the gap between the two markets in a note on Monday, writing about the selloff in European debt.

"It is remarkable how calm stocks have been in the face of the recent bond market distress," Brooks wrote.

The next test comes on Wednesday. Madhur Kakkar, founder and CEO of Elevate Financial Services, flagged the minutes of the September Fed meeting and the 10-year Treasury auction that day as signals for the Fed's policy outlook and for demand for US government debt.

For my breakout call, the line is $233.37. A daily close back below it would put Nvidia back inside the range it spent five months in, with the 50-day EMA near $220 as the next test.

About the Author: Damian Chmiel
Damian Chmiel
  • 4013 Articles
  • 117 Followers
About the Author: Damian Chmiel
Damian Chmiel is a Senior Analyst & Editor at Finance Magnates with more than 15 years of experience in the CFD and online trading industry. Active as both a trader and journalist since 2010, he focuses on broker coverage, fintech innovation, and regulatory developments across Europe, the Middle East, and Asia. His work includes interviews with C-level leaders at major brokerages and fintech platforms, as well as co-authoring Finance Magnates’ quarterly industry benchmarking reports. Damian’s reporting is data-driven, market-aware, and grounded in direct industry engagement. His analysis and commentary have also been cited by external media outlets, including Investing.com, Binance, The Asset, Stockhead, and Dispatch. Education: MA in Finance and Accounting, Cracow University of Economics
  • 4013 Articles
  • 117 Followers

More from the Author

Trending

!"#$%&'()*+,-./0123456789:;<=>?@ABCDEFGHIJKLMNOPQRSTUVWXYZ[\]^_`abcdefghijklmnopqrstuvwxyz{|} !"#$%&'()*+,-./0123456789:;<=>?@ABCDEFGHIJKLMNOPQRSTUVWXYZ[\]^_`abcdefghijklmnopqrstuvwxyz{|}