Brent crude trades above $115 per barrel on April 29, 2026, the highest level since June 2022 after a seventh straight session of gains.
Technical analysis shows that a clean break from consolidation opens the path to $125 and the 2022 peak near $140.
UAE leaves OPEC May 1, JPMorgan warns of $150 Brent if Hormuz stays shut, while Goldman flags a $115 to $120 Q4 scenario.
Brent crude
traded at $115.29 per barrel on Wednesday, April 29, 2026, up 3.62% on the
session and rising for the seventh consecutive day, the longest winning streak
of the year and the highest closing level for the European benchmark since June
2022.
The June
2026 contract has now gained more than 88% over the past 12 months, lifted by
the de facto closure of the Strait of Hormuz, the ninth week of US-Iran
conflict, and Tuesday's surprise announcement that the United Arab Emirates
will leave OPEC and OPEC+ on May 1.
Follow
me on X for real-time market analysis: @ChmielDk.
You can find all of my coverage on my analyst page.
The
catalysts now compete with each other. Goldman Sachs upgraded its Q4 2026 Brent
forecast to $90 from $80 on April 26, the fourth upward revision since the war
began. JPMorgan continues to flag a $150 overshoot if Hormuz disruption
extends. Both projections sit above the futures curve, which still prices a Q3
reversion below $90.
Why Is Oil Rising? Brent
Tests Highest Level Since June 2022
Brent's
seventh straight gain pushed the contract through the $113 level, a zone that
has capped every rally since March, and into the $115 to $117 band last seen
during the June 2022 Russia-Ukraine spike. Iraqi, Saudi, and Emirati production
remains shut in at roughly 9.1 million barrels per day in April, according to
the EIA, the largest physical disruption in the modern history of the global
crude market.
The dollar
has not suppressed prices the way it usually does. Treasury yields are rising,
the dollar index is steady, and oil is climbing anyway, a configuration that
signals supply is the dominant variable.
Refining
margins validate the squeeze. The distillate crack spread at New York Harbor
averaged $1.42 per gallon in March, the highest monthly print since 2022, while
US retail gasoline prices have climbed to the highest level in nearly four
years.
The
structural drivers now in play:
Strait of Hormuz effectively closed since
February 28, removing roughly 20% of seaborne oil supply
9.1 million b/d of Persian Gulf production
shut in for April per EIA
UAE exit from OPEC effective May 1 fragments the
cartel's pricing power
9.6 mb/d global deficit in Q2 2026 in Goldman's
revised supply-demand model
UAE Leaves OPEC: A
Structural Blow to Coordinated Supply
The UAE's
announcement that it will exit both OPEC and OPEC+ on May 1, after 59 years of
membership, marks the largest fracture in the cartel since Qatar's departure in
2019. The UAE is OPEC's third-largest producer behind Saudi Arabia and Iraq,
with installed capacity near 4.8 million barrels per day and the operational
flexibility to bring barrels online faster than any other member.
Nigel
Green, CEO of deVere Group, called the move a removal of a core pillar of oil
market stability. "The UAE is not a marginal player. It's one of the very
few producers with both meaningful spare capacity and the operational
flexibility to bring barrels online quickly, which has been critical to how
Opec has managed supply and influenced pricing," Green said.
The market
reaction has been more measured than the headline suggests. "Markets are
already looking beyond the headlines to what this means for future supply.
There's no immediate loss of barrels, so the move reflects uncertainty pricing
rather than a genuine supply shock," Green added.
The
longer-term read is more concerning. Rystad Energy framed the UAE departure as
a permanent structural weakening of the group, consistent with the conclusion
in my April 7 oil price analysis that the post-war oil regime would
not look like the pre-war one.
Strait of Hormuz: Where
the Physical Crisis Actually Lives
Futures
prices understate the dislocation in the cash market. Linh Tran, Market Analyst
at XS.com,
anchored the supply-side framing in comments to FinanceMagnates.com.
"WTI's
return to the $100 per barrel level once again signals a clear shift in market
structure. The primary driver is not a surge in demand, but rather supply-side
dynamics, as geopolitical factors are now directly impacting physical oil
flows," Tran said. She estimated that 10 to 13 million barrels per day are
now affected by the Hormuz bottleneck, sufficient to push the market from
balance into a structurally tight environment.
Tran framed
the consequence in trader terms: "The market is no longer simply pricing
in risk, but rather a prolonged period of supply disruption."
The
futures-cash gap is now extreme. Arlan Suderman, Chief Commodities Economist at
StoneX,
said cash prices in Asia and parts of Europe have at times exceeded levels more
than 50% higher than where Brent futures are trading.
"The
futures market does not reflect the reality of the cash market, especially in
Asia and parts of Europe, where actual shortages continue to mount,"
Suderman said.
He added
that rising energy prices are already feeding through to "elevated
inflation pressures going forward, leading to rising Treasury yields," a
chain that my March Hormuz analysis flagged early.
Brent Crude Technical
Analysis: $115 Is the Line
In 15 years
analyzing markets, I've only seen Brent close above $115 in three prior
episodes: the 2008 super-spike, the 2011 Libya supply shutdown, and the first
weeks of the 2022 Ukraine war. This is the fourth.
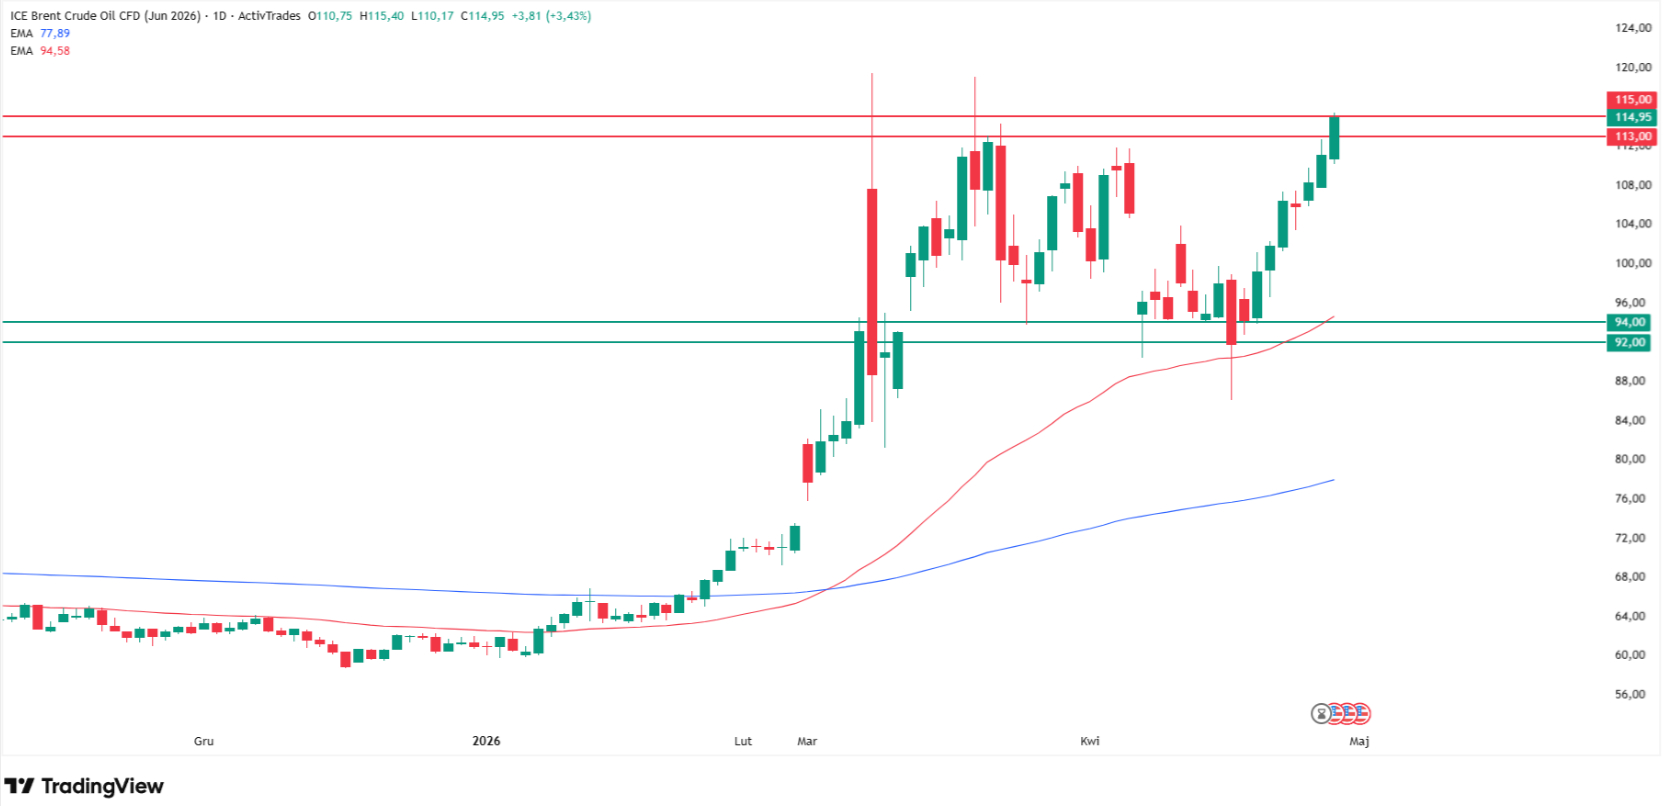
Why oil prices are going up today? Source: Tradingview.com
My chart
shows Brent has been consolidating for the past month and a half inside a wide
$92 to $115 range. The lower bound at $92 to $94 is reinforced by the September
2023 and April 2024 peaks and the 50-day exponential moving average.
The upper
bound at $113 to $115 marks both the local highs from March 2026 and the
resistance zone established during the June 2022 cycle peak. Today's session is
testing that ceiling.
Level
Type
Notes
$77
200 MA / major support
June 2025 high; trend boundary
$80
Support
January 2025 high
$92-$94
Lower consolidation / 50 EMA
Sept 2023 + April 2024 peaks
$113-$115
Upper consolidation / current resistance
March 2026 highs + 2022 ceiling
$125
Next resistance on breakout
June 2022 swing high
$140
Major resistance
March 2022 Ukraine war peak
A weekly
close above $115 opens the path toward $125, the June 2022 swing high, with the
$140 March 2022 peak as the next major resistance. A failure here, and a return
inside the consolidation, points to $92 to $94 as the first downside target.
A breakdown
below the 50 EMA would open the move toward $80, the January 2025 high, and
ultimately $77, where the 200 MA currently sits and where the line between an
uptrend and a downtrend lies.
The current
price sits roughly 49% above the 200 MA, an unusually wide gap that typically
resolves through either a sharp pullback or a multi-month grind sideways while
the moving average catches up. Direction will be decided by Hormuz, not by
chart patterns.
Oil Price Predictions
2026: How High Can Brent Go?
Institutional
forecasts have moved up four times since the war began on February 28. The
consensus is now firmly above $90 in the bull cases, but the divergence between
base and risk scenarios is the widest since 2008.
Source
Target
Notes
JPMorgan
$150 Brent overshoot
If Hormuz
stays shut into mid-May
Goldman Sachs (extreme)
$135 Brent
Demand-destruction peak scenario
Goldman Sachs (risk)
$115-$120 Q4 Brent
If Hormuz
disrupted through Q3
Goldman Sachs (base)
$90 Q4 Brent
April 26 upgrade from $80
Macquarie / Wood Mackenzie
$200 Brent (tail risk)
Multi-month
full closure scenario
EIA
$70 Brent by year-end
Assumes
Hormuz reopens, US production at 13.6M b/d
JPMorgan's
$150 call assumes Hormuz disruption extends into mid-May; my read is that this
is no longer a tail scenario after the UAE exit reduced the probability of a
coordinated production response. Goldman's $135 extreme assumes the market
needs to force demand destruction, and the New York Harbor refining margin data
suggests that response is already beginning.
Goldman's
$90 base case looks too low if the UAE exit erodes coordinated discipline. My
$115 chart level is a more realistic Q3 anchor. The EIA's $70 year-end target
depends on a Hormuz reopening that the EIA itself now expects to be partial
through late 2026.
Cross-asset
spillover is already underway. As my Bitcoin Hormuz analysis noted, oil's grip on inflation
expectations is reshaping the rate-cut path, while the gold-oil correlation that previously held has broken
down.
FAQ, Oil Prices
Why is the price of oil
rising in April 2026?
Brent crude
trades above $115 on April 29, 2026, driven by the de facto closure of the
Strait of Hormuz since February 28, 9.1 million barrels per day of shut-in
Persian Gulf production per EIA, and the UAE's surprise announcement that it
will leave OPEC on May 1, fragmenting the cartel's coordinated supply response.
How high can Brent crude
go in 2026?
JPMorgan
warns Brent could overshoot to $150 if Hormuz remains shut into mid-May.
Goldman Sachs flagged $135 as an extreme demand-destruction peak and $115 to
$120 as a Q4 risk scenario. Macquarie and Wood Mackenzie sketched $200 as a
tail outcome. My TA targets $125 on a clean break above $115, with $140 as the
major ceiling.
Goldman
Sachs raised its Q4 2026 Brent forecast to $90 per barrel on April 26, the
fourth upgrade since February. The bank's risk scenario sees $115 to $120 Brent
in Q4 if Hormuz disruption extends, with an extreme peak at $135. Goldman now
models a 9.6 million b/d global oil deficit in Q2 2026.
How does the oil price
affect inflation and the Fed?
Sustained
Brent above $100 per barrel feeds directly into refined product prices, with US
average gasoline at the highest level in nearly four years. StoneX's Arlan
Suderman warned that "rising energy prices suggest elevated inflation
pressures going forward, leading to rising Treasury yields," limiting the
Fed's flexibility to cut rates and pressuring risk assets.
Brent crude
traded at $115.29 per barrel on Wednesday, April 29, 2026, up 3.62% on the
session and rising for the seventh consecutive day, the longest winning streak
of the year and the highest closing level for the European benchmark since June
2022.
The June
2026 contract has now gained more than 88% over the past 12 months, lifted by
the de facto closure of the Strait of Hormuz, the ninth week of US-Iran
conflict, and Tuesday's surprise announcement that the United Arab Emirates
will leave OPEC and OPEC+ on May 1.
Follow
me on X for real-time market analysis: @ChmielDk.
You can find all of my coverage on my analyst page.
The
catalysts now compete with each other. Goldman Sachs upgraded its Q4 2026 Brent
forecast to $90 from $80 on April 26, the fourth upward revision since the war
began. JPMorgan continues to flag a $150 overshoot if Hormuz disruption
extends. Both projections sit above the futures curve, which still prices a Q3
reversion below $90.
Why Is Oil Rising? Brent
Tests Highest Level Since June 2022
Brent's
seventh straight gain pushed the contract through the $113 level, a zone that
has capped every rally since March, and into the $115 to $117 band last seen
during the June 2022 Russia-Ukraine spike. Iraqi, Saudi, and Emirati production
remains shut in at roughly 9.1 million barrels per day in April, according to
the EIA, the largest physical disruption in the modern history of the global
crude market.
The dollar
has not suppressed prices the way it usually does. Treasury yields are rising,
the dollar index is steady, and oil is climbing anyway, a configuration that
signals supply is the dominant variable.
Refining
margins validate the squeeze. The distillate crack spread at New York Harbor
averaged $1.42 per gallon in March, the highest monthly print since 2022, while
US retail gasoline prices have climbed to the highest level in nearly four
years.
The
structural drivers now in play:
Strait of Hormuz effectively closed since
February 28, removing roughly 20% of seaborne oil supply
9.1 million b/d of Persian Gulf production
shut in for April per EIA
UAE exit from OPEC effective May 1 fragments the
cartel's pricing power
9.6 mb/d global deficit in Q2 2026 in Goldman's
revised supply-demand model
UAE Leaves OPEC: A
Structural Blow to Coordinated Supply
The UAE's
announcement that it will exit both OPEC and OPEC+ on May 1, after 59 years of
membership, marks the largest fracture in the cartel since Qatar's departure in
2019. The UAE is OPEC's third-largest producer behind Saudi Arabia and Iraq,
with installed capacity near 4.8 million barrels per day and the operational
flexibility to bring barrels online faster than any other member.
Nigel
Green, CEO of deVere Group, called the move a removal of a core pillar of oil
market stability. "The UAE is not a marginal player. It's one of the very
few producers with both meaningful spare capacity and the operational
flexibility to bring barrels online quickly, which has been critical to how
Opec has managed supply and influenced pricing," Green said.
The market
reaction has been more measured than the headline suggests. "Markets are
already looking beyond the headlines to what this means for future supply.
There's no immediate loss of barrels, so the move reflects uncertainty pricing
rather than a genuine supply shock," Green added.
The
longer-term read is more concerning. Rystad Energy framed the UAE departure as
a permanent structural weakening of the group, consistent with the conclusion
in my April 7 oil price analysis that the post-war oil regime would
not look like the pre-war one.
Strait of Hormuz: Where
the Physical Crisis Actually Lives
Futures
prices understate the dislocation in the cash market. Linh Tran, Market Analyst
at XS.com,
anchored the supply-side framing in comments to FinanceMagnates.com.
"WTI's
return to the $100 per barrel level once again signals a clear shift in market
structure. The primary driver is not a surge in demand, but rather supply-side
dynamics, as geopolitical factors are now directly impacting physical oil
flows," Tran said. She estimated that 10 to 13 million barrels per day are
now affected by the Hormuz bottleneck, sufficient to push the market from
balance into a structurally tight environment.
Tran framed
the consequence in trader terms: "The market is no longer simply pricing
in risk, but rather a prolonged period of supply disruption."
The
futures-cash gap is now extreme. Arlan Suderman, Chief Commodities Economist at
StoneX,
said cash prices in Asia and parts of Europe have at times exceeded levels more
than 50% higher than where Brent futures are trading.
"The
futures market does not reflect the reality of the cash market, especially in
Asia and parts of Europe, where actual shortages continue to mount,"
Suderman said.
He added
that rising energy prices are already feeding through to "elevated
inflation pressures going forward, leading to rising Treasury yields," a
chain that my March Hormuz analysis flagged early.
Brent Crude Technical
Analysis: $115 Is the Line
In 15 years
analyzing markets, I've only seen Brent close above $115 in three prior
episodes: the 2008 super-spike, the 2011 Libya supply shutdown, and the first
weeks of the 2022 Ukraine war. This is the fourth.
Why oil prices are going up today? Source: Tradingview.com
My chart
shows Brent has been consolidating for the past month and a half inside a wide
$92 to $115 range. The lower bound at $92 to $94 is reinforced by the September
2023 and April 2024 peaks and the 50-day exponential moving average.
The upper
bound at $113 to $115 marks both the local highs from March 2026 and the
resistance zone established during the June 2022 cycle peak. Today's session is
testing that ceiling.
Level
Type
Notes
$77
200 MA / major support
June 2025 high; trend boundary
$80
Support
January 2025 high
$92-$94
Lower consolidation / 50 EMA
Sept 2023 + April 2024 peaks
$113-$115
Upper consolidation / current resistance
March 2026 highs + 2022 ceiling
$125
Next resistance on breakout
June 2022 swing high
$140
Major resistance
March 2022 Ukraine war peak
A weekly
close above $115 opens the path toward $125, the June 2022 swing high, with the
$140 March 2022 peak as the next major resistance. A failure here, and a return
inside the consolidation, points to $92 to $94 as the first downside target.
A breakdown
below the 50 EMA would open the move toward $80, the January 2025 high, and
ultimately $77, where the 200 MA currently sits and where the line between an
uptrend and a downtrend lies.
The current
price sits roughly 49% above the 200 MA, an unusually wide gap that typically
resolves through either a sharp pullback or a multi-month grind sideways while
the moving average catches up. Direction will be decided by Hormuz, not by
chart patterns.
Oil Price Predictions
2026: How High Can Brent Go?
Institutional
forecasts have moved up four times since the war began on February 28. The
consensus is now firmly above $90 in the bull cases, but the divergence between
base and risk scenarios is the widest since 2008.
Source
Target
Notes
JPMorgan
$150 Brent overshoot
If Hormuz
stays shut into mid-May
Goldman Sachs (extreme)
$135 Brent
Demand-destruction peak scenario
Goldman Sachs (risk)
$115-$120 Q4 Brent
If Hormuz
disrupted through Q3
Goldman Sachs (base)
$90 Q4 Brent
April 26 upgrade from $80
Macquarie / Wood Mackenzie
$200 Brent (tail risk)
Multi-month
full closure scenario
EIA
$70 Brent by year-end
Assumes
Hormuz reopens, US production at 13.6M b/d
JPMorgan's
$150 call assumes Hormuz disruption extends into mid-May; my read is that this
is no longer a tail scenario after the UAE exit reduced the probability of a
coordinated production response. Goldman's $135 extreme assumes the market
needs to force demand destruction, and the New York Harbor refining margin data
suggests that response is already beginning.
Goldman's
$90 base case looks too low if the UAE exit erodes coordinated discipline. My
$115 chart level is a more realistic Q3 anchor. The EIA's $70 year-end target
depends on a Hormuz reopening that the EIA itself now expects to be partial
through late 2026.
Cross-asset
spillover is already underway. As my Bitcoin Hormuz analysis noted, oil's grip on inflation
expectations is reshaping the rate-cut path, while the gold-oil correlation that previously held has broken
down.
FAQ, Oil Prices
Why is the price of oil
rising in April 2026?
Brent crude
trades above $115 on April 29, 2026, driven by the de facto closure of the
Strait of Hormuz since February 28, 9.1 million barrels per day of shut-in
Persian Gulf production per EIA, and the UAE's surprise announcement that it
will leave OPEC on May 1, fragmenting the cartel's coordinated supply response.
How high can Brent crude
go in 2026?
JPMorgan
warns Brent could overshoot to $150 if Hormuz remains shut into mid-May.
Goldman Sachs flagged $135 as an extreme demand-destruction peak and $115 to
$120 as a Q4 risk scenario. Macquarie and Wood Mackenzie sketched $200 as a
tail outcome. My TA targets $125 on a clean break above $115, with $140 as the
major ceiling.
Goldman
Sachs raised its Q4 2026 Brent forecast to $90 per barrel on April 26, the
fourth upgrade since February. The bank's risk scenario sees $115 to $120 Brent
in Q4 if Hormuz disruption extends, with an extreme peak at $135. Goldman now
models a 9.6 million b/d global oil deficit in Q2 2026.
How does the oil price
affect inflation and the Fed?
Sustained
Brent above $100 per barrel feeds directly into refined product prices, with US
average gasoline at the highest level in nearly four years. StoneX's Arlan
Suderman warned that "rising energy prices suggest elevated inflation
pressures going forward, leading to rising Treasury yields," limiting the
Fed's flexibility to cut rates and pressuring risk assets.
Damian Chmiel is a Senior Analyst & Editor at Finance Magnates with more than 15 years of experience in the CFD and online trading industry. Active as both a trader and journalist since 2010, he focuses on broker coverage, fintech innovation, and regulatory developments across Europe, the Middle East, and Asia.
His work includes interviews with C-level leaders at major brokerages and fintech platforms, as well as co-authoring Finance Magnates’ quarterly industry benchmarking reports. Damian’s reporting is data-driven, market-aware, and grounded in direct industry engagement. His analysis and commentary have also been cited by external media outlets, including Investing.com, Binance, The Asset, Stockhead, and Dispatch.
Education:
MA in Finance and Accounting, Cracow University of Economics
Belgian Police Arrest Teen in €500K Phishing and Crypto Laundering Scheme
Featured Videos
FM Daily Brief – 21 July 2026
FM Daily Brief – 21 July 2026
FM Daily Brief – 21 July 2026
FM Daily Brief – 21 July 2026
Today's Tuesday, the 21st of July 2026, and these are our main stories: has BDSwiss’s offshore been shuttered? Esma reports strong growth in cross border retail investing across Europe, and the London Stock Exchange plans overnight trading.
Today's Tuesday, the 21st of July 2026, and these are our main stories: has BDSwiss’s offshore been shuttered? Esma reports strong growth in cross border retail investing across Europe, and the London Stock Exchange plans overnight trading.
Today's Tuesday, the 21st of July 2026, and these are our main stories: has BDSwiss’s offshore been shuttered? Esma reports strong growth in cross border retail investing across Europe, and the London Stock Exchange plans overnight trading.
Today's Tuesday, the 21st of July 2026, and these are our main stories: has BDSwiss’s offshore been shuttered? Esma reports strong growth in cross border retail investing across Europe, and the London Stock Exchange plans overnight trading.
Fintech Education Explained: How Finance Magnates Academy Helps You Build a Career
Fintech Education Explained: How Finance Magnates Academy Helps You Build a Career
Fintech Education Explained: How Finance Magnates Academy Helps You Build a Career
Fintech Education Explained: How Finance Magnates Academy Helps You Build a Career
Fintech Education Explained: How Finance Magnates Academy Helps You Build a Career
Fintech Education Explained: How Finance Magnates Academy Helps You Build a Career
What does it take to build a successful career in fintech?
In this exclusive interview, Dora Christofi, Head of Marketing at Finance Magnates, sits down with Jeff Patterson, Head of Education at Finance Magnates Academy, to discuss why fintech education has become more important than ever.
They explore how Finance Magnates Academy is helping students, professionals, career changers, HR teams, and fintech companies build practical industry knowledge through expert-led courses and recognised certifications.
In this interview:
✅ Why fintech needs specialised education
✅ The difference between theory and practical learning
✅ How Finance Magnates Academy prepares professionals for real careers
✅ The value of industry-recognised certifications
✅ How companies can improve employee onboarding and training
✅ What's coming next for Finance Magnates Academy
Whether you're looking to start a career in fintech, grow within the financial services industry, or improve your team's onboarding process, this conversation offers valuable insights from one of the industry's leading education initiatives.
Learn more about Finance Magnates Academy:
👉 https://academy.financemagnates.com
About Finance Magnates Academy
Finance Magnates Academy provides practical fintech education through expert-led courses, professional certifications, and corporate training. Designed for individuals and organisations, the Academy helps professionals build real-world skills across brokerage operations, trading, compliance, payments, financial markets, and fintech.
Connect with Finance Magnates
🌐 Website: https://www.financemagnates.com
🔗 LinkedIn: https://www.linkedin.com/company/finance-magnates
📺 Subscribe for more interviews, market insights, and fintech education.
#Fintech #FintechEducation #FinanceMagnates #FintechCareers #FinancialServices #CorporateTraining #OnlineLearning #FintechTraining
The FX & CFD Market Is Changing Fast. Here's What's Coming Next (2026)
The FX & CFD Market Is Changing Fast. Here's What's Coming Next (2026)
The FX & CFD Market Is Changing Fast. Here's What's Coming Next (2026)
The FX & CFD Market Is Changing Fast. Here's What's Coming Next (2026)
The FX & CFD Market Is Changing Fast. Here's What's Coming Next (2026)
The FX & CFD Market Is Changing Fast. Here's What's Coming Next (2026)
Where is the FX & CFD industry really heading in 2026?
In this free Finance Magnates Intelligence masterclass, industry experts explore the latest data shaping the global FX & CFD market, how regulation and regional demand influence expansion planning, and how brokerages benchmark performance across 265 firms on the FM Intelligence Portal.
In this session you'll learn:
✔ Where the FX/CFD industry is heading in H2 2026
✔ Why compliance should guide regional expansion decisions
✔ How internal performance compares when benchmarked against 265 brokers
✔ Regional demand shifts across Europe, APAC, and LATAM
✔Broker volume rankings, verification, and FM Intelligence Portal data
Speakers:
• Ramzi Ahmad, Director of Intelligence, Finance Magnates
• Sylwester Majewski, Head of Insights & Reporting Hub, Finance Magnates
• Philios Petrides, Data & Business Intelligence Consultant
If you work in brokerage, fintech, compliance, business development or market strategy, this session offers practical insights backed by verified industry data.
Access the FM Intelligence Portal at: https://datalab.financemagnates.com/
🔔 Subscribe to Finance Magnates for more webinars, interviews and market intelligence covering the global online trading industry.
#FinanceMagnates #FX #CFD #Fintech #Trading #Brokerage #MarketIntelligence #RegTech #Compliance #Forex
How Finance Leaders Adapt to Change | iFX EXPO
How Finance Leaders Adapt to Change | iFX EXPO
How Finance Leaders Adapt to Change | iFX EXPO
How Finance Leaders Adapt to Change | iFX EXPO
How Finance Leaders Adapt to Change | iFX EXPO
How Finance Leaders Adapt to Change | iFX EXPO
Markets never stop changing.
We asked finance executives for their number one success tip, and many came back to the same idea: adapt, stay informed and keep looking ahead.
Featuring executives from Shift Markets, Letknow Pay, Base Markets and SPAYZ.io.
#FinanceMagnates #Leadership #BusinessStrategy #Fintech #Shorts
FM Daily Brief – 20 July 2026
FM Daily Brief – 20 July 2026
FM Daily Brief – 20 July 2026
FM Daily Brief – 20 July 2026
FM Daily Brief – 20 July 2026
FM Daily Brief – 20 July 2026
Today's Monday, the 20th of July 2026, and these are our main stories: two brokers surpass the two-trillion-dollar monthly trading volume mark, Asic posts a record year for civil penalties, and Jump Trading expands its prediction markets team.
Today's Monday, the 20th of July 2026, and these are our main stories: two brokers surpass the two-trillion-dollar monthly trading volume mark, Asic posts a record year for civil penalties, and Jump Trading expands its prediction markets team.
Today's Monday, the 20th of July 2026, and these are our main stories: two brokers surpass the two-trillion-dollar monthly trading volume mark, Asic posts a record year for civil penalties, and Jump Trading expands its prediction markets team.
Today's Monday, the 20th of July 2026, and these are our main stories: two brokers surpass the two-trillion-dollar monthly trading volume mark, Asic posts a record year for civil penalties, and Jump Trading expands its prediction markets team.
Today's Monday, the 20th of July 2026, and these are our main stories: two brokers surpass the two-trillion-dollar monthly trading volume mark, Asic posts a record year for civil penalties, and Jump Trading expands its prediction markets team.
Today's Monday, the 20th of July 2026, and these are our main stories: two brokers surpass the two-trillion-dollar monthly trading volume mark, Asic posts a record year for civil penalties, and Jump Trading expands its prediction markets team.