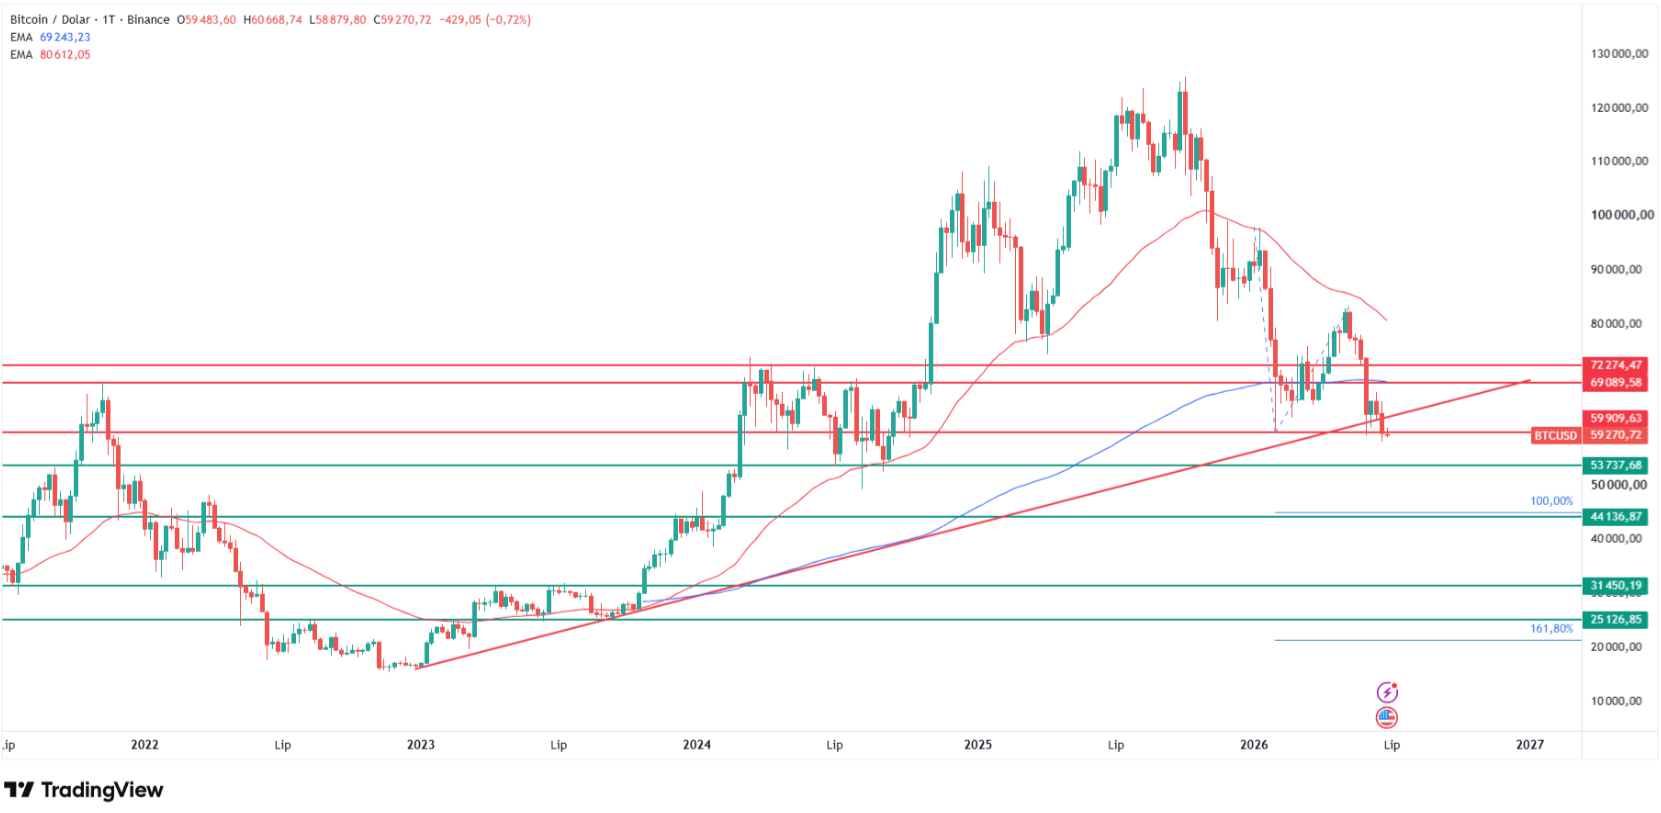
Bitcoin traded at $59,270 on June 30, 2026, after a weekly close below $60,000 flipped this year's key support into fresh resistance.
My BTC price prediction targets a further 25% drop to $44,100, the 100% Fibonacci extension, with $53,700 the first support shelf below.
Bull calls diverge sharply: Citi sees $112,000 and Standard Chartered $150,000, while June ETF outflows hit a record $4.06 billion.
Bitcoin token with a candle chart in the background. Source: Shutterstock
Bitcoin (BTC) traded at $59,270 on Tuesday, June 30, 2026,
after last week's candle closed below the $60,000 zone that contained every
2026 low, flipping former support into resistance. The break is a weekly-chart
event, not an intraday wick, and it carries more weight than any daily signal I
have flagged this month.
My Bitcoin
price prediction now targets a further 25% decline toward the $45,000 region,
the 100% Fibonacci extension of January's selloff.
Follow
me on X for real-time market analysis: @ChmielDk
Bitcoin Technical
Analysis: Weekly Close Below $60,000 Flips the Polarity
The weekly
candle closed below the $60,000 zone built on February's lows, and under the
polarity principle that floor now acts as a ceiling. Price tested it from below
at the start of this week and was rejected.
I stay
structurally bearish and set my main target at the 100% Fibonacci extension of
January's decline, near $44,100, the level I first mapped when I argued BTC risked a drop to $45,000. From $59,270 that marks a further
25% drop, and it is a higher-timeframe confirmation of my June bear-flag read on the daily chart.
Bitcoin price prediction: BTC/USD weekly close below $60,000. Source: Tradingview.com
Two more
shelves sit below the target. The summer-2024 lows near $53,700 are the first,
and a wider 2023 consolidation band between $25,100 and $31,500, where the
161.8% extension projects, is the deep-bear case.
The $44,100
zone also overlaps the price highs from the end of 2023, which gives the level
a second reason to matter. In 15 years as a trader and analyst, 10 of them at
FinanceMagnates.com, I have learned that a clean weekly close shifts the burden
of proof, and you can follow that work on my analyst page.
The second
weekly signal is a trendline break. The ascending line drawn across higher lows
from December 2022, actively tested in September and October 2023, held through
the first half of June and gave way this week.
The same
polarity flip at the $60,000 floor is one I flagged in a recent analysis, and the weekly close now hardens
it. What would flip my bias is a reclaim of $60,000 and, more importantly, the
200-week EMA near $69,000, now lying almost flat and overlapping the
March-to-June 2024 resistance highs.
Level
Type
Notes
$76,400
Resistance, daily 200 EMA
Long-term
trend divider, far overhead
$69,000-$70,000
Resistance, 200-week EMA
Bear-thesis
invalidation, aligns with Mar-Jun 2024 highs
$66,600
Resistance, daily 50 EMA
Caps near-term rebounds
$59,900-$60,000
Resistance, former support
Polarity
flip after weekly close, February lows
$53,700
Support
Summer-2024
lows, first downside shelf
$44,100
Support, 100% Fib extension
Main
target, 25% downside, late-2023 structure
$25,100-$31,500
Support
2023 consolidation, 161.8% extension deep target
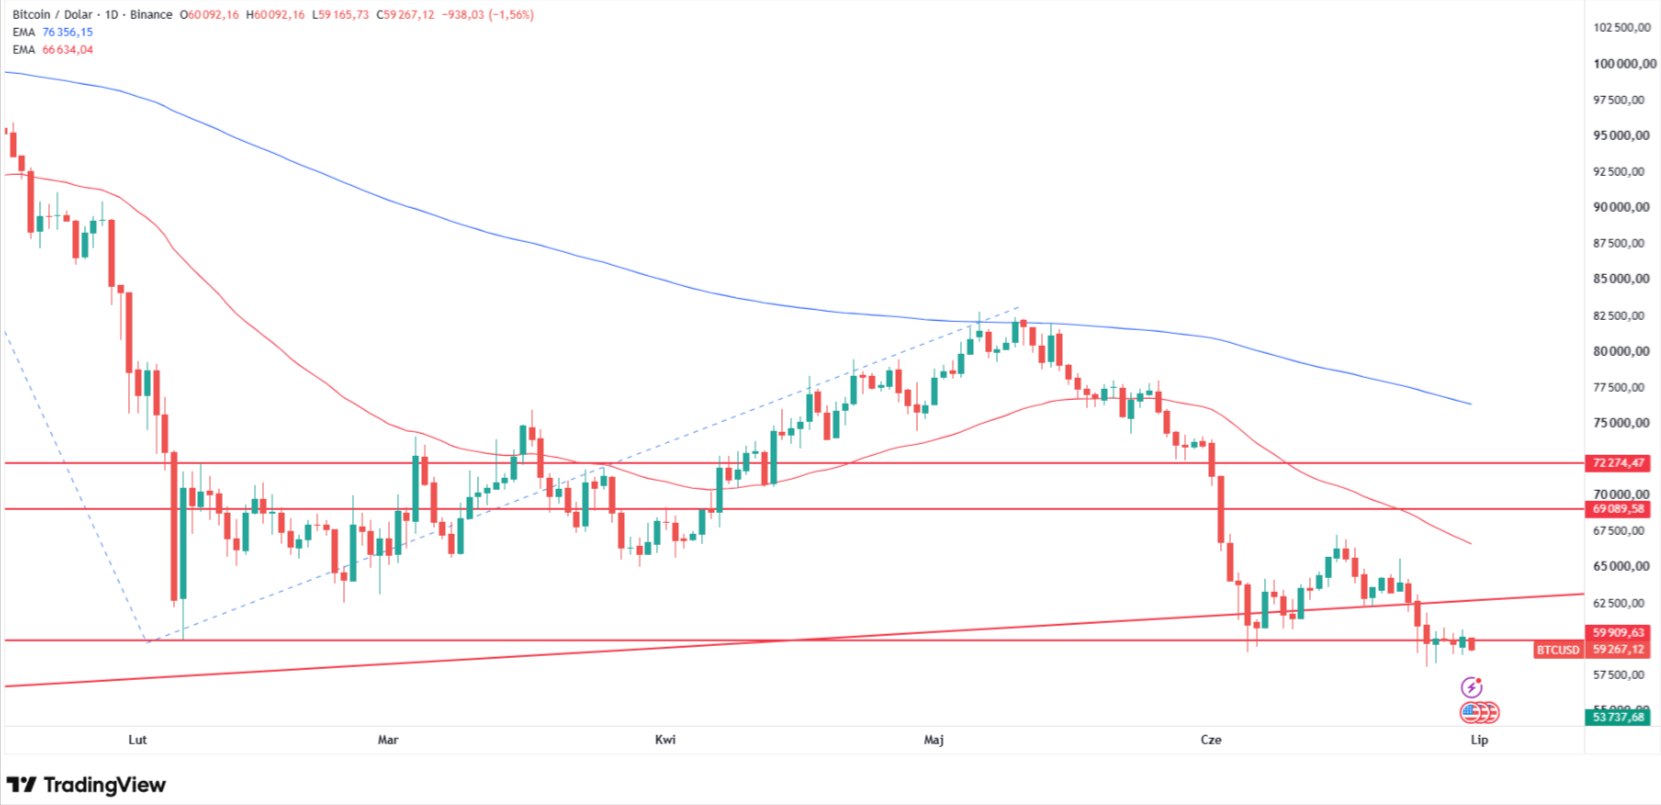
The daily
chart says less. Price is pinned just under $60,000, orders are stalling, and a
short-term bullish reaction is not off the table. The structure stays bearish
while the 50 EMA near $66,600 and the 200 EMA near $76,400 cap every rebound.
After the
target is reached, I would expect a drawn-out corrective rebound before the
trend resumes, but that is a second-order question while price sits below the
broken floor.
Why is Bitcoin falling? BTC/USD daily chart pinned under $60K. Source: Tradingview.com
Why Is Bitcoin Falling?
The selloff
started outside crypto. The Federal Reserve under new chair Kevin Warsh held
rates at 3.5% to 3.75% on June 17, stripped the easing-bias language from its
statement, and erased the 2026 rate cut from the dot plot. The dollar firmed
and Treasury yields rose, a backdrop that has capped risk assets all quarter.
Adam
Haeems, Head of Asset Management at Tesseract Group, calls the popular parallel
misleading: "The comparison people are reaching for is June 2022," he
said, arguing the 2022 crash carried an insolvency cascade that today's
repricing does not.
The acute
leg began on June 5, when Bitcoin breached $62,000 and triggered about $1.5
billion in long liquidations.
The
mechanical driver since has been institutional money leaving through the same
door it entered. "None of that is a crypto-native failure," Haeems
said of the macro stack.
He puts
most of the weight on macro over crypto-specific catalysts, and the one
catalyst traders cite proves his point: Strategy sold roughly $2.5 million of
Bitcoin, its first sale since 2022, against a position orders of magnitude
larger.
The
pressure on Bitcoin comes from a stack of converging forces:
Record ETF redemptions: spot Bitcoin ETFs shed $4.06
billion in June, the largest monthly outflow on record
Hawkish Fed: Warsh's first FOMC removed the
easing bias and pushed any cut into 2027
Stronger dollar: firmer yields after the
meeting lifted the dollar and pressured risk assets
Macro over crypto-native: the Strategy sale read as a
signal, not supply that moved the market
My base
case is a grind to $44,100, the 100% Fibonacci extension and a 25% drop from
current levels. Paul Howard, Senior Director at Wincent, has read positioning
as defensive into recent expiries, a near-term setup that fits a $60,000 retest
from below rather than a recovery.
Haeems
declines to forecast a level at all: "I will not put a level on it,"
he said, tying the resolution to ETF flows and real yields rather than the
chart.
The bull
case rests on calls that now sit far above spot. Citi's post-CLARITY target is
$112,000, Bernstein and Standard Chartered hold $150,000, and FM Intelligence's
base case runs $95,000 to $130,000.
Each
assumes a flows recovery that the June tape flatly contradicts. On the
deep-bear side, Ted Pillows has floated a 60% to 65% drawdown before a bottom,
which would overshoot even my 161.8% extension.
My main
target is $44,100, the 100% Fibonacci extension of January's decline and a 25%
drop from $59,270. The first shelf below is the summer-2024 low near $53,700.
If selling deepens, the 2023 consolidation band between $25,100 and $31,500,
where the 161.8% extension sits, becomes the deep-bear case. Ted Pillows has
floated an even steeper 60% to 65% drawdown.
What does a weekly close
below $60,000 mean for Bitcoin?
A weekly
close carries more weight than an intraday move because it confirms the level
on a higher timeframe. The close below $60,000 flips former support into
resistance under the polarity principle, and price was rejected there this
week. It also coincides with a break of the ascending trendline drawn from
December 2022 lows, a second bearish signal on the weekly chart.
Are Bitcoin ETF outflows
driving the price drop?
Spot
Bitcoin ETF flows are the clearest real-time gauge of institutional demand, and
June set a record with $4.06 billion in net redemptions, topping February
2025's $3.56 billion. BlackRock's IBIT drove roughly three-quarters of it.
Combined with May, the two-month exit nears $6.5 billion and flipped 2026 flows
negative. Until flows turn positive, rebounds face net wrapper supply.
What would invalidate the
bearish Bitcoin price prediction?
Two things
would shift my bias. First, a daily and weekly reclaim of the $60,000 level,
with an intraday tag not counting. Second, and more important, a move back
above the 200-week EMA near $69,000, which now lies flat and overlaps the
March-to-June 2024 resistance highs. That would relieve pressure on buyers and
reopen the $66,600 and $76,400 EMAs above.
Bitcoin (BTC) traded at $59,270 on Tuesday, June 30, 2026,
after last week's candle closed below the $60,000 zone that contained every
2026 low, flipping former support into resistance. The break is a weekly-chart
event, not an intraday wick, and it carries more weight than any daily signal I
have flagged this month.
My Bitcoin
price prediction now targets a further 25% decline toward the $45,000 region,
the 100% Fibonacci extension of January's selloff.
Follow
me on X for real-time market analysis: @ChmielDk
Bitcoin Technical
Analysis: Weekly Close Below $60,000 Flips the Polarity
The weekly
candle closed below the $60,000 zone built on February's lows, and under the
polarity principle that floor now acts as a ceiling. Price tested it from below
at the start of this week and was rejected.
I stay
structurally bearish and set my main target at the 100% Fibonacci extension of
January's decline, near $44,100, the level I first mapped when I argued BTC risked a drop to $45,000. From $59,270 that marks a further
25% drop, and it is a higher-timeframe confirmation of my June bear-flag read on the daily chart.
Bitcoin price prediction: BTC/USD weekly close below $60,000. Source: Tradingview.com
Two more
shelves sit below the target. The summer-2024 lows near $53,700 are the first,
and a wider 2023 consolidation band between $25,100 and $31,500, where the
161.8% extension projects, is the deep-bear case.
The $44,100
zone also overlaps the price highs from the end of 2023, which gives the level
a second reason to matter. In 15 years as a trader and analyst, 10 of them at
FinanceMagnates.com, I have learned that a clean weekly close shifts the burden
of proof, and you can follow that work on my analyst page.
The second
weekly signal is a trendline break. The ascending line drawn across higher lows
from December 2022, actively tested in September and October 2023, held through
the first half of June and gave way this week.
The same
polarity flip at the $60,000 floor is one I flagged in a recent analysis, and the weekly close now hardens
it. What would flip my bias is a reclaim of $60,000 and, more importantly, the
200-week EMA near $69,000, now lying almost flat and overlapping the
March-to-June 2024 resistance highs.
Level
Type
Notes
$76,400
Resistance, daily 200 EMA
Long-term
trend divider, far overhead
$69,000-$70,000
Resistance, 200-week EMA
Bear-thesis
invalidation, aligns with Mar-Jun 2024 highs
$66,600
Resistance, daily 50 EMA
Caps near-term rebounds
$59,900-$60,000
Resistance, former support
Polarity
flip after weekly close, February lows
$53,700
Support
Summer-2024
lows, first downside shelf
$44,100
Support, 100% Fib extension
Main
target, 25% downside, late-2023 structure
$25,100-$31,500
Support
2023 consolidation, 161.8% extension deep target
The daily
chart says less. Price is pinned just under $60,000, orders are stalling, and a
short-term bullish reaction is not off the table. The structure stays bearish
while the 50 EMA near $66,600 and the 200 EMA near $76,400 cap every rebound.
After the
target is reached, I would expect a drawn-out corrective rebound before the
trend resumes, but that is a second-order question while price sits below the
broken floor.
Why is Bitcoin falling? BTC/USD daily chart pinned under $60K. Source: Tradingview.com
Why Is Bitcoin Falling?
The selloff
started outside crypto. The Federal Reserve under new chair Kevin Warsh held
rates at 3.5% to 3.75% on June 17, stripped the easing-bias language from its
statement, and erased the 2026 rate cut from the dot plot. The dollar firmed
and Treasury yields rose, a backdrop that has capped risk assets all quarter.
Adam
Haeems, Head of Asset Management at Tesseract Group, calls the popular parallel
misleading: "The comparison people are reaching for is June 2022," he
said, arguing the 2022 crash carried an insolvency cascade that today's
repricing does not.
The acute
leg began on June 5, when Bitcoin breached $62,000 and triggered about $1.5
billion in long liquidations.
The
mechanical driver since has been institutional money leaving through the same
door it entered. "None of that is a crypto-native failure," Haeems
said of the macro stack.
He puts
most of the weight on macro over crypto-specific catalysts, and the one
catalyst traders cite proves his point: Strategy sold roughly $2.5 million of
Bitcoin, its first sale since 2022, against a position orders of magnitude
larger.
The
pressure on Bitcoin comes from a stack of converging forces:
Record ETF redemptions: spot Bitcoin ETFs shed $4.06
billion in June, the largest monthly outflow on record
Hawkish Fed: Warsh's first FOMC removed the
easing bias and pushed any cut into 2027
Stronger dollar: firmer yields after the
meeting lifted the dollar and pressured risk assets
Macro over crypto-native: the Strategy sale read as a
signal, not supply that moved the market
My base
case is a grind to $44,100, the 100% Fibonacci extension and a 25% drop from
current levels. Paul Howard, Senior Director at Wincent, has read positioning
as defensive into recent expiries, a near-term setup that fits a $60,000 retest
from below rather than a recovery.
Haeems
declines to forecast a level at all: "I will not put a level on it,"
he said, tying the resolution to ETF flows and real yields rather than the
chart.
The bull
case rests on calls that now sit far above spot. Citi's post-CLARITY target is
$112,000, Bernstein and Standard Chartered hold $150,000, and FM Intelligence's
base case runs $95,000 to $130,000.
Each
assumes a flows recovery that the June tape flatly contradicts. On the
deep-bear side, Ted Pillows has floated a 60% to 65% drawdown before a bottom,
which would overshoot even my 161.8% extension.
My main
target is $44,100, the 100% Fibonacci extension of January's decline and a 25%
drop from $59,270. The first shelf below is the summer-2024 low near $53,700.
If selling deepens, the 2023 consolidation band between $25,100 and $31,500,
where the 161.8% extension sits, becomes the deep-bear case. Ted Pillows has
floated an even steeper 60% to 65% drawdown.
What does a weekly close
below $60,000 mean for Bitcoin?
A weekly
close carries more weight than an intraday move because it confirms the level
on a higher timeframe. The close below $60,000 flips former support into
resistance under the polarity principle, and price was rejected there this
week. It also coincides with a break of the ascending trendline drawn from
December 2022 lows, a second bearish signal on the weekly chart.
Are Bitcoin ETF outflows
driving the price drop?
Spot
Bitcoin ETF flows are the clearest real-time gauge of institutional demand, and
June set a record with $4.06 billion in net redemptions, topping February
2025's $3.56 billion. BlackRock's IBIT drove roughly three-quarters of it.
Combined with May, the two-month exit nears $6.5 billion and flipped 2026 flows
negative. Until flows turn positive, rebounds face net wrapper supply.
What would invalidate the
bearish Bitcoin price prediction?
Two things
would shift my bias. First, a daily and weekly reclaim of the $60,000 level,
with an intraday tag not counting. Second, and more important, a move back
above the 200-week EMA near $69,000, which now lies flat and overlaps the
March-to-June 2024 resistance highs. That would relieve pressure on buyers and
reopen the $66,600 and $76,400 EMAs above.
Damian Chmiel is a Senior Analyst & Editor at Finance Magnates with more than 15 years of experience in the CFD and online trading industry. Active as both a trader and journalist since 2010, he focuses on broker coverage, fintech innovation, and regulatory developments across Europe, the Middle East, and Asia.
His work includes interviews with C-level leaders at major brokerages and fintech platforms, as well as co-authoring Finance Magnates’ quarterly industry benchmarking reports. Damian’s reporting is data-driven, market-aware, and grounded in direct industry engagement. His analysis and commentary have also been cited by external media outlets, including Investing.com, Binance, The Asset, Stockhead, and Dispatch.
Education:
MA in Finance and Accounting, Cracow University of Economics
A 2 A.M. Alert, a Bad Night’s Sleep and a £25 Revolut Payout
Featured Videos
FM Daily Brief – 29 June 2026
FM Daily Brief – 29 June 2026
FM Daily Brief – 29 June 2026
FM Daily Brief – 29 June 2026
Today’s Monday, the 29th of June 2026, and these are our main stories: why foreign brokers are abandoning South Africa’s ODP licence regime, Plus500’s expansion into sports prediction markets, and regulatory concerns over staff trading controls in Dubai.
Today’s Monday, the 29th of June 2026, and these are our main stories: why foreign brokers are abandoning South Africa’s ODP licence regime, Plus500’s expansion into sports prediction markets, and regulatory concerns over staff trading controls in Dubai.
Today’s Monday, the 29th of June 2026, and these are our main stories: why foreign brokers are abandoning South Africa’s ODP licence regime, Plus500’s expansion into sports prediction markets, and regulatory concerns over staff trading controls in Dubai.
Today’s Monday, the 29th of June 2026, and these are our main stories: why foreign brokers are abandoning South Africa’s ODP licence regime, Plus500’s expansion into sports prediction markets, and regulatory concerns over staff trading controls in Dubai.
Shift Markets Review: The Shift Platform & White Label Prediction Markets
Shift Markets Review: The Shift Platform & White Label Prediction Markets
Shift Markets Review: The Shift Platform & White Label Prediction Markets
Shift Markets Review: The Shift Platform & White Label Prediction Markets
Shift Markets Review: The Shift Platform & White Label Prediction Markets
Shift Markets Review: The Shift Platform & White Label Prediction Markets
In this video, we review The Shift Platform by Shift Markets, a white label crypto exchange solution designed for brokerages, crypto exchanges, fintechs, banks, and other digital asset businesses.
We explore the platform's exchange infrastructure, including spot and derivatives trading, liquidity aggregation, market-making tools, digital asset ledger, API-first architecture, back-office management, and third-party integrations. We also take a look at Shift Markets' White Label Prediction Markets solution, which enables businesses to launch fully branded prediction markets for real-world events.
Watch the full video for a clear, fact-based overview of The Shift Platform, its core features, use cases, and the infrastructure powering modern digital asset trading businesses.
#ShiftMarkets #ShiftPlatform #WhiteLabelCryptoExchange #PredictionMarkets #WhiteLabelPredictionMarkets #CryptoExchange #CryptoInfrastructure #DigitalAssets #Fintech #FinanceMagnates #CryptoTrading #TradingTechnology
FM Daily Brief – 26 June 2026
FM Daily Brief – 26 June 2026
FM Daily Brief – 26 June 2026
FM Daily Brief – 26 June 2026
FM Daily Brief – 26 June 2026
FM Daily Brief – 26 June 2026
Today’s Friday, the 26th of June 2026, and these are our main stories: retail prop trading slips down Europe’s regulatory agenda, Mica reaches a major milestone for crypto markets, and Naga reports stronger audited results.
Today’s Friday, the 26th of June 2026, and these are our main stories: retail prop trading slips down Europe’s regulatory agenda, Mica reaches a major milestone for crypto markets, and Naga reports stronger audited results.
Today’s Friday, the 26th of June 2026, and these are our main stories: retail prop trading slips down Europe’s regulatory agenda, Mica reaches a major milestone for crypto markets, and Naga reports stronger audited results.
Today’s Friday, the 26th of June 2026, and these are our main stories: retail prop trading slips down Europe’s regulatory agenda, Mica reaches a major milestone for crypto markets, and Naga reports stronger audited results.
Today’s Friday, the 26th of June 2026, and these are our main stories: retail prop trading slips down Europe’s regulatory agenda, Mica reaches a major milestone for crypto markets, and Naga reports stronger audited results.
Today’s Friday, the 26th of June 2026, and these are our main stories: retail prop trading slips down Europe’s regulatory agenda, Mica reaches a major milestone for crypto markets, and Naga reports stronger audited results.
AI is changing every industry, but is it a threat or an opportunity?
AI is changing every industry, but is it a threat or an opportunity?
AI is changing every industry, but is it a threat or an opportunity?
AI is changing every industry, but is it a threat or an opportunity?
AI is changing every industry, but is it a threat or an opportunity?
AI is changing every industry, but is it a threat or an opportunity?
We asked attendees at IFX Expo International to share their thoughts, and while opinions differed, one message came through loud and clear: AI is a powerful opportunity when used responsibly.
Where do you stand? Let us know in the comments.
#AI #IFXExpo #Fintech #ArtificialIntelligence #Technology #Innovation
FM Daily Brief – 25 June 2026
FM Daily Brief – 25 June 2026
FM Daily Brief – 25 June 2026
FM Daily Brief – 25 June 2026
FM Daily Brief – 25 June 2026
FM Daily Brief – 25 June 2026
Today’s Thursday, the 25th of June 2026, and these are our main stories: AI agents are reshaping how traders access markets, XTB steps up its challenge to Trade Republic in Germany, and Indonesia tightens rules on finfluencers.
Today’s Thursday, the 25th of June 2026, and these are our main stories: AI agents are reshaping how traders access markets, XTB steps up its challenge to Trade Republic in Germany, and Indonesia tightens rules on finfluencers.
Today’s Thursday, the 25th of June 2026, and these are our main stories: AI agents are reshaping how traders access markets, XTB steps up its challenge to Trade Republic in Germany, and Indonesia tightens rules on finfluencers.
Today’s Thursday, the 25th of June 2026, and these are our main stories: AI agents are reshaping how traders access markets, XTB steps up its challenge to Trade Republic in Germany, and Indonesia tightens rules on finfluencers.
Today’s Thursday, the 25th of June 2026, and these are our main stories: AI agents are reshaping how traders access markets, XTB steps up its challenge to Trade Republic in Germany, and Indonesia tightens rules on finfluencers.
Today’s Thursday, the 25th of June 2026, and these are our main stories: AI agents are reshaping how traders access markets, XTB steps up its challenge to Trade Republic in Germany, and Indonesia tightens rules on finfluencers.