Bitcoin rose for a 4th straight session to $66,700 on June 16, 2026, a two-week high after bottoming at the $59,130 low earlier this month.
My analysis reads the bounce as a countertrend move inside the broad range that has capped Bitcoin near $70,000 since February's lows.
Standard Chartered targets $100,000 for late 2026 but warns of a $50,000 dip first, a downside that matches my own structural bear view.
Bitcoin (BTC) traded at
$66,700 on Tuesday, June 16, 2026, rising for a fourth straight session to a
two-week high as a US-Iran ceasefire and the first FOMC meeting under new Fed
Chair Kevin Warsh pulled buyers back into a market that bottomed at $59,130
this month.
Why Bitcoin
is going up comes down to two forces this week: easing geopolitical risk and a
cautious Fed, with the June 19 peace signing in Switzerland and Wednesday's dot
plot as the next triggers.
The round
$60,000 level absorbed sell pressure and turned into an accumulation zone,
lifting weight off the buyers' backs. BTC tested an intraday high near $67,000
before settling 0.5% higher. The recovery still sits 47% below the $126,198
record set on October 6, 2025.
Follow
me on X for real-time market analysis: @ChmielDk.
In my earlier analysis when Bitcoin was
falling, I argued
that holding below this range could open a path toward $50,000. I am setting
that scenario aside for now. Inside a consolidation, sideways action plays by
its own rules, and I do not chase a breakdown that has not happened.
In 15 years
analyzing markets, the last 10 of them at FinanceMagnates.com, I have learned
that consolidation ranges punish conviction in either direction. You can follow
more of my work on my analyst page.
If the
rebound extends, the first test is $70,000, a round number that lines up with
the 50-day EMA. Above it sits the $75,000 to $76,000 zone, the middle of the range I mapped in February and the site of last year's lows.
Why Bitcoin price is going up today? Source: Tradingview.com
The 200 EMA
near $79,000 is the line that matters most. The upper boundary of the
consolidation runs from $82,000 to $85,000.
Level
Type
Notes
$82,000-$85,000
Resistance
Upper
bound of the since-February range
$79,000
Resistance / 200 EMA
Bias-flip
trigger and trend separator
$75,000-$76,000
Resistance
Mid-range,
last year's lows
$70,000
Resistance / 50 EMA
First test, round number
$66,700
Spot (June 16)
4th up
session, two-week high
$60,000
Support
Buy-order accumulation zone
$59,130
Support
June low,
weakest since September 2024
$50,000
Target
Structural-bear scenario, delayed
My bias
stays bearish. The main trend is down, price sits below both the 50 and 200
EMA, and I am cautious on stronger, longer-term long positions. That bias
changes only on a clean break above the 200 EMA.
Until then
I treat this as a countertrend bounce inside a range, and I still see room
toward $50,000 over the medium term, a move that has been delayed rather than
canceled.
Why Is Bitcoin Going Up
Today?
The
strongest tailwind is geopolitical. President Trump authorized reopening the
Strait of Hormuz after the US and Iran agreed to a ceasefire, with a formal
signing set for June 19 in Switzerland.
Oil prices
fell sharply on the news, easing the inflation premium that energy markets built in during the
conflict. Lower
crude cools the inflation fear that had pushed traders out of risk assets.
Not
everyone trusts the relief. "The market is treating June 19 in Switzerland
as the real timestamp," said Nicolai Sondergaard, Research Analyst at
Nansen.
Sondergaard
noted that an April deal collapsed and that US strikes broke a second truce on
June 9, with Bitcoin handing back the entire relief move both times. Traders
burned twice this year are not redeploying in full ahead of the signing.
The second
catalyst is the Federal Reserve. The FOMC meets June 16 and 17, the first
meeting chaired by Warsh, who replaced Jerome Powell in May. CME FedWatch puts
the odds of a hold at 3.50% to 3.75% near 98%, so the focus falls on the dot
plot and Warsh's first press conference.
May CPI ran
at 4.2%, lifted by the energy shock, and prediction markets price 50% to 65%
odds of at least one 2026 rate hike.
Sentiment
is repairing from a deep low. The Crypto Fear and Greed Index climbed to 23,
still in fear territory but off the single-digit readings of last week.
"The
market is searching for a new equilibrium," said Linh Tran, Market Analyst
at XS.com. Tran traced the slide from the $80,000 area in mid-May to a low near
$59,000 and framed the bounce as positive fundamentals meeting a market that is
not yet in a supported bull cycle.
Four
forces explain why Bitcoin price is rising this week:
US-Iran ceasefire with a June 19 signing in
Switzerland and the Strait of Hormuz set to reopen
Oil prices falling, trimming the inflation
premium that weighed on risk assets
A near-certain Fed hold that shifts attention to
Warsh's dot plot on June 17
Returning institutional demand after weeks of outflows and
forced selling
Institutional Flows Return
to Bitcoin
The bid
under this bounce is institutional. Strategy, the Michael Saylor-led treasury
company, bought 1,587 BTC for roughly $100 million between June 8 and June 14,
lifting its stack to 846,842 BTC.
US spot Bitcoin ETFs turned positive with
$85.8 million of net inflows on June 13, a reversal from the record outflows earlier this year. Large holders
pulled more than 11,000 BTC off exchanges, a move that usually signals reduced
selling intent.
Strategy: plus 1,587 BTC for $100M,
total holdings 846,842 BTC
Spot ETFs: plus $85.8M net inflow on June
13, reversing late-May outflows
Exchange balances: 11,000+ BTC withdrawn by large
wallets
How High Can Bitcoin Go?
Price Predictions
How high
can Bitcoin go depends on whether this week's catalysts clear. Standard
Chartered's Geoff Kendrick holds a $100,000 year-end 2026 target, cut from
$150,000 in February, and warned the price could touch $50,000 first.
That
$50,000 dip lines up with my own downside scenario, while the rebound to
$100,000 assumes a liquidity turn I do not see before the 200 EMA breaks.
Bernstein keeps a $150,000 call for late 2026, which on my chart requires
reclaiming the $82,000 to $85,000 ceiling that nothing yet supports.
The broader
analyst field, polled by CNBC, spans $75,000 to $225,000 for 2026. The low end
is only my mid-range level, and the high end needs a full trend reversal.
A dovish
dot plot on June 17 could push Bitcoin toward $80,000, the top of my range, and
that is the single clearest near-term path higher. A hawkish surprise sends
price back toward $64,000, with a break there reopening the low $60,000s, near
the levels Peter Brandt's cycle work flagged for a final low this year.
Source
Target
Notes
Standard Chartered (Kendrick)
$100,000
Year-end
2026, warns of $50,000 dip first
Bernstein
$150,000
Late 2026
CNBC analyst poll
$75,000-$225,000
Full-year 2026 range
Dovish Fed scenario
~$80,000
If June
17 dot plot signals cuts
Fed reaction band
$64,000-$70,000
Hawkish
to dovish near-term swing
FAQ, Bitcoin Price
Analysis
Why is Bitcoin going up
today?
Bitcoin is
going up on two catalysts. A US-Iran ceasefire, with a June 19 signing in
Switzerland and the Strait of Hormuz reopening, pushed oil and inflation fears
lower. Ahead of the June 17 Fed decision, institutional buyers returned:
Strategy added 1,587 BTC, spot ETFs took in $85.8 million on June 13, and large
wallets pulled over 11,000 BTC off exchanges.
Why is Bitcoin price
rising after the recent crash?
Bitcoin
bottomed at $59,130 this month, its weakest level since September 2024, then
recovered as the $60,000 round level drew buy orders. The rebound reached a
fourth straight session and a two-week high near $67,000. The Crypto Fear and
Greed Index climbed to 23 from single digits, signaling that capitulation
selling has eased even though sentiment stays in fear territory.
How high can Bitcoin go in
2026?
Analyst
targets span $75,000 to $225,000 for 2026. Standard Chartered sees $100,000 by
year-end, Bernstein $150,000. My technical read is more measured: $70,000 is
the first resistance at the 50 EMA, then the $75,000 to $76,000 zone, then
$79,000 at the 200 EMA. I stay bearish until price closes above the 200 EMA.
What is the key level for
Bitcoin now?
The 200 EMA
near $79,000 is the level that matters most. It separates the bearish trend
from a bullish one, and my market bias flips only on a clean daily close above
it. Below that, $70,000 at the 50 EMA is the first test, while $60,000 remains
the accumulation floor that has absorbed sell pressure this month.
Will Bitcoin fall to
$50,000?
It is
possible but delayed. I argued in an earlier analysis that losing the
consolidation range could open a path toward $50,000, and Standard Chartered
flagged the same level. For now, price is holding inside the range, so I have
set that scenario aside. It returns to the table only if Bitcoin loses the
$59,130 June low on a daily close.
Bitcoin (BTC) traded at
$66,700 on Tuesday, June 16, 2026, rising for a fourth straight session to a
two-week high as a US-Iran ceasefire and the first FOMC meeting under new Fed
Chair Kevin Warsh pulled buyers back into a market that bottomed at $59,130
this month.
Why Bitcoin
is going up comes down to two forces this week: easing geopolitical risk and a
cautious Fed, with the June 19 peace signing in Switzerland and Wednesday's dot
plot as the next triggers.
The round
$60,000 level absorbed sell pressure and turned into an accumulation zone,
lifting weight off the buyers' backs. BTC tested an intraday high near $67,000
before settling 0.5% higher. The recovery still sits 47% below the $126,198
record set on October 6, 2025.
Follow
me on X for real-time market analysis: @ChmielDk.
In my earlier analysis when Bitcoin was
falling, I argued
that holding below this range could open a path toward $50,000. I am setting
that scenario aside for now. Inside a consolidation, sideways action plays by
its own rules, and I do not chase a breakdown that has not happened.
In 15 years
analyzing markets, the last 10 of them at FinanceMagnates.com, I have learned
that consolidation ranges punish conviction in either direction. You can follow
more of my work on my analyst page.
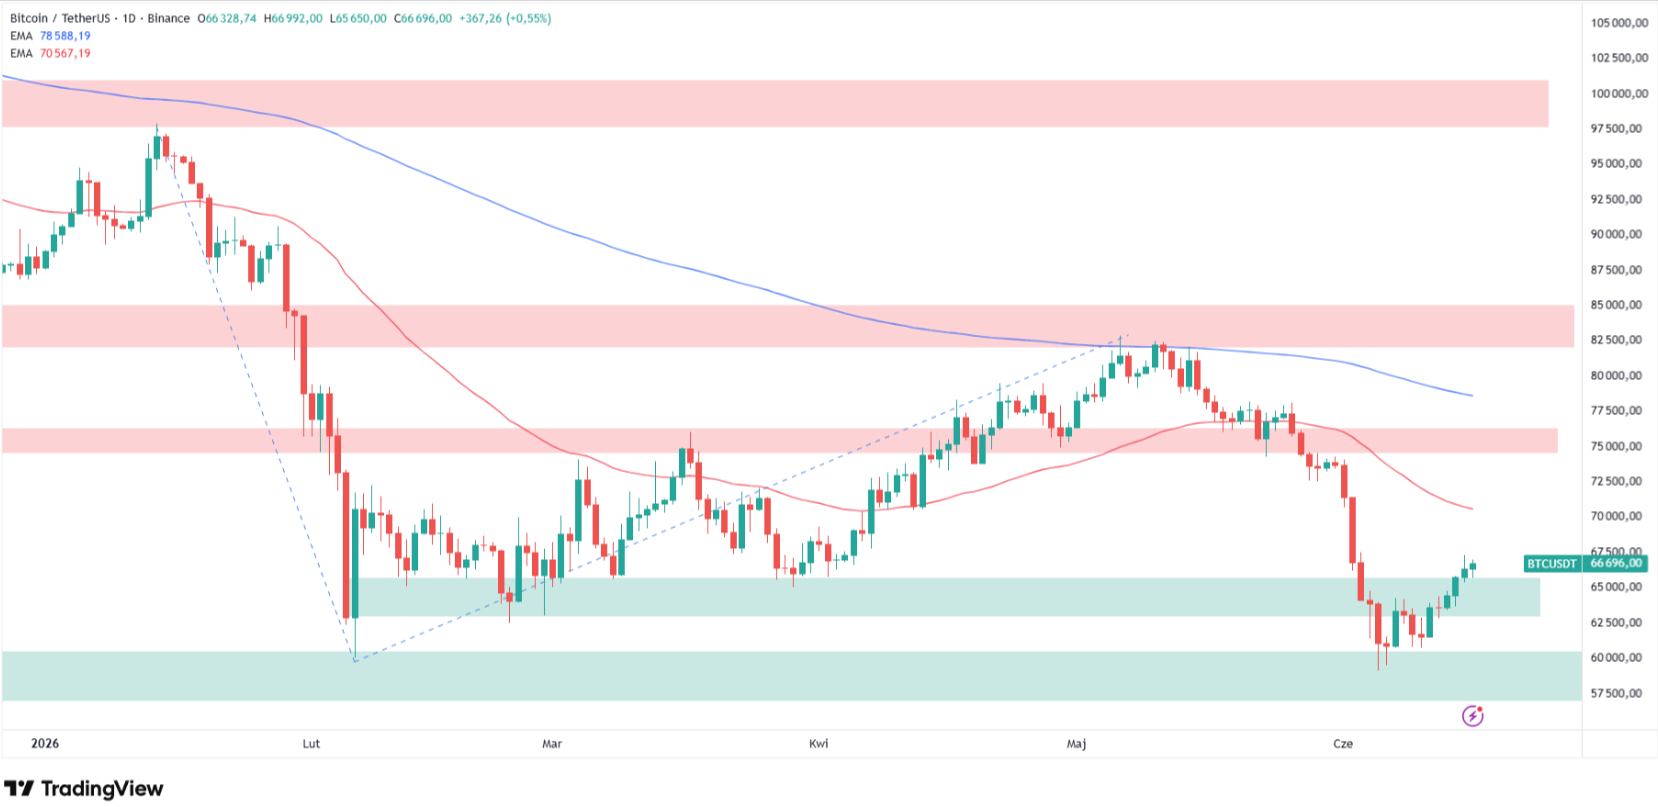
If the
rebound extends, the first test is $70,000, a round number that lines up with
the 50-day EMA. Above it sits the $75,000 to $76,000 zone, the middle of the range I mapped in February and the site of last year's lows.
Why Bitcoin price is going up today? Source: Tradingview.com
The 200 EMA
near $79,000 is the line that matters most. The upper boundary of the
consolidation runs from $82,000 to $85,000.
Level
Type
Notes
$82,000-$85,000
Resistance
Upper
bound of the since-February range
$79,000
Resistance / 200 EMA
Bias-flip
trigger and trend separator
$75,000-$76,000
Resistance
Mid-range,
last year's lows
$70,000
Resistance / 50 EMA
First test, round number
$66,700
Spot (June 16)
4th up
session, two-week high
$60,000
Support
Buy-order accumulation zone
$59,130
Support
June low,
weakest since September 2024
$50,000
Target
Structural-bear scenario, delayed
My bias
stays bearish. The main trend is down, price sits below both the 50 and 200
EMA, and I am cautious on stronger, longer-term long positions. That bias
changes only on a clean break above the 200 EMA.
Until then
I treat this as a countertrend bounce inside a range, and I still see room
toward $50,000 over the medium term, a move that has been delayed rather than
canceled.
Why Is Bitcoin Going Up
Today?
The
strongest tailwind is geopolitical. President Trump authorized reopening the
Strait of Hormuz after the US and Iran agreed to a ceasefire, with a formal
signing set for June 19 in Switzerland.
Oil prices
fell sharply on the news, easing the inflation premium that energy markets built in during the
conflict. Lower
crude cools the inflation fear that had pushed traders out of risk assets.
Not
everyone trusts the relief. "The market is treating June 19 in Switzerland
as the real timestamp," said Nicolai Sondergaard, Research Analyst at
Nansen.
Sondergaard
noted that an April deal collapsed and that US strikes broke a second truce on
June 9, with Bitcoin handing back the entire relief move both times. Traders
burned twice this year are not redeploying in full ahead of the signing.
The second
catalyst is the Federal Reserve. The FOMC meets June 16 and 17, the first
meeting chaired by Warsh, who replaced Jerome Powell in May. CME FedWatch puts
the odds of a hold at 3.50% to 3.75% near 98%, so the focus falls on the dot
plot and Warsh's first press conference.
May CPI ran
at 4.2%, lifted by the energy shock, and prediction markets price 50% to 65%
odds of at least one 2026 rate hike.
Sentiment
is repairing from a deep low. The Crypto Fear and Greed Index climbed to 23,
still in fear territory but off the single-digit readings of last week.
"The
market is searching for a new equilibrium," said Linh Tran, Market Analyst
at XS.com. Tran traced the slide from the $80,000 area in mid-May to a low near
$59,000 and framed the bounce as positive fundamentals meeting a market that is
not yet in a supported bull cycle.
Four
forces explain why Bitcoin price is rising this week:
US-Iran ceasefire with a June 19 signing in
Switzerland and the Strait of Hormuz set to reopen
Oil prices falling, trimming the inflation
premium that weighed on risk assets
A near-certain Fed hold that shifts attention to
Warsh's dot plot on June 17
Returning institutional demand after weeks of outflows and
forced selling
Institutional Flows Return
to Bitcoin
The bid
under this bounce is institutional. Strategy, the Michael Saylor-led treasury
company, bought 1,587 BTC for roughly $100 million between June 8 and June 14,
lifting its stack to 846,842 BTC.
US spot Bitcoin ETFs turned positive with
$85.8 million of net inflows on June 13, a reversal from the record outflows earlier this year. Large holders
pulled more than 11,000 BTC off exchanges, a move that usually signals reduced
selling intent.
Strategy: plus 1,587 BTC for $100M,
total holdings 846,842 BTC
Spot ETFs: plus $85.8M net inflow on June
13, reversing late-May outflows
Exchange balances: 11,000+ BTC withdrawn by large
wallets
How High Can Bitcoin Go?
Price Predictions
How high
can Bitcoin go depends on whether this week's catalysts clear. Standard
Chartered's Geoff Kendrick holds a $100,000 year-end 2026 target, cut from
$150,000 in February, and warned the price could touch $50,000 first.
That
$50,000 dip lines up with my own downside scenario, while the rebound to
$100,000 assumes a liquidity turn I do not see before the 200 EMA breaks.
Bernstein keeps a $150,000 call for late 2026, which on my chart requires
reclaiming the $82,000 to $85,000 ceiling that nothing yet supports.
The broader
analyst field, polled by CNBC, spans $75,000 to $225,000 for 2026. The low end
is only my mid-range level, and the high end needs a full trend reversal.
A dovish
dot plot on June 17 could push Bitcoin toward $80,000, the top of my range, and
that is the single clearest near-term path higher. A hawkish surprise sends
price back toward $64,000, with a break there reopening the low $60,000s, near
the levels Peter Brandt's cycle work flagged for a final low this year.
Source
Target
Notes
Standard Chartered (Kendrick)
$100,000
Year-end
2026, warns of $50,000 dip first
Bernstein
$150,000
Late 2026
CNBC analyst poll
$75,000-$225,000
Full-year 2026 range
Dovish Fed scenario
~$80,000
If June
17 dot plot signals cuts
Fed reaction band
$64,000-$70,000
Hawkish
to dovish near-term swing
FAQ, Bitcoin Price
Analysis
Why is Bitcoin going up
today?
Bitcoin is
going up on two catalysts. A US-Iran ceasefire, with a June 19 signing in
Switzerland and the Strait of Hormuz reopening, pushed oil and inflation fears
lower. Ahead of the June 17 Fed decision, institutional buyers returned:
Strategy added 1,587 BTC, spot ETFs took in $85.8 million on June 13, and large
wallets pulled over 11,000 BTC off exchanges.
Why is Bitcoin price
rising after the recent crash?
Bitcoin
bottomed at $59,130 this month, its weakest level since September 2024, then
recovered as the $60,000 round level drew buy orders. The rebound reached a
fourth straight session and a two-week high near $67,000. The Crypto Fear and
Greed Index climbed to 23 from single digits, signaling that capitulation
selling has eased even though sentiment stays in fear territory.
How high can Bitcoin go in
2026?
Analyst
targets span $75,000 to $225,000 for 2026. Standard Chartered sees $100,000 by
year-end, Bernstein $150,000. My technical read is more measured: $70,000 is
the first resistance at the 50 EMA, then the $75,000 to $76,000 zone, then
$79,000 at the 200 EMA. I stay bearish until price closes above the 200 EMA.
What is the key level for
Bitcoin now?
The 200 EMA
near $79,000 is the level that matters most. It separates the bearish trend
from a bullish one, and my market bias flips only on a clean daily close above
it. Below that, $70,000 at the 50 EMA is the first test, while $60,000 remains
the accumulation floor that has absorbed sell pressure this month.
Will Bitcoin fall to
$50,000?
It is
possible but delayed. I argued in an earlier analysis that losing the
consolidation range could open a path toward $50,000, and Standard Chartered
flagged the same level. For now, price is holding inside the range, so I have
set that scenario aside. It returns to the table only if Bitcoin loses the
$59,130 June low on a daily close.
Damian Chmiel is a Senior Analyst & Editor at Finance Magnates with more than 15 years of experience in the CFD and online trading industry. Active as both a trader and journalist since 2010, he focuses on broker coverage, fintech innovation, and regulatory developments across Europe, the Middle East, and Asia.
His work includes interviews with C-level leaders at major brokerages and fintech platforms, as well as co-authoring Finance Magnates’ quarterly industry benchmarking reports. Damian’s reporting is data-driven, market-aware, and grounded in direct industry engagement. His analysis and commentary have also been cited by external media outlets, including Investing.com, Binance, The Asset, Stockhead, and Dispatch.
Education:
MA in Finance and Accounting, Cracow University of Economics
Bitcoin Price Prediction: BTC Breaks Its 50-Month EMA in the Worst Month Since 2022
Featured Videos
FM Daily Brief – 31 July 2026
FM Daily Brief – 31 July 2026
FM Daily Brief – 31 July 2026
FM Daily Brief – 31 July 2026
Today's Friday, the 31st of July 2026, and these are our main stories: IG Group's $1.3 billion acquisition of Underdog, XTB's record-breaking share price, and Dubai's emergence as the retail FX industry's new talent hub.
Today's Friday, the 31st of July 2026, and these are our main stories: IG Group's $1.3 billion acquisition of Underdog, XTB's record-breaking share price, and Dubai's emergence as the retail FX industry's new talent hub.
Today's Friday, the 31st of July 2026, and these are our main stories: IG Group's $1.3 billion acquisition of Underdog, XTB's record-breaking share price, and Dubai's emergence as the retail FX industry's new talent hub.
Today's Friday, the 31st of July 2026, and these are our main stories: IG Group's $1.3 billion acquisition of Underdog, XTB's record-breaking share price, and Dubai's emergence as the retail FX industry's new talent hub.
Today's Thursday, the 30th of July 2026, and these are our main stories: Squared Financial's offshore operations appear to have gone dark, XTB's investment products continue to attract new clients, and Trade Nation outlines its European growth strategy.
Today's Thursday, the 30th of July 2026, and these are our main stories: Squared Financial's offshore operations appear to have gone dark, XTB's investment products continue to attract new clients, and Trade Nation outlines its European growth strategy.
Today's Thursday, the 30th of July 2026, and these are our main stories: Squared Financial's offshore operations appear to have gone dark, XTB's investment products continue to attract new clients, and Trade Nation outlines its European growth strategy.
Today's Thursday, the 30th of July 2026, and these are our main stories: Squared Financial's offshore operations appear to have gone dark, XTB's investment products continue to attract new clients, and Trade Nation outlines its European growth strategy.
Today's Thursday, the 30th of July 2026, and these are our main stories: Squared Financial's offshore operations appear to have gone dark, XTB's investment products continue to attract new clients, and Trade Nation outlines its European growth strategy.
Today's Thursday, the 30th of July 2026, and these are our main stories: Squared Financial's offshore operations appear to have gone dark, XTB's investment products continue to attract new clients, and Trade Nation outlines its European growth strategy.
FM Daily Brief – 29 July 2026
FM Daily Brief – 29 July 2026
FM Daily Brief – 29 July 2026
FM Daily Brief – 29 July 2026
FM Daily Brief – 29 July 2026
FM Daily Brief – 29 July 2026
Today's Wednesday, the 29th of July 2026, and these are our main stories: Cyprus and Poland go head-to-head as CFD licensing hubs, but is there a winner? Mas Markets takes a stake in Solid, and Swissquote UK's losses deepen.
Today's Wednesday, the 29th of July 2026, and these are our main stories: Cyprus and Poland go head-to-head as CFD licensing hubs, but is there a winner? Mas Markets takes a stake in Solid, and Swissquote UK's losses deepen.
Today's Wednesday, the 29th of July 2026, and these are our main stories: Cyprus and Poland go head-to-head as CFD licensing hubs, but is there a winner? Mas Markets takes a stake in Solid, and Swissquote UK's losses deepen.
Today's Wednesday, the 29th of July 2026, and these are our main stories: Cyprus and Poland go head-to-head as CFD licensing hubs, but is there a winner? Mas Markets takes a stake in Solid, and Swissquote UK's losses deepen.
Today's Wednesday, the 29th of July 2026, and these are our main stories: Cyprus and Poland go head-to-head as CFD licensing hubs, but is there a winner? Mas Markets takes a stake in Solid, and Swissquote UK's losses deepen.
Today's Wednesday, the 29th of July 2026, and these are our main stories: Cyprus and Poland go head-to-head as CFD licensing hubs, but is there a winner? Mas Markets takes a stake in Solid, and Swissquote UK's losses deepen.
FM Daily Brief – 28 July 2026
FM Daily Brief – 28 July 2026
FM Daily Brief – 28 July 2026
FM Daily Brief – 28 July 2026
FM Daily Brief – 28 July 2026
FM Daily Brief – 28 July 2026
Today's Tuesday, the 28th of July 2026, and these are our main stories: tastytrade enters the CFTC regulated prediction markets, Mitrade renews its Argentina football sponsorship, and the Tokyo Stock Exchange pushes to lower the cost of investing.
Today's Tuesday, the 28th of July 2026, and these are our main stories: tastytrade enters the CFTC regulated prediction markets, Mitrade renews its Argentina football sponsorship, and the Tokyo Stock Exchange pushes to lower the cost of investing.
Today's Tuesday, the 28th of July 2026, and these are our main stories: tastytrade enters the CFTC regulated prediction markets, Mitrade renews its Argentina football sponsorship, and the Tokyo Stock Exchange pushes to lower the cost of investing.
Today's Tuesday, the 28th of July 2026, and these are our main stories: tastytrade enters the CFTC regulated prediction markets, Mitrade renews its Argentina football sponsorship, and the Tokyo Stock Exchange pushes to lower the cost of investing.
Today's Tuesday, the 28th of July 2026, and these are our main stories: tastytrade enters the CFTC regulated prediction markets, Mitrade renews its Argentina football sponsorship, and the Tokyo Stock Exchange pushes to lower the cost of investing.
Today's Tuesday, the 28th of July 2026, and these are our main stories: tastytrade enters the CFTC regulated prediction markets, Mitrade renews its Argentina football sponsorship, and the Tokyo Stock Exchange pushes to lower the cost of investing.
FM Daily Brief – 27 July 2026
FM Daily Brief – 27 July 2026
FM Daily Brief – 27 July 2026
FM Daily Brief – 27 July 2026
FM Daily Brief – 27 July 2026
FM Daily Brief – 27 July 2026
Today's Monday, the 27th of July 2026, and these are our main stories: iFOREX reports stronger client growth despite currency headwinds, BlackBull's New Zealand business expands, and the FCA highlights Consumer Duty good practice.
Today's Monday, the 27th of July 2026, and these are our main stories: iFOREX reports stronger client growth despite currency headwinds, BlackBull's New Zealand business expands, and the FCA highlights Consumer Duty good practice.
Today's Monday, the 27th of July 2026, and these are our main stories: iFOREX reports stronger client growth despite currency headwinds, BlackBull's New Zealand business expands, and the FCA highlights Consumer Duty good practice.
Today's Monday, the 27th of July 2026, and these are our main stories: iFOREX reports stronger client growth despite currency headwinds, BlackBull's New Zealand business expands, and the FCA highlights Consumer Duty good practice.
Today's Monday, the 27th of July 2026, and these are our main stories: iFOREX reports stronger client growth despite currency headwinds, BlackBull's New Zealand business expands, and the FCA highlights Consumer Duty good practice.
Today's Monday, the 27th of July 2026, and these are our main stories: iFOREX reports stronger client growth despite currency headwinds, BlackBull's New Zealand business expands, and the FCA highlights Consumer Duty good practice.