

Bitcoin (BTC) traded at $62,394 on Tuesday, June 23, 2026, down 2.54% on the session and pinned inside a bear pennant on the daily chart. My Bitcoin price prediction reads the formation toward $38,000, a level that overlaps the 2024 lows almost to the dollar.
Price holds just above the $59,000-$60,000 shelf, this year's floor, with two catalysts due this week.
The May PCE print lands Thursday, June 25, and the quarterly options expiry clears Friday, June 26, both with the broader trend pointing lower and every moving average I track above price.
In this article, I check why Bitcoin price is falling and how low BTC can go when the bearish flag scenario materializes.
Follow me on X for real-time market analysis: @ChmielDk
Why Is Bitcoin Stuck Below $65,000?
Bitcoin trades the rates channel, not the geopolitical one. The US-Iran ceasefire signed June 19 in Switzerland repriced oil lower and lifted equities, yet Bitcoin did not follow, because the same week's Federal Reserve meeting leaned hawkish and pushed a possible 2026 rate hike back onto the curve.
As in April's Strait of Hormuz shock, the geopolitical move repriced oil first and crypto second.
"Crypto is trading the rates channel, not the geopolitical one," said Adam Haeems, Head of Asset Management at Tesseract Group.
Haeems frames Thursday's PCE as a volatility event rather than a directional one, with thinner quarter-end liquidity set to amplify whichever way the print breaks.
- Why Is Bitcoin Going Up Today? BTC Price Eyes $70K Test
- Will Bitcoin Price Fall Below $50K? BTC Drops to 4-Month Low Near $61,300 in a 13% Three-Day Slide
- BTC Risks 40% Drop to $45K According to This Bitcoin Price Prediction
Paul Howard, Senior Director at Wincent, reads positioning as defensive.
On-chain data shows large holders carrying short Bitcoin positions as a hedge into the options expiry, he notes, a setup that points lower in the near term. The dollar held firm and Treasury yields rose across the curve after the meeting, a backdrop that has capped risk assets.
The pressure on Bitcoin comes from a stack of converging forces:
- Hawkish Fed: the June FOMC signaled a possible 2026 hike, lifting yields across the curve
- Rates over geopolitics: the Iran ceasefire moved oil and equities, not crypto
- PCE risk: Thursday's May inflation print can reprice rate expectations into the weekend
- Defensive positioning: whales hold short hedges into Friday's quarterly options expiry
- Thin liquidity: quarter-end books amplify any directional flow
Bitcoin Technical Analysis: The Bear Pennant Targeting $38,000
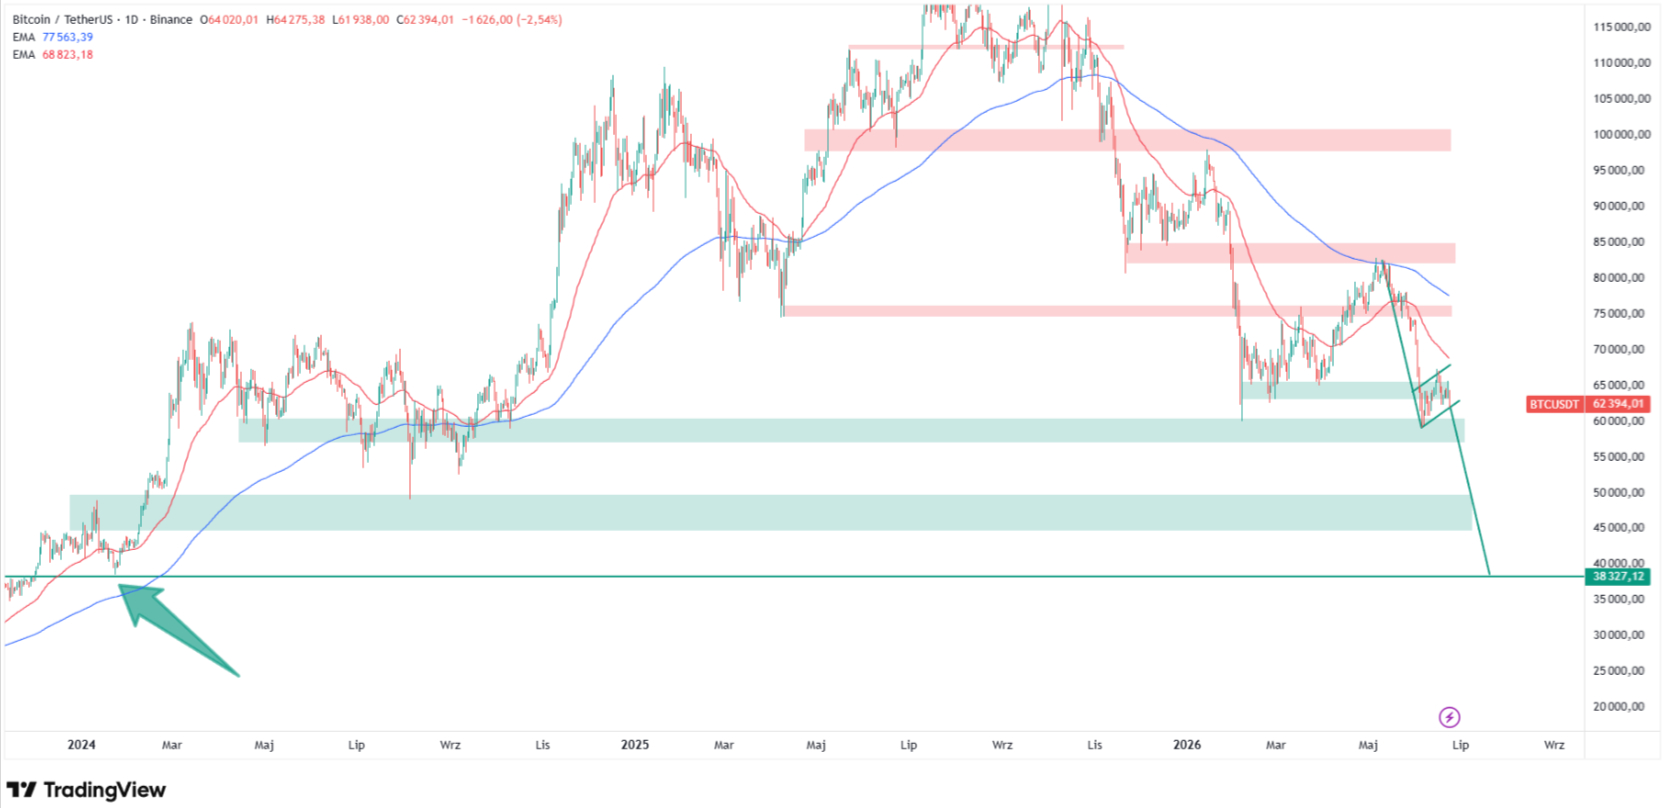
Price action stays trapped under every moving average I track. The 50 EMA at $68,823 and the 200 EMA at $77,563 both sit above spot, the bearish stack that has defined the tape since the February breakdown. My chart shows Bitcoin pinned inside a bear pennant just above the $60,000 shelf, roughly 50% below the $126,198 record set on October 6, 2025.
The pennant formed after the slide from the $84,000 shelf, and its measured move points lower. Projected from the breakdown, the move runs roughly 40% to $38,000. That level matters because it overlaps the 2024 lows almost to the dollar, where my chart marks the $38,327 floor. In 15 years reading daily charts, a pennant pinned under a falling 200 EMA has rarely resolved higher.
The trigger is the $59,000-$60,000 band, this year's lows set in February and tested again in June, a floor I flagged last week. A daily close below it opens the $45,000-$50,000 support built in 2024, then the $38,000 target. My earlier $45,000 Fibonacci target stays in play as the first stop on that path.
The bull case needs a reclaim of $76,000-$77,500, the 200 EMA. Until that prints on a daily close, every rally is a sell candidate in my framework.
Level | Type | Notes |
$76,000-$77,500 | Resistance / 200 EMA | Trend divider; bull reclaim line |
$68,823 | Resistance / 50 EMA | First cap on any bounce |
$59,000-$60,000 | Support | Feb and June 2026 lows; daily-close trigger |
$45,000-$50,000 | Support | 2024 structure; prior Fibonacci target |
$38,000 | Target | Pennant measured move; near-exact 2024 low |
How Low Can Bitcoin Go? Bitcoin Price Predictions
External targets span a wide range, and each one reads differently against my levels. Paul Howard sees a near-term floor. "My expectation is we retest the $60k range," said Howard, Senior Director at Wincent, tied to Friday's options expiry. That matches my own trigger, since a daily close below $60,000 is what opens the deeper path on my chart.
Standard Chartered's $50,000 flag aligns with my own sub-$60,000 path, the next shelf before $38,000. CoinCodex's model flags $75,000-$76,000 as near-term resistance, the same 200-EMA ceiling I fade. Across my prior Bitcoin coverage on my analyst page, the bear case has tracked from $74,500 down to today's $38,000 projection.
On the bull side, as FinanceMagnates.com reported in May, Citi set $112,000 and Bernstein $150,000 after the CLARITY Act vote, both requiring a reclaim of the 200 EMA near $77,000 first. My chart shows no evidence of that yet.
JPMorgan's $240,000 long-term target sits furthest out, supported by its estimate of Bitcoin's production cost near $77,000, currently above spot, a condition that has historically preceded reversals. That is a multi-year case on my chart, not a 2026 one.
Source | Target | Notes |
Damian Chmiel (pennant) | $38,000 | Measured move plus 2024-low confluence |
Standard Chartered | $50,000 | Downside flag on sub-$60,000 break |
Paul Howard, Wincent | $60,000 | Near-term retest into options expiry |
CoinCodex model | $75,000-$76,000 | Near-term resistance at the 200 EMA |
Citi | $112,000 | Post-CLARITY Act, May 2026 |
Bernstein | $150,000 | Post-CLARITY Act, May 2026 |
JPMorgan | $240,000 | Long-term; production cost near $77,000 |
FAQ: Bitcoin Price Analysis
How low can Bitcoin go in 2026?
My chart's bear pennant projects a measured move near 40% to $38,000, which overlaps the 2024 lows almost to the dollar. The path runs through the $59,000-$60,000 support and the $45,000-$50,000 zone built in 2024. A daily close below $60,000 is the trigger that activates the deeper targets, and price holds just above that line for now.
Why is Bitcoin not rising after the Iran ceasefire?
Bitcoin trades the rates channel, not geopolitics. The June 19 ceasefire repriced oil lower and lifted equities, but the same week's hawkish Federal Reserve meeting pushed a possible 2026 rate hike onto the curve. With formal forward guidance reduced, each data print does more work, and Thursday's PCE now carries the weekend's directional risk for crypto.
What is the bear pennant target for Bitcoin?
The pennant on my daily chart projects toward $38,000. The measured move runs roughly 40% from current levels, and the target lines up with the 2024 lows near $38,327. The bear case stays active while price holds below the 200 EMA at $77,563. A daily close above $77,500 would neutralize the formation.
What would invalidate the bearish Bitcoin outlook?
A daily close back above the $76,000-$77,500 band, the 200 EMA, is the minimum the bulls need. Sustained positive weekly ETF flows and a soft PCE print that restores 2026 rate-cut expectations would reinforce a reversal. Until those align, my framework treats every rally as a sell candidate inside a confirmed downtrend.
What are analysts' Bitcoin price predictions for 2026?
Targets span a wide range. Paul Howard of Wincent expects a $60,000 retest into options expiry, while Standard Chartered flags $50,000 on a breakdown. On the bull side, Citi set $112,000 and Bernstein $150,000 after the May CLARITY Act vote, both requiring a reclaim of the 200 EMA near $77,000 first.


