
Bitcoin (BTC) traded at $77,650 per coin on Monday, April 27, 2026, slipping 1% after testing $79,500 during the Asian session, the highest level in roughly two and a half months.
The pullback came two days after veteran trader Peter Brandt published a multi-year Bitcoin price prediction targeting a $300,000 to $500,000 cycle peak by September-October 2029, conditional on the four-year halving rhythm that has defined BTC since 2011 continuing to hold.
Brandt also flagged that his framework calls for one more investable low in September-October 2026, which may or may not penetrate the February 2026 swing low near $63,000. The next 48 hours hinge on whether buyers can clear the $80,000 resistance band or get rejected back into the $73,500-$78,000 range.
Follow me on X for real-time crypto market analysis: @ChmielDk
Why Brandt's Bitcoin Price Prediction Hinges On The 4-Year Cycle?
Bitcoin's four-year cycle thesis, anchored to halving events in 2012, 2016, 2020 and 2024, has been the structural backbone of every major BTC bull and bear market. Brandt's argument is that those cycles are not pattern-recognition coincidence, they are the most predictable rhythm in any liquid asset of the past 15 years.
"Should Bitcoin continue with the most remarkable cyclic patterns of any market in the past 15 years, an investable low is scheduled for Sep/Oct 2026," Brandt wrote in an April 23 post on X. "That low might or might not penetrate the Feb 2026 low.
The next high (should patterns continue) will be between $300k and $500k in Sep/Oct 2029." Brandt added that he would announce tradable thrusts via his Factor Report and BitcoinLive platforms.
The target sits well above the institutional consensus. As the FinanceMagnates.com report from April 2 detailed, JPMorgan's structural model points to $240,000-$266,000, while Standard Chartered's revised path now targets $500,000 by 2030 instead of 2026. eToro CEO Yoni Assia projects $250,000 within the current cycle, as I covered in my previous analysis.
The Brandt thesis rests on three pillars worth separating from the standard "$1M Bitcoin" calls:
- The framework treats halving cycles, not macro events, as the dominant driver of Bitcoin 's multi-year price action
- The $300K-$500K target is conditional, not unconditional, which separates it from open-ended bull projections
- A confirmed September-October 2026 low is required first, with potential downside below February's sub-$63,000 print
"Brandt’s view carries some merit," Paul Howard, Director at Wincent, commented for FinanceMagnates.com. "As both an inflation hedge and a highly liquid store of value, Bitcoin possesses several characteristics that could support a 3.5x price increase over the next three years. Based on historical price cycles and frameworks such as the stock-to-flow model, this outlook represents a reasonable thesis grounded in the asset’s past performance."
Why Brandt Says This Is Not The Bottom Yet
Brandt's response to a chart from JDK Analysis arguing for a "Short Re-Accumulation" structure was unequivocal. "This does not look like a bottom," Brandt replied to the post. The chart he was responding to showed repeated rejections at local highs, fading volume on each push, and an invalidation level near $80,500.
JDK acknowledged the conditional nature of the call. "As long as bulls fail to show clear strength and follow-through, the current low does not qualify as a strong bottom. This is purely a probabilistic view!" the analyst wrote. The setup pointed to continuation lower as the higher-probability path absent a clean break above resistance.
- When Will Bitcoin Hit 100K Again; Japanese Firm Metaplanet Adds 330 BTC
- Why Bitcoin Is Going Down: MetaMask Plans BTC, Solana with Gas-Free Transactions
- Bitcoin Drops Below 95K: Strategy Invests $2 Billion to Acquire 20,356 BTC
Brandt also amplified chartist Aksel Kibar, calling him the most accomplished pure classical chart analyst alive today. "Sometimes I get criticized by followers who have a position and want to see updates confirming that position on 'adjusting' the boundaries," Kibar wrote. "Well, as the market offers new information we need to adjust. We can't be dogmatic about our analysis. What looks like a wedge, can morph into a channel."
The technical concerns supporting the "not yet" thesis cluster around three points:
- Bitcoin still trades below the 365-day average near $87,000
- Volume has faded on each push toward the upper boundary of the current channel
- The morphing wedge-to-channel structure has rejected price at the upper boundary multiple times
Bitcoin Technical Analysis: $80K Resistance, $73,500 Support
Bitcoin briefly tested $79,500 during the Asian session on Monday, April 27, 2026, before sellers rejected the move and pushed price back below $78,000.
My chart shows the rally over the past two weeks has cleared the upper boundary of the prior consolidation, which I had marked at $75,000 and which had capped every advance attempt since early March. That level held as support on first retest, which is technically constructive.
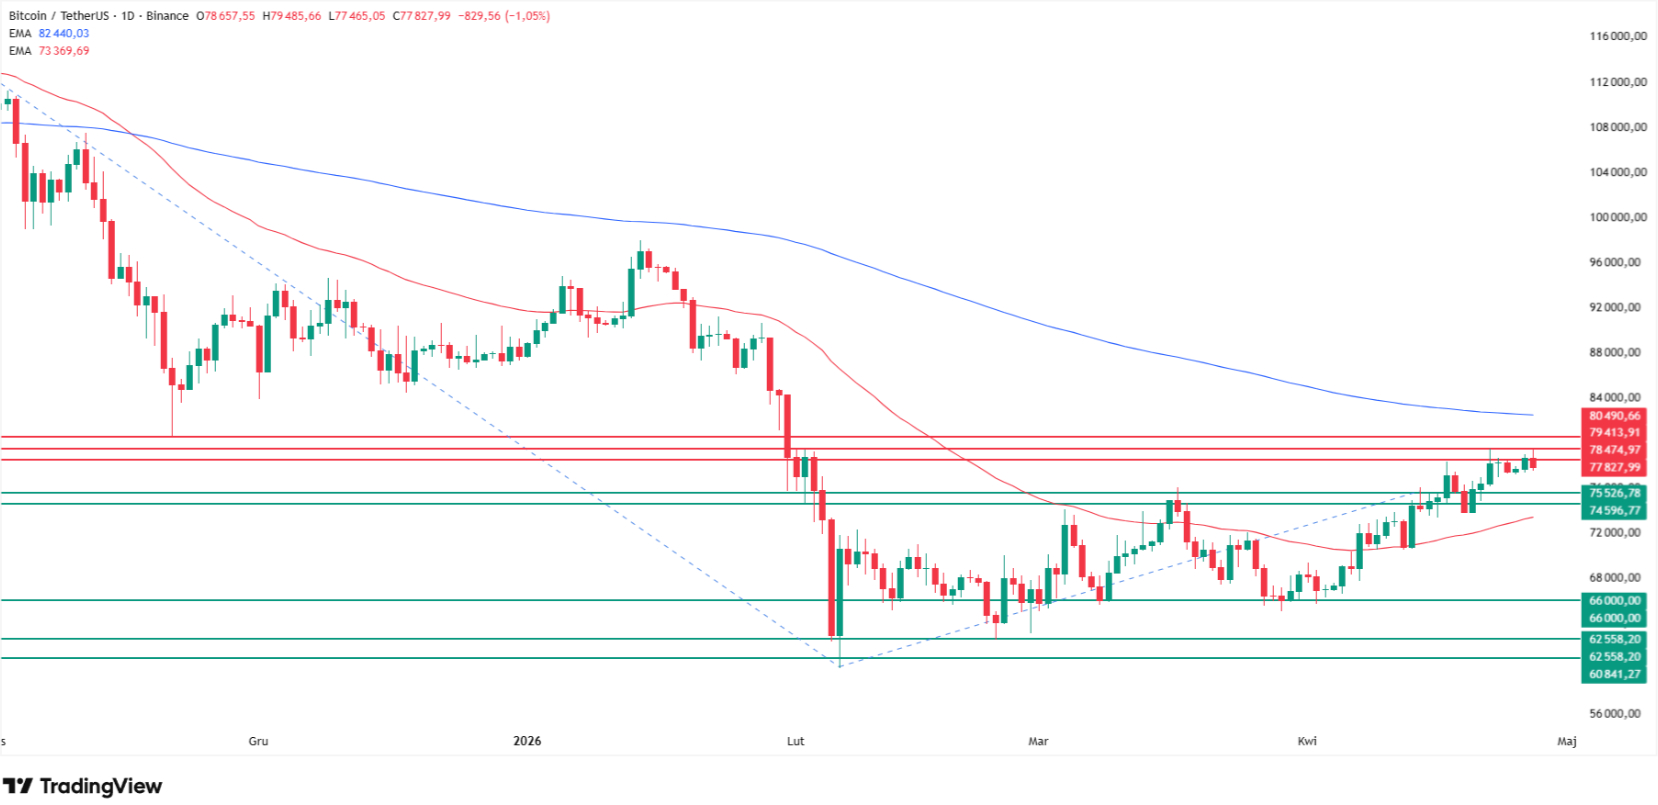
The resistance picture above current price is stacked. The $80,000 zone aligns with the November 21 swing lows and last week's local highs. Above that, the 200-period moving average sits at $82,700, the level that separates the prevailing bearish trend from a confirmed bullish reversal.
As the FinanceMagnates.com report from April 9 noted, the $80,000 breakout test has been the controlling question for BTC since the Iran ceasefire short squeeze.
Until the 200 EMA flips, my base case is continued sideways action inside a wider $73,500-$82,700 range, with the directional bias tilting toward the upper bound only on a sustained close above $80,000. A rejection here would shift focus back to the support layers below.
Level | Type | Notes |
$82,700 | Resistance / 200 EMA | Bull/bear trend separator |
$80,000 | Resistance | Last week's high, Nov 21 swing zone |
$75,000 | Reclaimed support | Broken to upside mid-April |
$73,500 | Support / 50 EMA | First downside target on rejection |
$66,000 | Support | March/April 2026 swing lows |
$61,000-$63,000 | Support | Lower consolidation floor, Feb 2026 low |
If $73,500 fails, the path opens toward $66,000 and ultimately the $61,000-$63,000 zone where Brandt's "investable low" could form. As the FinanceMagnates.com report from April 15 detailed, the $60,000 floor scenario remains live as long as price stays below the 200 MA.
Bitcoin Price Predictions: From $500K Bull Case To $50K Bear Risk
The institutional forecast range for Bitcoin remains exceptionally wide, reflecting the depth of disagreement on cycle interpretation. The $300,000-$500,000 number from Brandt is not unprecedented on this site.
A $300,000 call option on Deribit was a top pick in the crypto options market last cycle, as I wrote in earlier coverage on FinanceMagnates.com. What is different in Brandt's framing is the conditional structure and the multi-year horizon.
Source | Target | Notes |
Peter Brandt | $300K-$500K | Sep/Oct 2029 cycle peak (conditional) |
Standard Chartered | $500,000 | Revised to 2030 from prior 2026 |
JPMorgan | $240K-$266K | Long-term structural |
eToro / Yoni Assia | $250,000 | 2026 cycle target |
$1,000,000 | Long-term, no timeline | |
Carol Alexander, U. of Sussex | $75K-$150K | 2026 high-volatility range |
Galaxy / Alex Thorn | "Tough to predict" | 2026 base case |
$50,400 | 2026 bear leg of 4-year cycle |
The forecasts split cleanly along time horizon and methodology lines.
For now, the resistance at $80,000-$82,700 is the level that matters. Until it breaks, my analysis treats Brandt's $500,000 target as a long-horizon scenario, not an active trade.
FAQ
Can Bitcoin really hit $500,000 by 2029?
Peter Brandt's projection of $300,000 to $500,000 by September-October 2029 is conditional on Bitcoin's four-year cycle pattern continuing to hold. Brandt explicitly framed the target as scenario-dependent, not a base case. Standard Chartered also targets $500,000, but pushed its timeline back to 2030. The target requires sustained ETF inflows, no major macro disruption, and confirmation of the 2026 cycle low first.
What is Bitcoin's price today?
Bitcoin traded at approximately $77,650 per coin on Monday, April 27, 2026, slipping roughly 1% on the day after testing $79,500 during the Asian session. The cryptocurrency remains 38% below its October 2025 all-time high near $126,000, but has reclaimed the $75,000 level that had capped every advance since early March 2026.
Why does Peter Brandt say Bitcoin has not bottomed?
Brandt cited the absence of strong follow-through buying, fading volume on rallies, and rejections at the upper boundary of the current channel. He responded to a JDK Analysis chart with "This does not look like a bottom." His four-year cycle framework calls for an investable low in September-October 2026 that may or may not penetrate the February 2026 low near $63,000.
What are Bitcoin's key support and resistance levels?
Resistance sits at $80,000 (last week's high), $82,700 (200 MA), and the $126,000 all-time high. Key supports include $75,000 (reclaimed mid-April), $73,500 (50 EMA), $66,000 (March/April lows), and $61,000-$63,000 (lower consolidation, February 2026 low). The 200 MA at $82,700 separates the bearish trend from a confirmed bullish reversal.
How high can Bitcoin go in 2026?
Institutional forecasts for 2026 cluster between $75,000 and $250,000. Carol Alexander projects a $75K-$150K range. Standard Chartered targets $150,000 for year-end 2026. eToro's Yoni Assia sees $250,000. Canary Capital's bear case targets $50,400 if 2026 is the cycle's bear leg. The wide range reflects deep disagreement on whether 2026 is a mid-cycle correction or a bear market.