The 50-day EMA closed above the 200-day line on September 12, ending a death cross that had held since November 2025.
12-0 Fed hike and higher 2027 dots failed to push BTC through $75,000, with both EMAs rising just below that floor.
Let's check how high can Bitcoin price go in 2026
Bitcoin (BTC) edged 1.8% higher to $77,813 on Binance today (Friday), two days after the Federal Reserve's first rate hike since 2023 failed to push the cryptocurrency through its $75,000 floor. The bounce comes with a technical shift Bitcoin has not shown since November 2025: the 50-day exponential moving average (EMA) now sits above the 200-day line.
The golden cross turns the trend on my daily chart officially bullish. Price still has to clear the $82,614 ceiling of the consolidation before my $100,000 target becomes active.
Golden Cross Confirmed After Two Weeks of Convergence
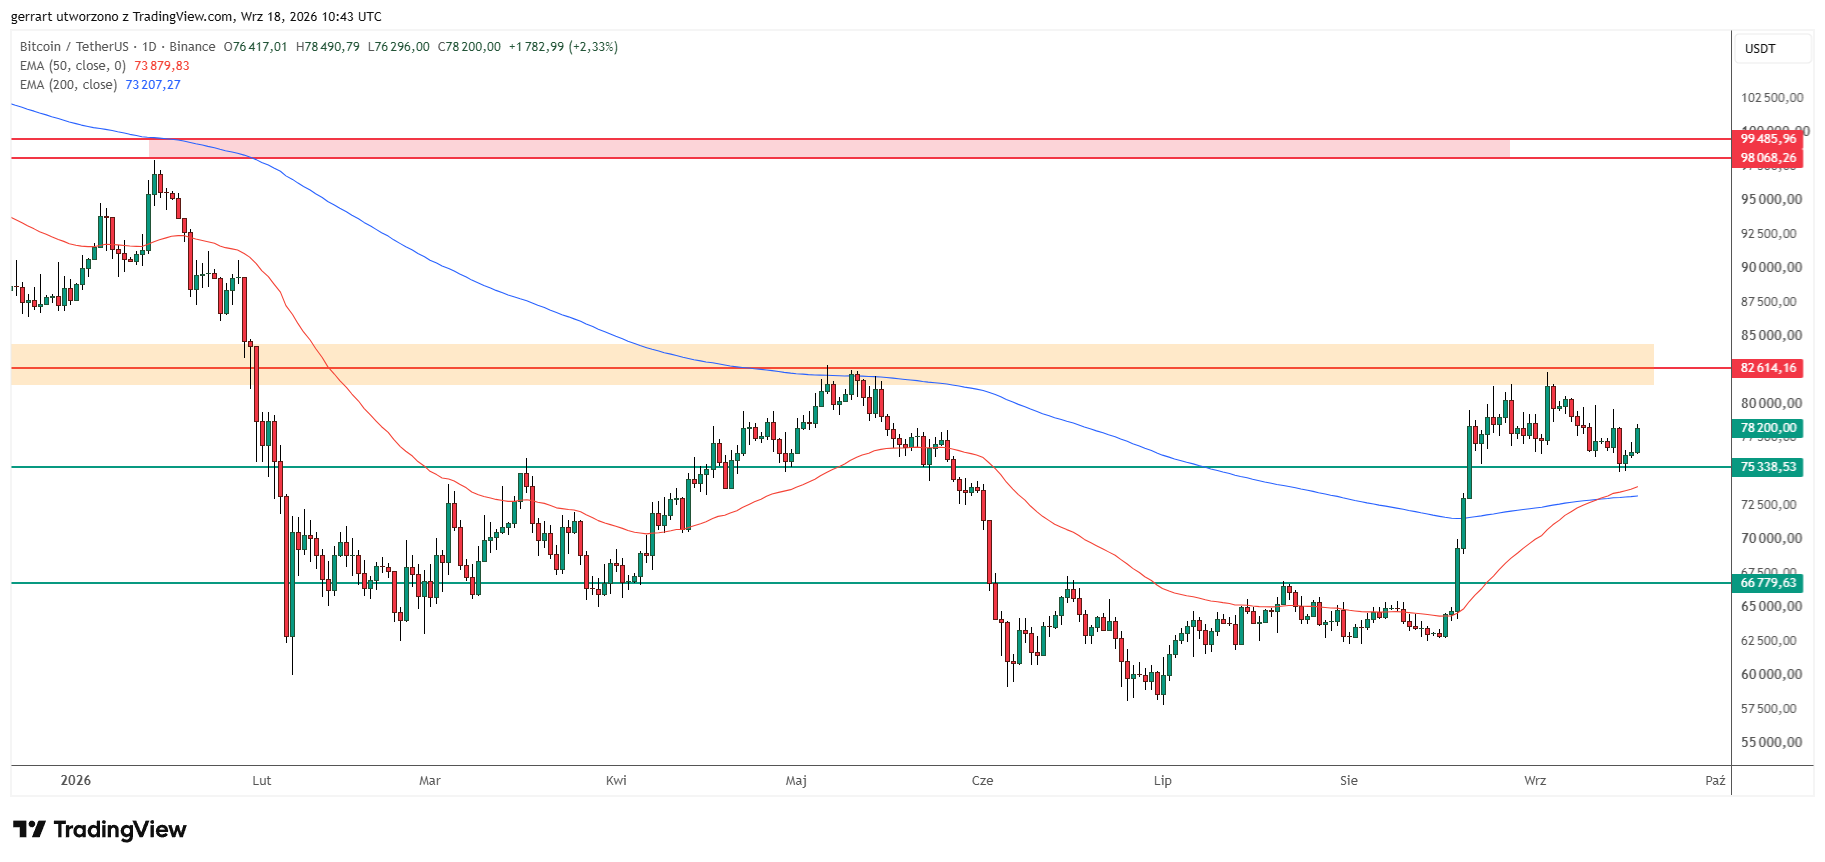
The cross printed on the September 12 daily close, based on my calculation from Binance BTC/USDT data. At the time of my chart, 08:07 UTC on Friday, the EMA 50 stood at $73,864.65 and the EMA 200 at $73,303.41, a gap of about $561.
Bitcoin's 50 EMA has moved above the 200 EMA while price holds inside a range. Source: TradingView
Why $82,600 Decides the Path to $100,000
The upper boundary of the consolidation sits at $82,614.16, inside a wider supply band that runs to about $84,400. Every rally since late August has stalled below it, with the highest print at $82,300 on September 3.
A daily close above that ceiling is my trigger. The next resistance is the January zone between $98,068 and $99,486, which puts the round $100,000 level back in play. Measured from today's price, the top of that zone is nearly 28% away, or roughly $21,700. From the breakout level itself, the distance is about 20%.
Gideon Hyams, chairman and co-founder of STS Digital, drew a similar map before the Fed decision. In his view, a Fed signaling "one-and-done" tightening would set up "a clean break of $80,000, targeting $100,000."
The Fed Hiked and $75,000 Still Held
On Wednesday, the Federal Open Market Committee (FOMC) voted 12-0 to lift the federal funds rate by 25 basis points to 3.75%-4%, its first hike since July 2023. Sixteen of 18 officials now see another increase this year, and the median projection for 2027 rose to 4.1%.
That was closer to the hawkish outcome Hyams had warned would put $75,000 to the test. Bitcoin dipped to $74,968 on Tuesday, after the CLARITY Act setback hit crypto prices, and to $75,065 on Wednesday. Neither session closed below the floor.
Jeff Anderson, head of US at STS Digital, said on Thursday that markets were "trading suspiciously well" after the double blow. He pointed to lower dollar yields and the Nasdaq returning to recent highs, but flagged the end of September as a seasonally difficult stretch for risk assets.
Before the meeting, Hyams argued that investors do not need to pick the right Fed scenario to be positioned for it.
"For investors, the practical takeaway is that you do not need to call the outcome to be positioned for it. QIS strategies provide different systematic strategies for different environments. If the dots keep Bitcoin rangebound, as it was over the summer, yield harvesting strategies monetise the range and the elevated implied vol, so clients get paid while spot goes sideways. If the Fed surprises dovish and the range breaks higher, participation strategies capture the upside with defined risk. The point of running these systematically is that clients do not have to guess which Fed shows up at 2:30."
My chart reads the same split. As long as price stays between $75,338 and $82,614, the range rewards patience. With the golden cross in place, I see better odds that the eventual break comes on the upside.
Scenario
Confirmation
Target
Invalidation
Bullish breakout
Daily close above $82,614
$98,068 to $99,486, then $100,000
Return below $82,614
Range continues
Closes between $75,338 and $82,614
Retests of both boundaries
Daily close outside the range
Pullback to EMAs
Daily close below $75,338
$73,300 to $73,900 (EMA 200 and EMA 50)
Rebound above $75,338
Bearish break
Daily close below the EMA 200
$66,780
Recovery above both EMAs
Why the EMAs Are My Safety Net Below $75,000
Even a break of the lower boundary at $75,338.53 would not end the bullish structure on my chart. Directly below it sit the EMA 50 at $73,865 and the EMA 200 at $73,303, both rising. That band, about 5% to 6% below spot, should absorb a deeper sell-off.
Paul Howard, senior director at Wincent, placed the next support in the same area before the Fed decision. He said hawkish language could send Bitcoin below $75,000 and toward $72,000-$73,000.
A daily close below the EMA 200 would push the trend reading on my chart back to neutral. A close under $66,780, the next horizontal support, would invalidate the bullish setup altogether.
Bitcoin (BTC) edged 1.8% higher to $77,813 on Binance today (Friday), two days after the Federal Reserve's first rate hike since 2023 failed to push the cryptocurrency through its $75,000 floor. The bounce comes with a technical shift Bitcoin has not shown since November 2025: the 50-day exponential moving average (EMA) now sits above the 200-day line.
The golden cross turns the trend on my daily chart officially bullish. Price still has to clear the $82,614 ceiling of the consolidation before my $100,000 target becomes active.
Golden Cross Confirmed After Two Weeks of Convergence
The cross printed on the September 12 daily close, based on my calculation from Binance BTC/USDT data. At the time of my chart, 08:07 UTC on Friday, the EMA 50 stood at $73,864.65 and the EMA 200 at $73,303.41, a gap of about $561.
Bitcoin's 50 EMA has moved above the 200 EMA while price holds inside a range. Source: TradingView
Why $82,600 Decides the Path to $100,000
The upper boundary of the consolidation sits at $82,614.16, inside a wider supply band that runs to about $84,400. Every rally since late August has stalled below it, with the highest print at $82,300 on September 3.
A daily close above that ceiling is my trigger. The next resistance is the January zone between $98,068 and $99,486, which puts the round $100,000 level back in play. Measured from today's price, the top of that zone is nearly 28% away, or roughly $21,700. From the breakout level itself, the distance is about 20%.
Gideon Hyams, chairman and co-founder of STS Digital, drew a similar map before the Fed decision. In his view, a Fed signaling "one-and-done" tightening would set up "a clean break of $80,000, targeting $100,000."
The Fed Hiked and $75,000 Still Held
On Wednesday, the Federal Open Market Committee (FOMC) voted 12-0 to lift the federal funds rate by 25 basis points to 3.75%-4%, its first hike since July 2023. Sixteen of 18 officials now see another increase this year, and the median projection for 2027 rose to 4.1%.
That was closer to the hawkish outcome Hyams had warned would put $75,000 to the test. Bitcoin dipped to $74,968 on Tuesday, after the CLARITY Act setback hit crypto prices, and to $75,065 on Wednesday. Neither session closed below the floor.
Jeff Anderson, head of US at STS Digital, said on Thursday that markets were "trading suspiciously well" after the double blow. He pointed to lower dollar yields and the Nasdaq returning to recent highs, but flagged the end of September as a seasonally difficult stretch for risk assets.
Before the meeting, Hyams argued that investors do not need to pick the right Fed scenario to be positioned for it.
"For investors, the practical takeaway is that you do not need to call the outcome to be positioned for it. QIS strategies provide different systematic strategies for different environments. If the dots keep Bitcoin rangebound, as it was over the summer, yield harvesting strategies monetise the range and the elevated implied vol, so clients get paid while spot goes sideways. If the Fed surprises dovish and the range breaks higher, participation strategies capture the upside with defined risk. The point of running these systematically is that clients do not have to guess which Fed shows up at 2:30."
My chart reads the same split. As long as price stays between $75,338 and $82,614, the range rewards patience. With the golden cross in place, I see better odds that the eventual break comes on the upside.
Scenario
Confirmation
Target
Invalidation
Bullish breakout
Daily close above $82,614
$98,068 to $99,486, then $100,000
Return below $82,614
Range continues
Closes between $75,338 and $82,614
Retests of both boundaries
Daily close outside the range
Pullback to EMAs
Daily close below $75,338
$73,300 to $73,900 (EMA 200 and EMA 50)
Rebound above $75,338
Bearish break
Daily close below the EMA 200
$66,780
Recovery above both EMAs
Why the EMAs Are My Safety Net Below $75,000
Even a break of the lower boundary at $75,338.53 would not end the bullish structure on my chart. Directly below it sit the EMA 50 at $73,865 and the EMA 200 at $73,303, both rising. That band, about 5% to 6% below spot, should absorb a deeper sell-off.
Paul Howard, senior director at Wincent, placed the next support in the same area before the Fed decision. He said hawkish language could send Bitcoin below $75,000 and toward $72,000-$73,000.
A daily close below the EMA 200 would push the trend reading on my chart back to neutral. A close under $66,780, the next horizontal support, would invalidate the bullish setup altogether.
Damian Chmiel is a Senior Analyst & Editor at Finance Magnates with more than 15 years of experience in the CFD and online trading industry. Active as both a trader and journalist since 2010, he focuses on broker coverage, fintech innovation, and regulatory developments across Europe, the Middle East, and Asia.
His work includes interviews with C-level leaders at major brokerages and fintech platforms, as well as co-authoring Finance Magnates’ quarterly industry benchmarking reports. Damian’s reporting is data-driven, market-aware, and grounded in direct industry engagement. His analysis and commentary have also been cited by external media outlets, including Investing.com, Binance, The Asset, Stockhead, and Dispatch.
Education:
MA in Finance and Accounting, Cracow University of Economics
Gold Price Stalls Below Trend Line for Fifth Day as XAU/USD Holds $4,400
Featured Videos
iFOREX Revises Earnings Forecast; AvaTrade to Close Polish Office
iFOREX Revises Earnings Forecast; AvaTrade to Close Polish Office
iFOREX Revises Earnings Forecast; AvaTrade to Close Polish Office
iFOREX Revises Earnings Forecast; AvaTrade to Close Polish Office
Today’s financial news recap covers iFOREX cuts its first-half earnings estimate, AvaTrade closes its Poland branch, Devexperts targets South Korean brokers, and TradingView adds MCP for AI tools.
Finance Magnates Daily Recap brings you the latest news from forex and CFD brokers, fintech, payments, cryptocurrency, digital assets, trading platforms, financial regulation and global markets.
Get the key company news, executive moves, deals, regulatory updates and market developments of the day, in just a few minutes. New episodes published every weekday.
Read more: https://www.financemagnates.com
#FinanceMagnates #ForexNews #FintechNews
Today’s financial news recap covers iFOREX cuts its first-half earnings estimate, AvaTrade closes its Poland branch, Devexperts targets South Korean brokers, and TradingView adds MCP for AI tools.
Finance Magnates Daily Recap brings you the latest news from forex and CFD brokers, fintech, payments, cryptocurrency, digital assets, trading platforms, financial regulation and global markets.
Get the key company news, executive moves, deals, regulatory updates and market developments of the day, in just a few minutes. New episodes published every weekday.
Read more: https://www.financemagnates.com
#FinanceMagnates #ForexNews #FintechNews
Today’s financial news recap covers iFOREX cuts its first-half earnings estimate, AvaTrade closes its Poland branch, Devexperts targets South Korean brokers, and TradingView adds MCP for AI tools.
Finance Magnates Daily Recap brings you the latest news from forex and CFD brokers, fintech, payments, cryptocurrency, digital assets, trading platforms, financial regulation and global markets.
Get the key company news, executive moves, deals, regulatory updates and market developments of the day, in just a few minutes. New episodes published every weekday.
Read more: https://www.financemagnates.com
#FinanceMagnates #ForexNews #FintechNews
Today’s financial news recap covers iFOREX cuts its first-half earnings estimate, AvaTrade closes its Poland branch, Devexperts targets South Korean brokers, and TradingView adds MCP for AI tools.
Finance Magnates Daily Recap brings you the latest news from forex and CFD brokers, fintech, payments, cryptocurrency, digital assets, trading platforms, financial regulation and global markets.
Get the key company news, executive moves, deals, regulatory updates and market developments of the day, in just a few minutes. New episodes published every weekday.
Read more: https://www.financemagnates.com
#FinanceMagnates #ForexNews #FintechNews
Can you memorise the textbook? That’s not necessarily the point.
Can you memorise the textbook? That’s not necessarily the point.
Can you memorise the textbook? That’s not necessarily the point.
Can you memorise the textbook? That’s not necessarily the point.
Can you memorise the textbook? That’s not necessarily the point.
Can you memorise the textbook? That’s not necessarily the point.
What matters is whether you can retain the information, understand it and actually apply it.
Take brokerage models. Knowing what a brokerage model is only gets you so far. What companies really need is an understanding of how to build one and how it can be applied.
That kind of practical understanding goes beyond simply reading a textbook.
#FinanceMagnates #FMAcademy #Fintech #FinanceCareers #ProfessionalDevelopment
What matters is whether you can retain the information, understand it and actually apply it.
Take brokerage models. Knowing what a brokerage model is only gets you so far. What companies really need is an understanding of how to build one and how it can be applied.
That kind of practical understanding goes beyond simply reading a textbook.
#FinanceMagnates #FMAcademy #Fintech #FinanceCareers #ProfessionalDevelopment
What matters is whether you can retain the information, understand it and actually apply it.
Take brokerage models. Knowing what a brokerage model is only gets you so far. What companies really need is an understanding of how to build one and how it can be applied.
That kind of practical understanding goes beyond simply reading a textbook.
#FinanceMagnates #FMAcademy #Fintech #FinanceCareers #ProfessionalDevelopment
What matters is whether you can retain the information, understand it and actually apply it.
Take brokerage models. Knowing what a brokerage model is only gets you so far. What companies really need is an understanding of how to build one and how it can be applied.
That kind of practical understanding goes beyond simply reading a textbook.
#FinanceMagnates #FMAcademy #Fintech #FinanceCareers #ProfessionalDevelopment
What matters is whether you can retain the information, understand it and actually apply it.
Take brokerage models. Knowing what a brokerage model is only gets you so far. What companies really need is an understanding of how to build one and how it can be applied.
That kind of practical understanding goes beyond simply reading a textbook.
#FinanceMagnates #FMAcademy #Fintech #FinanceCareers #ProfessionalDevelopment
What matters is whether you can retain the information, understand it and actually apply it.
Take brokerage models. Knowing what a brokerage model is only gets you so far. What companies really need is an understanding of how to build one and how it can be applied.
That kind of practical understanding goes beyond simply reading a textbook.
#FinanceMagnates #FMAcademy #Fintech #FinanceCareers #ProfessionalDevelopment
US Senate Blocks CLARITY Act; IBKR Links X to Trading
US Senate Blocks CLARITY Act; IBKR Links X to Trading
US Senate Blocks CLARITY Act; IBKR Links X to Trading
US Senate Blocks CLARITY Act; IBKR Links X to Trading
US Senate Blocks CLARITY Act; IBKR Links X to Trading
US Senate Blocks CLARITY Act; IBKR Links X to Trading
Today’s financial news recap covers the US Senate blocks the CLARITY Act, Interactive Brokers links X Cashtags to trading, and Match-Trade offers seven-day prop firm launch with Match-Prop.
Finance Magnates Daily Recap brings you the latest news from forex and CFD brokers, fintech, payments, cryptocurrency, digital assets, trading platforms, financial regulation and global markets.
Get the key company news, executive moves, deals, regulatory updates and market developments of the day, in just a few minutes. New episodes published every weekday.
Read more: https://www.financemagnates.com
#FinanceMagnates #ForexNews #FintechNews
Today’s financial news recap covers the US Senate blocks the CLARITY Act, Interactive Brokers links X Cashtags to trading, and Match-Trade offers seven-day prop firm launch with Match-Prop.
Finance Magnates Daily Recap brings you the latest news from forex and CFD brokers, fintech, payments, cryptocurrency, digital assets, trading platforms, financial regulation and global markets.
Get the key company news, executive moves, deals, regulatory updates and market developments of the day, in just a few minutes. New episodes published every weekday.
Read more: https://www.financemagnates.com
#FinanceMagnates #ForexNews #FintechNews
Today’s financial news recap covers the US Senate blocks the CLARITY Act, Interactive Brokers links X Cashtags to trading, and Match-Trade offers seven-day prop firm launch with Match-Prop.
Finance Magnates Daily Recap brings you the latest news from forex and CFD brokers, fintech, payments, cryptocurrency, digital assets, trading platforms, financial regulation and global markets.
Get the key company news, executive moves, deals, regulatory updates and market developments of the day, in just a few minutes. New episodes published every weekday.
Read more: https://www.financemagnates.com
#FinanceMagnates #ForexNews #FintechNews
Today’s financial news recap covers the US Senate blocks the CLARITY Act, Interactive Brokers links X Cashtags to trading, and Match-Trade offers seven-day prop firm launch with Match-Prop.
Finance Magnates Daily Recap brings you the latest news from forex and CFD brokers, fintech, payments, cryptocurrency, digital assets, trading platforms, financial regulation and global markets.
Get the key company news, executive moves, deals, regulatory updates and market developments of the day, in just a few minutes. New episodes published every weekday.
Read more: https://www.financemagnates.com
#FinanceMagnates #ForexNews #FintechNews
Today’s financial news recap covers the US Senate blocks the CLARITY Act, Interactive Brokers links X Cashtags to trading, and Match-Trade offers seven-day prop firm launch with Match-Prop.
Finance Magnates Daily Recap brings you the latest news from forex and CFD brokers, fintech, payments, cryptocurrency, digital assets, trading platforms, financial regulation and global markets.
Get the key company news, executive moves, deals, regulatory updates and market developments of the day, in just a few minutes. New episodes published every weekday.
Read more: https://www.financemagnates.com
#FinanceMagnates #ForexNews #FintechNews
Today’s financial news recap covers the US Senate blocks the CLARITY Act, Interactive Brokers links X Cashtags to trading, and Match-Trade offers seven-day prop firm launch with Match-Prop.
Finance Magnates Daily Recap brings you the latest news from forex and CFD brokers, fintech, payments, cryptocurrency, digital assets, trading platforms, financial regulation and global markets.
Get the key company news, executive moves, deals, regulatory updates and market developments of the day, in just a few minutes. New episodes published every weekday.
Read more: https://www.financemagnates.com
#FinanceMagnates #ForexNews #FintechNews
Revolut KYC Incident; CoinEx Shuts Down
Revolut KYC Incident; CoinEx Shuts Down
Revolut KYC Incident; CoinEx Shuts Down
Revolut KYC Incident; CoinEx Shuts Down
Revolut KYC Incident; CoinEx Shuts Down
Revolut KYC Incident; CoinEx Shuts Down
Today’s financial news recap covers the Revolut KYC data incident, CoinEx’s shutdown, and Anthropic’s push into financial services.
Finance Magnates Daily Recap brings you the latest news from forex and CFD brokers, fintech, payments, cryptocurrency, digital assets, trading platforms, financial regulation and global markets.
Get the key company news, executive moves, deals, regulatory updates and market developments of the day, in just a few minutes. New episodes published every weekday.
Read more: https://www.financemagnates.com
#FinanceMagnates #ForexNews #FintechNews
Today’s financial news recap covers the Revolut KYC data incident, CoinEx’s shutdown, and Anthropic’s push into financial services.
Finance Magnates Daily Recap brings you the latest news from forex and CFD brokers, fintech, payments, cryptocurrency, digital assets, trading platforms, financial regulation and global markets.
Get the key company news, executive moves, deals, regulatory updates and market developments of the day, in just a few minutes. New episodes published every weekday.
Read more: https://www.financemagnates.com
#FinanceMagnates #ForexNews #FintechNews
Today’s financial news recap covers the Revolut KYC data incident, CoinEx’s shutdown, and Anthropic’s push into financial services.
Finance Magnates Daily Recap brings you the latest news from forex and CFD brokers, fintech, payments, cryptocurrency, digital assets, trading platforms, financial regulation and global markets.
Get the key company news, executive moves, deals, regulatory updates and market developments of the day, in just a few minutes. New episodes published every weekday.
Read more: https://www.financemagnates.com
#FinanceMagnates #ForexNews #FintechNews
Today’s financial news recap covers the Revolut KYC data incident, CoinEx’s shutdown, and Anthropic’s push into financial services.
Finance Magnates Daily Recap brings you the latest news from forex and CFD brokers, fintech, payments, cryptocurrency, digital assets, trading platforms, financial regulation and global markets.
Get the key company news, executive moves, deals, regulatory updates and market developments of the day, in just a few minutes. New episodes published every weekday.
Read more: https://www.financemagnates.com
#FinanceMagnates #ForexNews #FintechNews
Today’s financial news recap covers the Revolut KYC data incident, CoinEx’s shutdown, and Anthropic’s push into financial services.
Finance Magnates Daily Recap brings you the latest news from forex and CFD brokers, fintech, payments, cryptocurrency, digital assets, trading platforms, financial regulation and global markets.
Get the key company news, executive moves, deals, regulatory updates and market developments of the day, in just a few minutes. New episodes published every weekday.
Read more: https://www.financemagnates.com
#FinanceMagnates #ForexNews #FintechNews
Today’s financial news recap covers the Revolut KYC data incident, CoinEx’s shutdown, and Anthropic’s push into financial services.
Finance Magnates Daily Recap brings you the latest news from forex and CFD brokers, fintech, payments, cryptocurrency, digital assets, trading platforms, financial regulation and global markets.
Get the key company news, executive moves, deals, regulatory updates and market developments of the day, in just a few minutes. New episodes published every weekday.
Read more: https://www.financemagnates.com
#FinanceMagnates #ForexNews #FintechNews
Is FM Academy just for individuals looking to upskill?
Is FM Academy just for individuals looking to upskill?
Is FM Academy just for individuals looking to upskill?
Is FM Academy just for individuals looking to upskill?
Is FM Academy just for individuals looking to upskill?
Is FM Academy just for individuals looking to upskill?
Not at all.
Individual professionals can use FM Academy to build their knowledge and skills, while companies can use corporate bundles to train entire teams and bring new hires up to speed.
For individuals, that means flexible learning. For companies, it means a more structured way to train multiple employees without coordinating separate training for everyone.
#FinanceMagnates #FMAcademy #Fintech #ProfessionalDevelopment #CorporateTraining
Not at all.
Individual professionals can use FM Academy to build their knowledge and skills, while companies can use corporate bundles to train entire teams and bring new hires up to speed.
For individuals, that means flexible learning. For companies, it means a more structured way to train multiple employees without coordinating separate training for everyone.
#FinanceMagnates #FMAcademy #Fintech #ProfessionalDevelopment #CorporateTraining
Not at all.
Individual professionals can use FM Academy to build their knowledge and skills, while companies can use corporate bundles to train entire teams and bring new hires up to speed.
For individuals, that means flexible learning. For companies, it means a more structured way to train multiple employees without coordinating separate training for everyone.
#FinanceMagnates #FMAcademy #Fintech #ProfessionalDevelopment #CorporateTraining
Not at all.
Individual professionals can use FM Academy to build their knowledge and skills, while companies can use corporate bundles to train entire teams and bring new hires up to speed.
For individuals, that means flexible learning. For companies, it means a more structured way to train multiple employees without coordinating separate training for everyone.
#FinanceMagnates #FMAcademy #Fintech #ProfessionalDevelopment #CorporateTraining
Not at all.
Individual professionals can use FM Academy to build their knowledge and skills, while companies can use corporate bundles to train entire teams and bring new hires up to speed.
For individuals, that means flexible learning. For companies, it means a more structured way to train multiple employees without coordinating separate training for everyone.
#FinanceMagnates #FMAcademy #Fintech #ProfessionalDevelopment #CorporateTraining
Not at all.
Individual professionals can use FM Academy to build their knowledge and skills, while companies can use corporate bundles to train entire teams and bring new hires up to speed.
For individuals, that means flexible learning. For companies, it means a more structured way to train multiple employees without coordinating separate training for everyone.
#FinanceMagnates #FMAcademy #Fintech #ProfessionalDevelopment #CorporateTraining