
XRP Price Prediction: Clarity Act Selloff Leaves Bull Flag Intact, Target Near $2

Thursday, 17/09/2026 | 09:30 GMT by Damian Chmiel
  • XRP fell nearly 10% after the Senate blocked the market structure bill, but the drop stopped inside the flag drawn after August's rally.
  • The measured move points to $1.97, though $1.46 and $1.56 stand in the way and the Fed now projects one more hike this year.
Ripple XRP
Thomas Trutschel/Photothek via Getty Images

XRP traded near $1.30 early today (Thursday), holding on after one of its sharpest daily declines in months. The token fell nearly 10%, the worst performance among major cryptocurrencies, after the US Senate failed on Tuesday to advance the CLARITY Act.

The selloff hurt, but it did not break the structure on my daily chart. XRP is still trading inside the bull flag that formed after August's rally, and the measured move of that pattern points to $1.97, about 52% above the current price.

The Clarity Act Vote Hit XRP Harder Than Bitcoin

Senators voted 49 to 50 on the procedural motion to open debate on the market structure bill, well short of the 60 votes needed. For XRP, whose legal status was settled in court rather than by statute, the bill mattered more than for most large tokens.

Nexo analyst Iliya Kalchev noted in the firm's daily dispatch that XRP fell considerably further than the broader market, while tokens most exposed to US regulatory treatment underperformed Bitcoin.

"The vote is not a setback of the technology or direction of travel but more how ethical provisions and banking incumbents are concerned on protecting their market," Paul Howard, Senior Director at Wincent, said in commentary shared with FinanceMagnates.com. He added that prediction market odds had given the bill only a 20% chance of passing.

From a $0.43 Bear Case to a Bull Flag

The setup looks very different from a month ago. In my August 11 XRP analysis, the token had just broken its 2026 low at $1.0055 and I pointed to downside risk toward $0.43, with a sustained move above the 200-day EMA as the level that would cancel that scenario.

That is what happened. XRP bottomed at $0.9877 on August 17 and rallied to $1.6963 by August 22, its highest level since January, as expanded Treasury buybacks lifted risk appetite. That vertical move is the pole of the flag.

What My XRP Chart Shows Now

Since the August 22 peak, XRP has drifted lower in a narrow, downward-sloping channel. That orderly pullback after a steep advance is the flag itself.

Tuesday's drop pushed price to the lower edge of that channel, but not out of it. XRP now sits just above the 50-day exponential moving average at $1.284 and just below the 200-day EMA at $1.353. The moving averages are starting to help, with the 50-day line turning higher after the August rally.
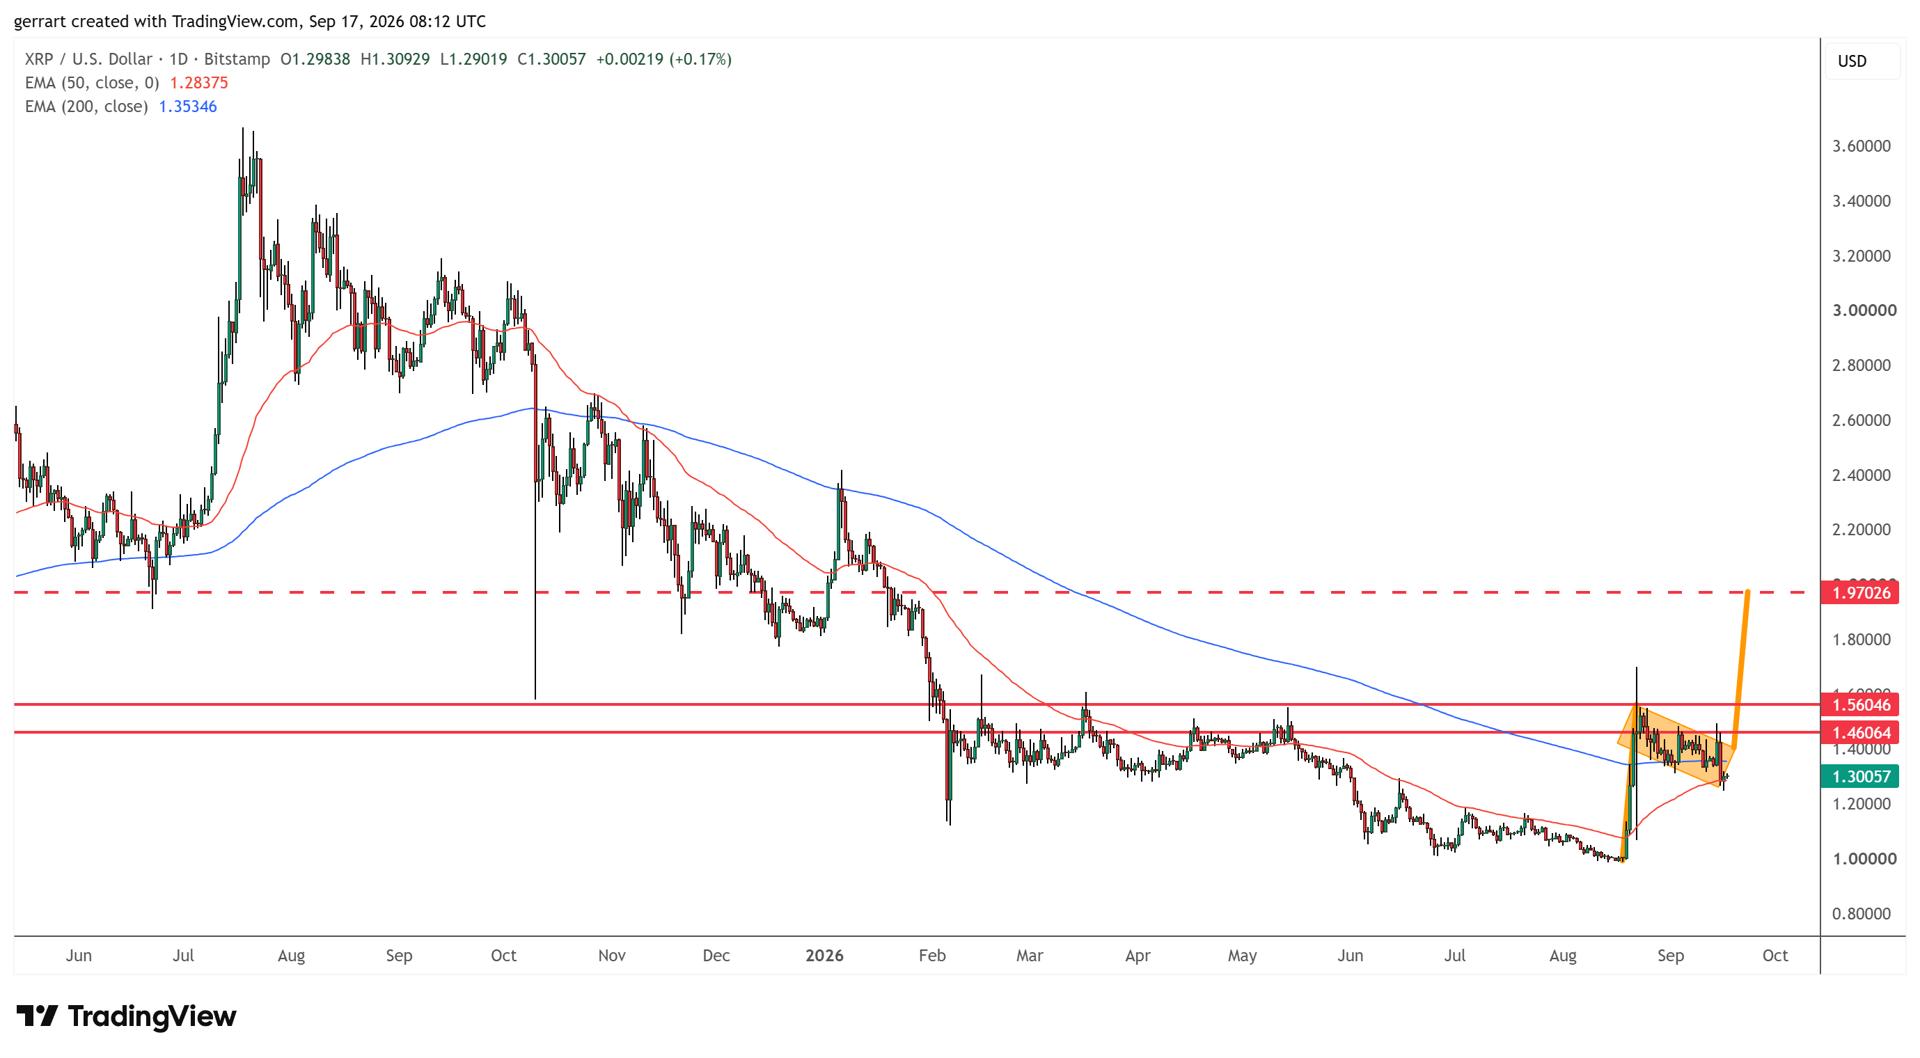
XRP holds inside its bull flag after the Clarity Act selloff. Source: TradingView

Why $1.46 and $1.56 Matter Before $2

The flag target is not the next stop. On the way up, XRP has to clear $1.46 and then $1.56, the levels that capped price during the first part of the year. Only a break above them would take the pressure off XRP's back.

Until price is above $1.56, and ideally $1.60, my base case remains consolidation close to the lowest levels XRP has traded at since 2024. The first resistance is about 12% above the current price, the second about 20%.

ScenarioConfirmationTargetInvalidation
Flag breakoutDaily close above $1.46, then above $1.56 to $1.60$1.97, about 52% above $1.30Return below the flag's lower edge
ConsolidationPrice stays between $1.28 and $1.56Range tradingDaily close above $1.60 or below $1.28
Flag failureDaily close below the 50-day EMA near $1.28Summer lows at $1.00 to $1.05Recovery back into the flag

The Fed Adds a Macro Test

The macro backdrop is not helping. The Federal Reserve raised its benchmark rate by 25 basis points to a range of 3.75% to 4% yesterday (Wednesday), its first hike since 2023, and the median official now projects one more increase this year.

Gideon Hyams, Chairman and Co-Founder at STS Digital, said before the decision that a macro repricing is the most plausible trigger for a break in Bitcoin's range, with real yields and the dollar as the main channels.

Adam Haeems, Head of Asset Management at Tesseract Group, set out his own test for a genuine breakout in Bitcoin: "spot ETF flows turning positive, open interest rising in bitcoin terms rather than dollar terms, and the real yield stalling. Two of those three are absent today."

What Would Invalidate the Flag

The bullish reading holds only while XRP stays inside the channel. A daily close below the 50-day EMA near $1.28, which also runs along the flag's lower boundary, would turn the pattern into a failed flag.

In that case, the next support on my chart is the summer lows between $1.00 and $1.05, just above the August base at $0.99 from which the flag pole started.

XRP traded near $1.30 early today (Thursday), holding on after one of its sharpest daily declines in months. The token fell nearly 10%, the worst performance among major cryptocurrencies, after the US Senate failed on Tuesday to advance the CLARITY Act.

The selloff hurt, but it did not break the structure on my daily chart. XRP is still trading inside the bull flag that formed after August's rally, and the measured move of that pattern points to $1.97, about 52% above the current price.

The Clarity Act Vote Hit XRP Harder Than Bitcoin

Senators voted 49 to 50 on the procedural motion to open debate on the market structure bill, well short of the 60 votes needed. For XRP, whose legal status was settled in court rather than by statute, the bill mattered more than for most large tokens.

Nexo analyst Iliya Kalchev noted in the firm's daily dispatch that XRP fell considerably further than the broader market, while tokens most exposed to US regulatory treatment underperformed Bitcoin.

"The vote is not a setback of the technology or direction of travel but more how ethical provisions and banking incumbents are concerned on protecting their market," Paul Howard, Senior Director at Wincent, said in commentary shared with FinanceMagnates.com. He added that prediction market odds had given the bill only a 20% chance of passing.

From a $0.43 Bear Case to a Bull Flag

The setup looks very different from a month ago. In my August 11 XRP analysis, the token had just broken its 2026 low at $1.0055 and I pointed to downside risk toward $0.43, with a sustained move above the 200-day EMA as the level that would cancel that scenario.

That is what happened. XRP bottomed at $0.9877 on August 17 and rallied to $1.6963 by August 22, its highest level since January, as expanded Treasury buybacks lifted risk appetite. That vertical move is the pole of the flag.

What My XRP Chart Shows Now

Since the August 22 peak, XRP has drifted lower in a narrow, downward-sloping channel. That orderly pullback after a steep advance is the flag itself.

Tuesday's drop pushed price to the lower edge of that channel, but not out of it. XRP now sits just above the 50-day exponential moving average at $1.284 and just below the 200-day EMA at $1.353. The moving averages are starting to help, with the 50-day line turning higher after the August rally.

XRP holds inside its bull flag after the Clarity Act selloff. Source: TradingView

Why $1.46 and $1.56 Matter Before $2

The flag target is not the next stop. On the way up, XRP has to clear $1.46 and then $1.56, the levels that capped price during the first part of the year. Only a break above them would take the pressure off XRP's back.

Until price is above $1.56, and ideally $1.60, my base case remains consolidation close to the lowest levels XRP has traded at since 2024. The first resistance is about 12% above the current price, the second about 20%.

ScenarioConfirmationTargetInvalidation
Flag breakoutDaily close above $1.46, then above $1.56 to $1.60$1.97, about 52% above $1.30Return below the flag's lower edge
ConsolidationPrice stays between $1.28 and $1.56Range tradingDaily close above $1.60 or below $1.28
Flag failureDaily close below the 50-day EMA near $1.28Summer lows at $1.00 to $1.05Recovery back into the flag

The Fed Adds a Macro Test

The macro backdrop is not helping. The Federal Reserve raised its benchmark rate by 25 basis points to a range of 3.75% to 4% yesterday (Wednesday), its first hike since 2023, and the median official now projects one more increase this year.

Gideon Hyams, Chairman and Co-Founder at STS Digital, said before the decision that a macro repricing is the most plausible trigger for a break in Bitcoin's range, with real yields and the dollar as the main channels.

Adam Haeems, Head of Asset Management at Tesseract Group, set out his own test for a genuine breakout in Bitcoin: "spot ETF flows turning positive, open interest rising in bitcoin terms rather than dollar terms, and the real yield stalling. Two of those three are absent today."

What Would Invalidate the Flag

The bullish reading holds only while XRP stays inside the channel. A daily close below the 50-day EMA near $1.28, which also runs along the flag's lower boundary, would turn the pattern into a failed flag.

In that case, the next support on my chart is the summer lows between $1.00 and $1.05, just above the August base at $0.99 from which the flag pole started.

About the Author: Damian Chmiel
Damian Chmiel
  • 3964 Articles
  • 117 Followers
About the Author: Damian Chmiel
Damian Chmiel is a Senior Analyst & Editor at Finance Magnates with more than 15 years of experience in the CFD and online trading industry. Active as both a trader and journalist since 2010, he focuses on broker coverage, fintech innovation, and regulatory developments across Europe, the Middle East, and Asia. His work includes interviews with C-level leaders at major brokerages and fintech platforms, as well as co-authoring Finance Magnates’ quarterly industry benchmarking reports. Damian’s reporting is data-driven, market-aware, and grounded in direct industry engagement. His analysis and commentary have also been cited by external media outlets, including Investing.com, Binance, The Asset, Stockhead, and Dispatch. Education: MA in Finance and Accounting, Cracow University of Economics
  • 3964 Articles
  • 117 Followers

More from the Author

Trending

!"#$%&'()*+,-./0123456789:;<=>?@ABCDEFGHIJKLMNOPQRSTUVWXYZ[\]^_`abcdefghijklmnopqrstuvwxyz{|} !"#$%&'()*+,-./0123456789:;<=>?@ABCDEFGHIJKLMNOPQRSTUVWXYZ[\]^_`abcdefghijklmnopqrstuvwxyz{|}