Bitcoin trades near $61,200 and Ethereum near $1,650 on July 2, 2026, both bouncing off multi-month lows after a heavy June crypto selloff.
My weekly charts keep Bitcoin pointed at $44,100 and Ethereum toward the $1,000 zone, both below Citi's freshly cut base-case forecasts.
Citi cut its Bitcoin target to $82,000 and Ethereum to $2,240, slashing expected ETF inflows to zero as June redemptions set a record.
Bitcoin traded near $61,200 and Ethereum near $1,650
on Thursday, July 2, 2026, both recovering from multi-month lows one day after
Citigroup cut its 12-month targets on the two largest cryptocurrencies. Bitcoin
gained 2.17% on the session and Ethereum 2.42%, a relief bounce off this week's
floor near the lowest levels since late 2024.
Citi
lowered its Bitcoin target to $82,000 from $112,000 and Ethereum to $2,240 from
$3,175, citing record ETF outflows and stalled US crypto legislation.
My Bitcoin
and Ethereum price prediction stays bearish: the bounce is a retest from below,
not a reversal.
Follow
me on X for real-time Bitcoin and Ethereum analysis: @ChmielDk
Why Are Bitcoin and
Ethereum Falling? Citi Cuts Both Targets
Citigroup's
downgrade landed on July 1, with the bank slashing its 12-month net ETF inflow
assumption to zero from $10 billion. Bitcoin (BTC) ETF flows have turned negative, down about
$3.3 billion so far in 2026, and Citi expects broader adoption to stall until a
new catalyst arrives.
Paul
Howard, Senior Director at Wincent, called June's roughly $4 billion in US spot
Bitcoin ETF outflows "part of a wider portfolio reallocation rather than a
structural loss of confidence."
Howard
argued that investors rotated into higher-conviction bets, particularly
high-profile IPOs and equities offering more immediate upside. Elevated rates
and geopolitical uncertainty pushed institutions to trim exposure to
higher-volatility assets, he added.
The
selloff has a clear structure:
Citi's cut: 12-month Bitcoin target down
to $82,000 from $112,000, Ethereum to $2,240 from $3,175
ETF inflow assumption: reduced to zero from $10
billion, with 2026 flows already down $3.3 billion
Record redemptions: US spot Bitcoin ETFs shed
roughly $4 billion in June, the largest monthly outflow on record
Capital rotation: allocators moved into the
SpaceX IPO and AI equities, draining crypto liquidity
Stalled legislation: no progress on US digital
asset market structure to anchor institutional allocations
Bitcoin Technical
Analysis: The $60,000 Trendline Holds, for Now
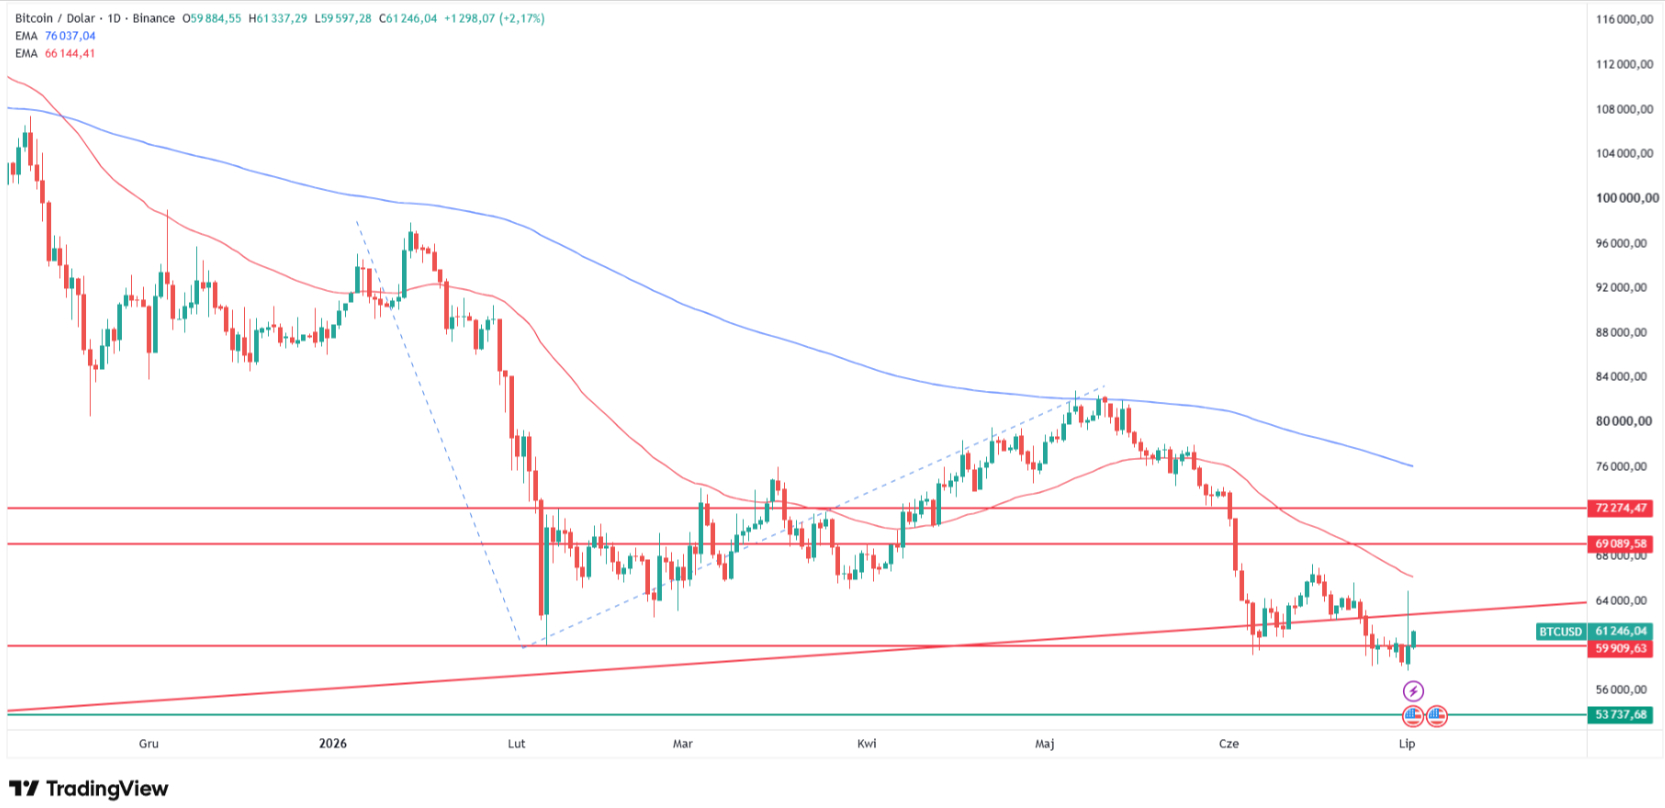
My chart
shows Bitcoin bouncing 2.17% off the $59,900 shelf, defending both this week's
low and the ascending trendline that has framed price since the February
bottom.
Wednesday's
long candle rejected the move under $60,000 and closed back near $61,200, a
bullish wick on the daily. That candle and the trendline confirm my Tuesday
analysis rather than contradict it. The $60,000 zone is broken weekly support,
and price is now retesting it from below.
Two
exponential moving averages cap the tape. The 50 EMA sits at $66,144 and the
200 EMA at $76,037, both above spot and both sloping down, the bearish stack
that has defined Bitcoin since February.
In 15 years
reading daily charts, 10 of them at FinanceMagnates.com (my analyst page), a bounce into a falling 50 EMA is a sell
candidate until price reclaims it.
As my Tuesday analysis detailed, last week's weekly close
below $60,000 flipped former support into resistance under the polarity
principle and broke the ascending trendline drawn from December 2022 lows.
My primary
target stays at $44,100, the 100% Fibonacci extension of January's decline and
a 25% drop from spot, a level I first mapped in my earlier $45,000 forecast. The first shelf below sits at
$53,700, the summer 2024 low.
Can Bitcoin hold the $60,000 trendline or does the break target $44,100? Source: Tradingview.com
A weekly reclaim of $60,000 and the 200 EMA near
$76,000 is what invalidates the bear case.
Level
Type
Notes
$76,037
200 EMA / Resistance
Trend
divider, bull reclaim line
$66,144
50 EMA / Resistance
Caps
every bounce since February
$59,900-$60,000
Support / Trigger
Ascending
trendline, broken weekly floor
$53,700
Support
Summer
2024 low, first shelf below
$44,100
Target
100% Fibonacci extension, 25% below spot
Ethereum Technical
Analysis: Consolidating Below the $1,800 Shelf
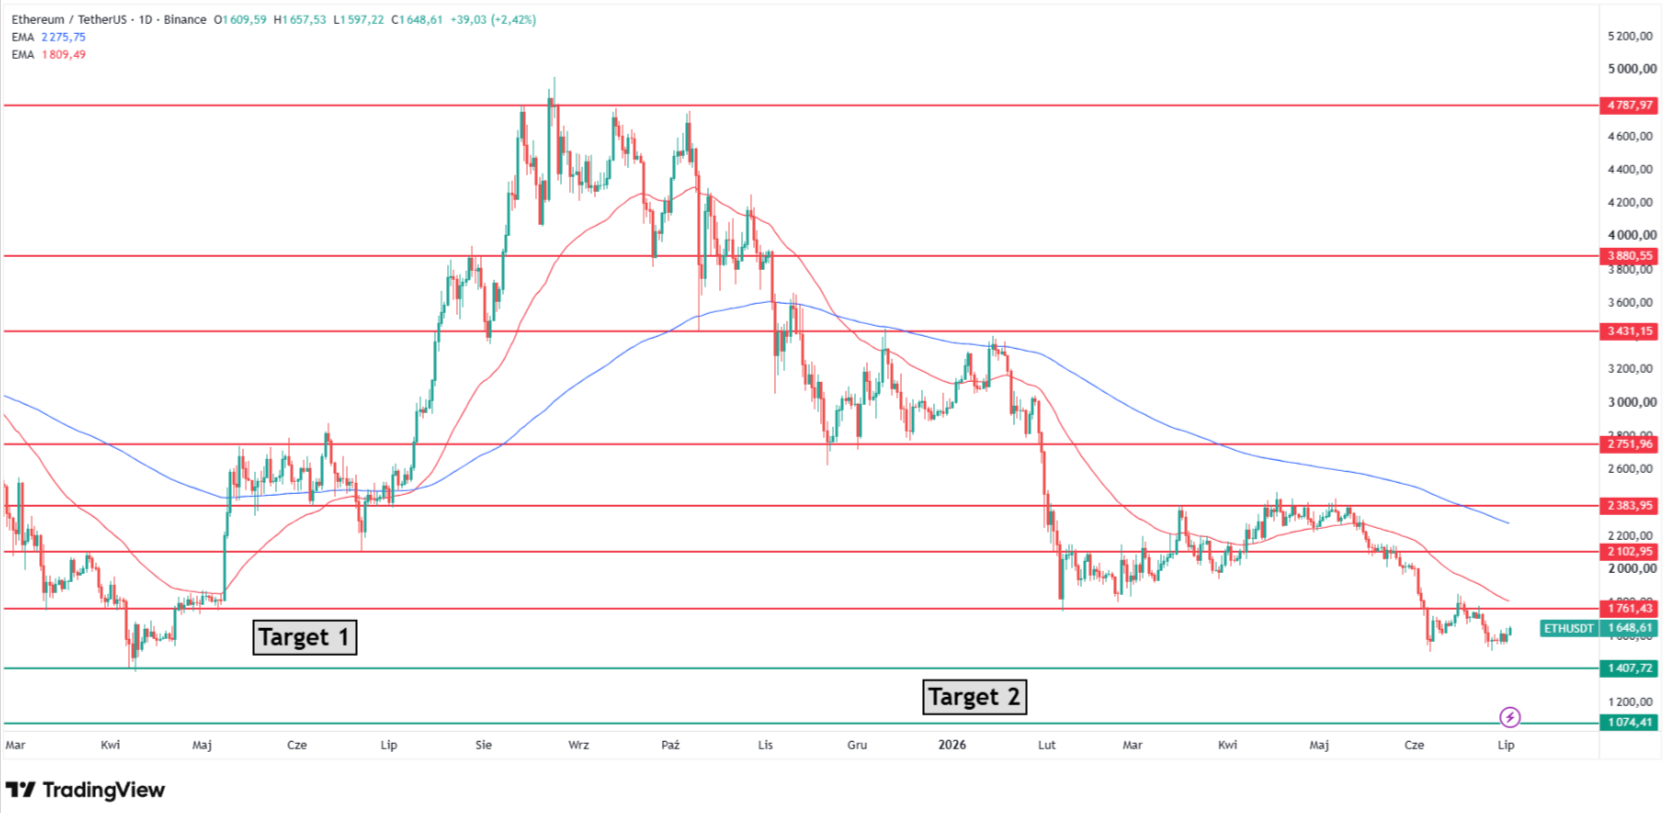
Ethereum (ETH) added 2.42% to $1,648 on Thursday, but my
chart shows price consolidating below the 2026 lows near $1,800, the shelf
marked by the $1,761 level. The rebound has not changed the structure. Local
support sits at $1,550, the floor set by the early June lows, and a daily close
below it opens the path lower.
The moving
average grid is stacked against ETH. The 50 EMA runs at $1,809 and the 200 EMA
at $2,275, both well above spot and both pointed down. Spot trades nearly 38%
under the 200 EMA, a gap that measures how far the Ethereum downtrend has
stretched.
Ethereum
sits roughly 66% below its August 2025 record, and until it reclaims the $1,809
average, every rally is a lower high in my framework.
My two
bearish targets still wait for a print. The first is $1,407, the April 2025 low
I marked as Target 1. The second is the round $1,000 handle near the $1,074
November 2022 low, Target 2 on my chart.
As my February Ethereum analysis mapped, the $1,760, $1,400, and
$1,000 levels form the descending target stack, and my November forecast flagged the same $1,400 April zone
as the medium-term destination.
Maxime
Seiler, CEO and Co-Founder at STS Digital, reads the weakness as flow-driven.
He called June's drop "less macro and more a simple lack of fresh
capital," pointing to the SpaceX IPO pulling allocation out of crypto
entirely.
How low can Ethereum go below the $1,800 shelf? Source: Tradingview.com
Seiler sees
institutions still deploying, only slower, with the AI narrative and the SpaceX
listing offering cleaner return asymmetry than a range-bound market.
How Low Can Bitcoin and
Ethereum Go? Price Predictions
Its $53,000
bear case sits just above my $44,100 target, so on the downside my chart is
more aggressive than Citi's. For Ethereum, Citi's $2,240 base case would need
ETH to clear the $1,809 and $2,275 EMAs, a move the chart shows no sign of,
while its $1,094 bear case aligns almost exactly with my $1,000 Target 2.
The bull
case leans on institutions stepping in lower. Paul Howard expects the $50,000
region to attract renewed institutional interest, a level that sits between my
$53,700 shelf and my $44,100 target.
Maxime
Seiler sees the four-year cycle intact and argues capital returns once
regulatory clarity and price momentum realign. Standard Chartered's prior
$7,500 Ethereum target and Bernstein's $150,000 Bitcoin call remain the far
bull markers, both requiring a macro turn neither chart confirms.
Source
Target
My View
Citi (base, BTC)
$82,000
Needs a
weekly $60,000 reclaim first, not yet in play
Citi (bear, BTC)
$53,000
Just
above my $44,100 target, my chart is lower
Citi (base, ETH)
$2,240
Blocked
by the $1,809 and $2,275 EMAs
Citi (bear, ETH)
$1,094
Aligns with my $1,000 Target 2
Standard Chartered (ETH)
$7,500
Far bull
case, needs a macro turn
Bernstein (BTC)
$150,000
Requires
a 200 EMA reclaim near $76,000
FAQ, Bitcoin and Ethereum
Price Prediction
Why did Citi cut its
Bitcoin and Ethereum price targets?
Citi
lowered its 12-month Bitcoin target to $82,000 from $112,000 and Ethereum to
$2,240 from $3,175 on July 1, 2026. The bank cut its expected net ETF inflows
to zero from $10 billion, citing negative flows, weak investor appetite, and
stalled US crypto legislation. Its bear case values Bitcoin at $53,000 and
Ethereum at $1,094.
How low can Bitcoin go in
2026?
My chart
targets $44,100, the 100% Fibonacci extension of January's decline and a 25%
drop from the $61,200 spot price. The first support shelf sits at $53,700, the
summer 2024 low. A weekly close reclaiming $60,000 and the 200 EMA near $76,000
would invalidate that bearish path and shift focus higher.
How low can Ethereum go?
My two
bearish targets are $1,407, the April 2025 low, and the round $1,000 handle
near the $1,074 November 2022 low. Ethereum trades below its 50 EMA at $1,809
and its 200 EMA at $2,275, with local support at $1,550. A daily close below
$1,550 opens the path toward those targets.
Are the Bitcoin ETF
outflows a structural problem?
Paul Howard
of Wincent views June's roughly $4 billion in outflows as portfolio
reallocation, not lost conviction, with capital rotating into IPOs and
equities. Maxime Seiler of STS Digital ties the drop to a lack of fresh capital
after the SpaceX IPO. Both expect flows to return once regulation and momentum
realign.
What would reverse the
crypto selloff?
A reversal
needs three things: ETF outflows turning to sustained inflows, progress on US
crypto market structure legislation, and a friendlier macro backdrop. On my
charts, Bitcoin must reclaim $60,000 and the 200 EMA near $76,000, and Ethereum
must clear its $1,809 50 EMA, before the bearish structure flips.
Bitcoin traded near $61,200 and Ethereum near $1,650
on Thursday, July 2, 2026, both recovering from multi-month lows one day after
Citigroup cut its 12-month targets on the two largest cryptocurrencies. Bitcoin
gained 2.17% on the session and Ethereum 2.42%, a relief bounce off this week's
floor near the lowest levels since late 2024.
Citi
lowered its Bitcoin target to $82,000 from $112,000 and Ethereum to $2,240 from
$3,175, citing record ETF outflows and stalled US crypto legislation.
My Bitcoin
and Ethereum price prediction stays bearish: the bounce is a retest from below,
not a reversal.
Follow
me on X for real-time Bitcoin and Ethereum analysis: @ChmielDk
Why Are Bitcoin and
Ethereum Falling? Citi Cuts Both Targets
Citigroup's
downgrade landed on July 1, with the bank slashing its 12-month net ETF inflow
assumption to zero from $10 billion. Bitcoin (BTC) ETF flows have turned negative, down about
$3.3 billion so far in 2026, and Citi expects broader adoption to stall until a
new catalyst arrives.
Paul
Howard, Senior Director at Wincent, called June's roughly $4 billion in US spot
Bitcoin ETF outflows "part of a wider portfolio reallocation rather than a
structural loss of confidence."
Howard
argued that investors rotated into higher-conviction bets, particularly
high-profile IPOs and equities offering more immediate upside. Elevated rates
and geopolitical uncertainty pushed institutions to trim exposure to
higher-volatility assets, he added.
The
selloff has a clear structure:
Citi's cut: 12-month Bitcoin target down
to $82,000 from $112,000, Ethereum to $2,240 from $3,175
ETF inflow assumption: reduced to zero from $10
billion, with 2026 flows already down $3.3 billion
Record redemptions: US spot Bitcoin ETFs shed
roughly $4 billion in June, the largest monthly outflow on record
Capital rotation: allocators moved into the
SpaceX IPO and AI equities, draining crypto liquidity
Stalled legislation: no progress on US digital
asset market structure to anchor institutional allocations
Bitcoin Technical
Analysis: The $60,000 Trendline Holds, for Now
My chart
shows Bitcoin bouncing 2.17% off the $59,900 shelf, defending both this week's
low and the ascending trendline that has framed price since the February
bottom.
Wednesday's
long candle rejected the move under $60,000 and closed back near $61,200, a
bullish wick on the daily. That candle and the trendline confirm my Tuesday
analysis rather than contradict it. The $60,000 zone is broken weekly support,
and price is now retesting it from below.
Two
exponential moving averages cap the tape. The 50 EMA sits at $66,144 and the
200 EMA at $76,037, both above spot and both sloping down, the bearish stack
that has defined Bitcoin since February.
In 15 years
reading daily charts, 10 of them at FinanceMagnates.com (my analyst page), a bounce into a falling 50 EMA is a sell
candidate until price reclaims it.
As my Tuesday analysis detailed, last week's weekly close
below $60,000 flipped former support into resistance under the polarity
principle and broke the ascending trendline drawn from December 2022 lows.
My primary
target stays at $44,100, the 100% Fibonacci extension of January's decline and
a 25% drop from spot, a level I first mapped in my earlier $45,000 forecast. The first shelf below sits at
$53,700, the summer 2024 low.
Can Bitcoin hold the $60,000 trendline or does the break target $44,100? Source: Tradingview.com
A weekly reclaim of $60,000 and the 200 EMA near
$76,000 is what invalidates the bear case.
Level
Type
Notes
$76,037
200 EMA / Resistance
Trend
divider, bull reclaim line
$66,144
50 EMA / Resistance
Caps
every bounce since February
$59,900-$60,000
Support / Trigger
Ascending
trendline, broken weekly floor
$53,700
Support
Summer
2024 low, first shelf below
$44,100
Target
100% Fibonacci extension, 25% below spot
Ethereum Technical
Analysis: Consolidating Below the $1,800 Shelf
Ethereum (ETH) added 2.42% to $1,648 on Thursday, but my
chart shows price consolidating below the 2026 lows near $1,800, the shelf
marked by the $1,761 level. The rebound has not changed the structure. Local
support sits at $1,550, the floor set by the early June lows, and a daily close
below it opens the path lower.
The moving
average grid is stacked against ETH. The 50 EMA runs at $1,809 and the 200 EMA
at $2,275, both well above spot and both pointed down. Spot trades nearly 38%
under the 200 EMA, a gap that measures how far the Ethereum downtrend has
stretched.
Ethereum
sits roughly 66% below its August 2025 record, and until it reclaims the $1,809
average, every rally is a lower high in my framework.
My two
bearish targets still wait for a print. The first is $1,407, the April 2025 low
I marked as Target 1. The second is the round $1,000 handle near the $1,074
November 2022 low, Target 2 on my chart.
As my February Ethereum analysis mapped, the $1,760, $1,400, and
$1,000 levels form the descending target stack, and my November forecast flagged the same $1,400 April zone
as the medium-term destination.
Maxime
Seiler, CEO and Co-Founder at STS Digital, reads the weakness as flow-driven.
He called June's drop "less macro and more a simple lack of fresh
capital," pointing to the SpaceX IPO pulling allocation out of crypto
entirely.
How low can Ethereum go below the $1,800 shelf? Source: Tradingview.com
Seiler sees
institutions still deploying, only slower, with the AI narrative and the SpaceX
listing offering cleaner return asymmetry than a range-bound market.
How Low Can Bitcoin and
Ethereum Go? Price Predictions
Its $53,000
bear case sits just above my $44,100 target, so on the downside my chart is
more aggressive than Citi's. For Ethereum, Citi's $2,240 base case would need
ETH to clear the $1,809 and $2,275 EMAs, a move the chart shows no sign of,
while its $1,094 bear case aligns almost exactly with my $1,000 Target 2.
The bull
case leans on institutions stepping in lower. Paul Howard expects the $50,000
region to attract renewed institutional interest, a level that sits between my
$53,700 shelf and my $44,100 target.
Maxime
Seiler sees the four-year cycle intact and argues capital returns once
regulatory clarity and price momentum realign. Standard Chartered's prior
$7,500 Ethereum target and Bernstein's $150,000 Bitcoin call remain the far
bull markers, both requiring a macro turn neither chart confirms.
Source
Target
My View
Citi (base, BTC)
$82,000
Needs a
weekly $60,000 reclaim first, not yet in play
Citi (bear, BTC)
$53,000
Just
above my $44,100 target, my chart is lower
Citi (base, ETH)
$2,240
Blocked
by the $1,809 and $2,275 EMAs
Citi (bear, ETH)
$1,094
Aligns with my $1,000 Target 2
Standard Chartered (ETH)
$7,500
Far bull
case, needs a macro turn
Bernstein (BTC)
$150,000
Requires
a 200 EMA reclaim near $76,000
FAQ, Bitcoin and Ethereum
Price Prediction
Why did Citi cut its
Bitcoin and Ethereum price targets?
Citi
lowered its 12-month Bitcoin target to $82,000 from $112,000 and Ethereum to
$2,240 from $3,175 on July 1, 2026. The bank cut its expected net ETF inflows
to zero from $10 billion, citing negative flows, weak investor appetite, and
stalled US crypto legislation. Its bear case values Bitcoin at $53,000 and
Ethereum at $1,094.
How low can Bitcoin go in
2026?
My chart
targets $44,100, the 100% Fibonacci extension of January's decline and a 25%
drop from the $61,200 spot price. The first support shelf sits at $53,700, the
summer 2024 low. A weekly close reclaiming $60,000 and the 200 EMA near $76,000
would invalidate that bearish path and shift focus higher.
How low can Ethereum go?
My two
bearish targets are $1,407, the April 2025 low, and the round $1,000 handle
near the $1,074 November 2022 low. Ethereum trades below its 50 EMA at $1,809
and its 200 EMA at $2,275, with local support at $1,550. A daily close below
$1,550 opens the path toward those targets.
Are the Bitcoin ETF
outflows a structural problem?
Paul Howard
of Wincent views June's roughly $4 billion in outflows as portfolio
reallocation, not lost conviction, with capital rotating into IPOs and
equities. Maxime Seiler of STS Digital ties the drop to a lack of fresh capital
after the SpaceX IPO. Both expect flows to return once regulation and momentum
realign.
What would reverse the
crypto selloff?
A reversal
needs three things: ETF outflows turning to sustained inflows, progress on US
crypto market structure legislation, and a friendlier macro backdrop. On my
charts, Bitcoin must reclaim $60,000 and the 200 EMA near $76,000, and Ethereum
must clear its $1,809 50 EMA, before the bearish structure flips.
Damian Chmiel is a Senior Analyst & Editor at Finance Magnates with more than 15 years of experience in the CFD and online trading industry. Active as both a trader and journalist since 2010, he focuses on broker coverage, fintech innovation, and regulatory developments across Europe, the Middle East, and Asia.
His work includes interviews with C-level leaders at major brokerages and fintech platforms, as well as co-authoring Finance Magnates’ quarterly industry benchmarking reports. Damian’s reporting is data-driven, market-aware, and grounded in direct industry engagement. His analysis and commentary have also been cited by external media outlets, including Investing.com, Binance, The Asset, Stockhead, and Dispatch.
Education:
MA in Finance and Accounting, Cracow University of Economics
Bitcoin Price Prediction: Bear Flag on the BTC Chart Targets $38,000, Retest of the 2024 Lows
Featured Videos
Why Africa's Trading Market Is Growing Fast | Kabelo Mathapo, Vantage Markets
Why Africa's Trading Market Is Growing Fast | Kabelo Mathapo, Vantage Markets
Why Africa's Trading Market Is Growing Fast | Kabelo Mathapo, Vantage Markets
Why Africa's Trading Market Is Growing Fast | Kabelo Mathapo, Vantage Markets
Africa's trading market is growing rapidly, driven by fintech innovation, mobile technology, digital payments, and increasing access to financial markets.
In this interview from the Finance Magnates Africa Summit 2026, Adam Button speaks with Kabelo Mathapo, Business Development Manager at Vantage Markets South Africa, about the trends shaping the industry and what traders are looking for from brokers today.
🎯 Topics covered:
- Growth of retail trading in Africa
- What traders look for in a broker
- Mobile trading and fintech innovation
- Local payment solutions and financial access
- Building trust through transparency and regulation
- The future of trading across Africa
- Crypto adoption and asset-backed digital currencies
💬 "You want a broker that's reliable, a broker that's going to secure your money, and a broker that's going to be there for the long term."
Whether you're a trader, fintech professional, broker, or simply interested in the future of financial markets, this conversation offers valuable insights into one of the fastest-growing regions in the industry.
📍 Recorded at the Finance Magnates Africa Summit 2026
#FinanceMagnates #VantageMarkets #AfricaTrading #Fintech #ForexTrading #OnlineTrading #Crypto #Investing #RetailTrading #FMAS2026 #TradingAfrica #FinancialMarkets #FintechAfrica #TradingCommunity #ForexBroker
Today’s Wednesday, the 1st of July 2026, and these are our main stories: Poland’s retail trading boom is reshaping the case for CFD brokers, CMC Markets announces a major sponsorship while its shares surge to a record high, and Leverate launches an AI data platform for brokers.
Today’s Wednesday, the 1st of July 2026, and these are our main stories: Poland’s retail trading boom is reshaping the case for CFD brokers, CMC Markets announces a major sponsorship while its shares surge to a record high, and Leverate launches an AI data platform for brokers.
Today’s Wednesday, the 1st of July 2026, and these are our main stories: Poland’s retail trading boom is reshaping the case for CFD brokers, CMC Markets announces a major sponsorship while its shares surge to a record high, and Leverate launches an AI data platform for brokers.
Today’s Wednesday, the 1st of July 2026, and these are our main stories: Poland’s retail trading boom is reshaping the case for CFD brokers, CMC Markets announces a major sponsorship while its shares surge to a record high, and Leverate launches an AI data platform for brokers.
Today’s Wednesday, the 1st of July 2026, and these are our main stories: Poland’s retail trading boom is reshaping the case for CFD brokers, CMC Markets announces a major sponsorship while its shares surge to a record high, and Leverate launches an AI data platform for brokers.
Today’s Wednesday, the 1st of July 2026, and these are our main stories: Poland’s retail trading boom is reshaping the case for CFD brokers, CMC Markets announces a major sponsorship while its shares surge to a record high, and Leverate launches an AI data platform for brokers.
Discover how FYNXT TradeOps Control Center helps forex brokers automate MT4 and MT5 operations, reduce manual workload, strengthen compliance, and save over 1,000 operational hours.
In this exclusive Finance Magnates webinar, FYNXT Chief Product Strategist Elian Daoud, reveals how brokers can modernize MetaTrader operations with a powerful suite of automation tools designed for risk management, trade operations, payments, account administration, dynamic leverage, swap management, and more.
Read article at: https://www.financemagnates.com/thought-leadership/how-fynxts-tradeops-control-center-bridges-a-20-year-technology-gap/
🚀 Key topics covered:
MT4 & MT5 operations automation
Dynamic Leverage with scheduling and multi-level rule hierarchy
Swap-Free Engine with advanced pricing controls
Bulk account, group, symbol, and balance updates
Trade creation, modification, and closure workflows
Holiday scheduling and session management
Manager account governance and access control
MT5 account archiving automation
Audit trails, compliance, and operational risk reduction
Multi-server MetaTrader management
AI roadmap for broker operations
💡 What you'll learn:
How brokers can eliminate repetitive manual tasks
Ways to reduce operational risk and human error
Best practices for managing MT4 and MT5 at scale
How dynamic leverage can improve risk management
Why scheduling and automation are becoming essential for modern brokerages
How FYNXT is preparing broker operations for the AI era
Whether you're a CEO, COO, Head of Operations, Risk Manager, Dealer, or Back Office professional, this webinar provides practical insights into streamlining brokerage operations while maintaining control, compliance, and transparency.
Chapters
00:00 Introduction
01:18 The MT4 Operations Challenge
04:54 TradeOps Control Center Overview
07:39 Full Suite Breakdown
10:06 Dynamic Leverage Deep Dive
17:19 Q&A: Dynamic Leverage
20:08 Swap-Free Engine Deep Dive
24:45 Account Updater
26:07 Manager Creator
28:03 Accounts Archiver
31:46 Additional Automation Tools
35:14 Phase 2: AI Roadmap
37:07 Live Q&A
48:34 Closing Remarks
#FYNXT #TradeOps #MetaTrader4 #MetaTrader5 #MT4 #MT5 #ForexBroker #BrokerTechnology #ForexTechnology #Fintech #BrokerOperations #DynamicLeverage #SwapFree #RiskManagement #Compliance #FinanceMagnates #ForexTrading #TradingTechnology #BackOfficeAutomation #BrokerAutomation
FM Daily Brief – 30 June 2026
FM Daily Brief – 30 June 2026
FM Daily Brief – 30 June 2026
FM Daily Brief – 30 June 2026
FM Daily Brief – 30 June 2026
FM Daily Brief – 30 June 2026
Today’s Tuesday, the 30th of June 2026, and these are our main stories: Asic warns that crypto perpetual futures are beginning to resemble CFDs, FM Intelligence tracks shifting broker web visibility, and the UK's FCA softens its stablecoin proposals.
Today’s Tuesday, the 30th of June 2026, and these are our main stories: Asic warns that crypto perpetual futures are beginning to resemble CFDs, FM Intelligence tracks shifting broker web visibility, and the UK's FCA softens its stablecoin proposals.
Today’s Tuesday, the 30th of June 2026, and these are our main stories: Asic warns that crypto perpetual futures are beginning to resemble CFDs, FM Intelligence tracks shifting broker web visibility, and the UK's FCA softens its stablecoin proposals.
Today’s Tuesday, the 30th of June 2026, and these are our main stories: Asic warns that crypto perpetual futures are beginning to resemble CFDs, FM Intelligence tracks shifting broker web visibility, and the UK's FCA softens its stablecoin proposals.
Today’s Tuesday, the 30th of June 2026, and these are our main stories: Asic warns that crypto perpetual futures are beginning to resemble CFDs, FM Intelligence tracks shifting broker web visibility, and the UK's FCA softens its stablecoin proposals.
Today’s Tuesday, the 30th of June 2026, and these are our main stories: Asic warns that crypto perpetual futures are beginning to resemble CFDs, FM Intelligence tracks shifting broker web visibility, and the UK's FCA softens its stablecoin proposals.
FM Daily Brief – 29 June 2026
FM Daily Brief – 29 June 2026
FM Daily Brief – 29 June 2026
FM Daily Brief – 29 June 2026
FM Daily Brief – 29 June 2026
FM Daily Brief – 29 June 2026
Today’s Monday, the 29th of June 2026, and these are our main stories: why foreign brokers are abandoning South Africa’s ODP licence regime, Plus500’s expansion into sports prediction markets, and regulatory concerns over staff trading controls in Dubai.
Today’s Monday, the 29th of June 2026, and these are our main stories: why foreign brokers are abandoning South Africa’s ODP licence regime, Plus500’s expansion into sports prediction markets, and regulatory concerns over staff trading controls in Dubai.
Today’s Monday, the 29th of June 2026, and these are our main stories: why foreign brokers are abandoning South Africa’s ODP licence regime, Plus500’s expansion into sports prediction markets, and regulatory concerns over staff trading controls in Dubai.
Today’s Monday, the 29th of June 2026, and these are our main stories: why foreign brokers are abandoning South Africa’s ODP licence regime, Plus500’s expansion into sports prediction markets, and regulatory concerns over staff trading controls in Dubai.
Today’s Monday, the 29th of June 2026, and these are our main stories: why foreign brokers are abandoning South Africa’s ODP licence regime, Plus500’s expansion into sports prediction markets, and regulatory concerns over staff trading controls in Dubai.
Today’s Monday, the 29th of June 2026, and these are our main stories: why foreign brokers are abandoning South Africa’s ODP licence regime, Plus500’s expansion into sports prediction markets, and regulatory concerns over staff trading controls in Dubai.