Bitcoin fell to $88,626 on its sixth straight decline, while Ethereum dropped to $2,920, and XRP logged 7 consecutive down sessions amid tariff fears.
BTC price targets $74,000 next, with extreme risk to $52,000, while Ethereum aims for $2,750, then $2,100.
Despite record institutional interest, $500 million in Bitcoin ETF outflows over two sessions show hot money exiting amid geopolitical tensions.
Why Bitcoin is going down today? Let's check current BTC price technical analysis and forecasts
Why
crypto is going down today and why crypto is falling can be summed up in one
sentence: this is a classic macro-driven risk-off move hitting a technically
weak market, with my charts on Bitcoin, Ethereum, XRP and Dogecoin all pointing
lower.
The
cryptocurrency market extended its selloff on Wednesday, January 21, 2026, as
Bitcoin dropped below $89,000 to trade around $88,626, Ethereum slipped to
$2,920, and XRP logged its seventh consecutive down session at $1.89.
Let’s check
together why crypto is falling today. We’ll take a look at the charts and go
through XRP/USDT, BTC/USDT, ETH/USDT, and DOGE/USDT, walking step by
step through a technical analysis based on my more than ten years of experience
as an investor and analyst.
European
Commission President Ursula von der Leyen stated that any EU response to US
measures would be "unflinching, united, and proportional," reinforcing
market concerns about broader economic spillovers. As one European politician
put it, Trump's rhetoric serves as a "Nero warning" to
the established international order, and this fracture in Western alliances is
making Bitcoin and altcoins look even riskier in the near term.
Why
crypto is falling today extends beyond just tariff headlines. Safe-haven repricing has
accelerated as the EU weighs its "anti-coercion tool" and
potential retaliatory trade actions, with
gold investors now watching the $5,000 level as concerns mount.
Meanwhile, billionaire investor Ray Dalio warned that the global economy may be
entering a "new phase of financial conflict," telling
CNBC that geopolitical disputes increasingly risk spilling into capital flows
and asset allocation decisions.
Roughly $1.7
billion was liquidated from the crypto market in the last 24 hours
according to Coinglass, while the Crypto Fear & Greed Index lingers
in "Fear" territory. US spot Bitcoin ETFs have reversed
course to post nearly $500 million in outflows over just two
sessions, suggesting that last week's record inflows were driven by speculative
hot money rather than solid, long-term accumulation.
For
real-time Bitcoin, Ethereum, XRP and Dogecoin technical analysis as my charts
test critical support zones with extreme downside risk, follow me on X (Twitter) @ChmielDk. I provide
moving average updates, Fibonacci projections, and macro impact insights on why
crypto is falling today.
Macro Pressure Points
Driving Crypto Lower
Factor
Impact on Crypto
Trump tariff threats
EU-US
trade war risk, risk-off rotation
JGB yield spike
Record
highs across maturities, liquidity squeeze
BoJ policy meeting
Hawkish
tilt fears tightening global carry trades
US 5-year Treasury yield
Highest
in 6 months, recession/inflation signal
Bitcoin ETF outflows
~$500M in
2 sessions, institutional de-risking
Liquidations
$1.7B wiped in 24 hours
As Filip
Dzięciołowski from Cryps.pl warns, as long as "geopolitical
turmoil from Greenland to Iran" persists, safe bets like gold
look more attractive while "stocks and bitcoin" look
riskier, which is exactly the kind of environment where crypto is going down
today instead of bouncing.
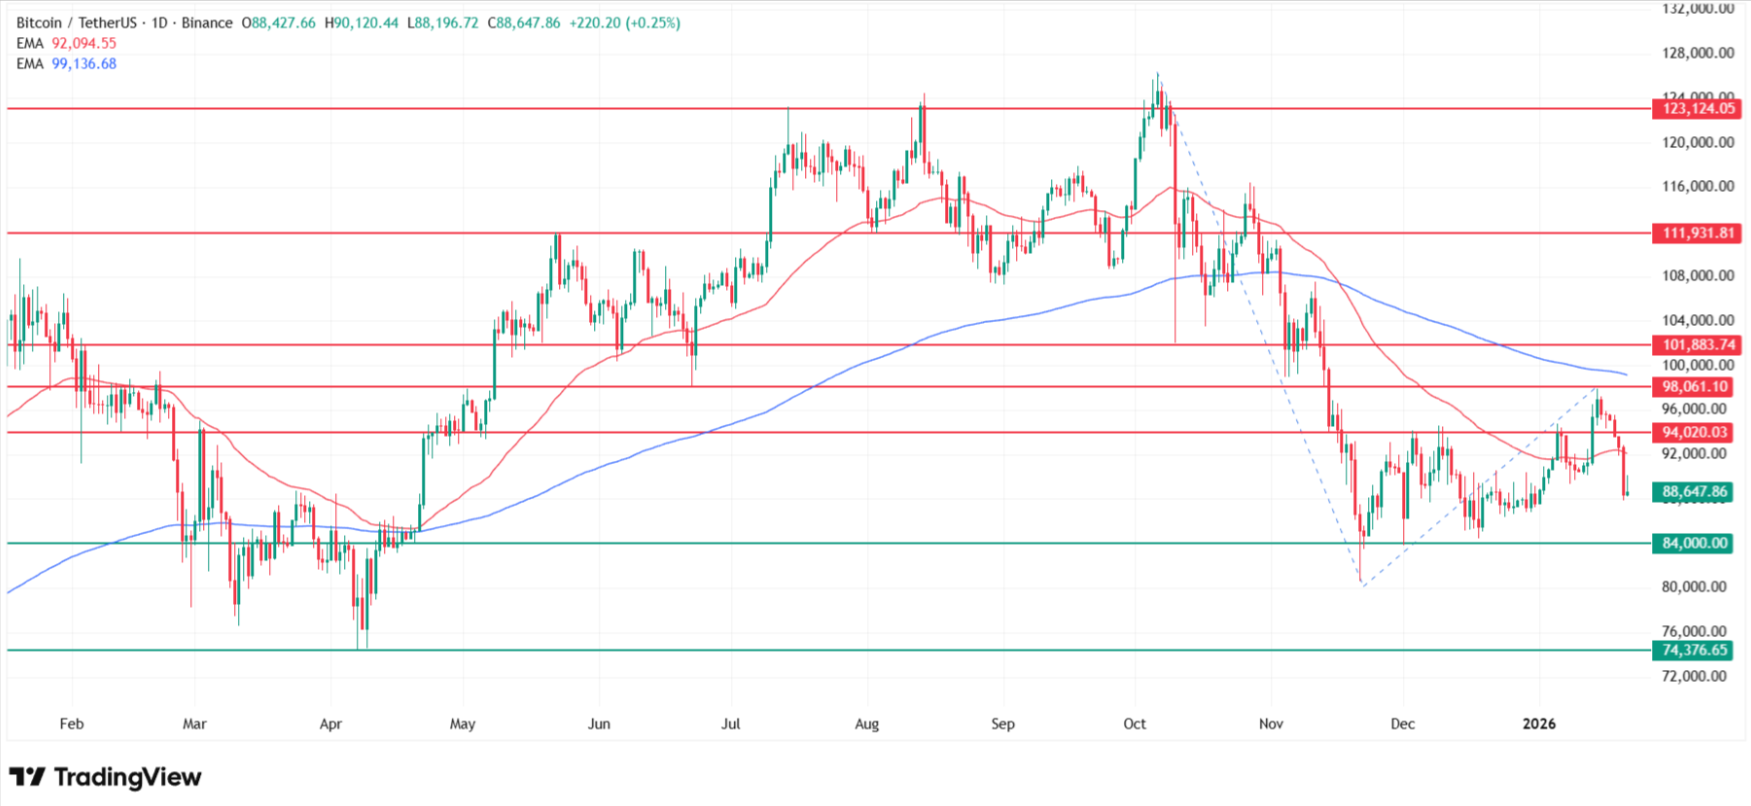
Bitcoin Price and
Technical Analysis: Why Bitcoin Is Falling?
Bitcoin has
just completed six straight down sessions, with only a tiny 0.2%
uptick today and is trading around $88,626. As you can see on my
chart, Bitcoin remains locked in a consolidation below the 200 EMA, which
confirms that in my technical view the market is officially in a
downtrend.
According
to my short-term chart, the immediate scenario is a test of
the lower boundary of the sideways range around $74,000. Bitcoin's current
price of $88,626 sits only 5% above this critical support zone, which
represents the November consolidation lows and the April 2025 yearly minimum of
$74,420.
My
technical analysis shows that the first downside target
from the daily chart is $74,000, followed by $68,000 from
the weekly chart, where the 200-week EMA is currently running.
If we reach that weekly level, Bitcoin would be trading nearly 23% below
current prices and testing a zone that has historically marked major cycle
lows.
Why Bitcoin price is going down today? Source: Tradingview.com
My extreme
bearish scenario, based on Fibonacci extensions, points to
around $52,000 on the Bitcoin chart, which would be the lowest
since August 2024. From current levels near $88,626, this represents a
potential decline of over 41%, though such a move would require a
complete breakdown of market structure and sustained macro stress.
Bitcoin Technical Roadmap
Current
price: $88,626
(Wednesday, Jan 21, 2026) Intraday low: $88,965 (lowest in 2+ weeks) Six-session decline: From ~$98,000 peak on Jan 17 (-9.6%)
My downside targets:
Immediate: $74,000 (November
consolidation lower band, April lows, -16%)
Medium-term: $68,000 (200-week EMA
zone, -23%)
Extreme Fibonacci: $52,000 (100% extension,
August 2024 lows, -41%)
Invalidation levels:
Reclaim
$98,000 (recent peak)
Break
above 200 EMA
Establish higher highs on daily
chart
Joel
Kruger, the LMAX strategist, still views Bitcoin's pullback as "corrective
rather than trend-breaking," noting that the asset has fallen
back into a familiar consolidation range and remains above its November lows,
preserving the broader medium-term uptrend structure. He adds that Bitcoin is
increasingly viewed as the "defensive anchor within the
sector" compared with high-beta alts, but in the near
term, my chart still points lower.
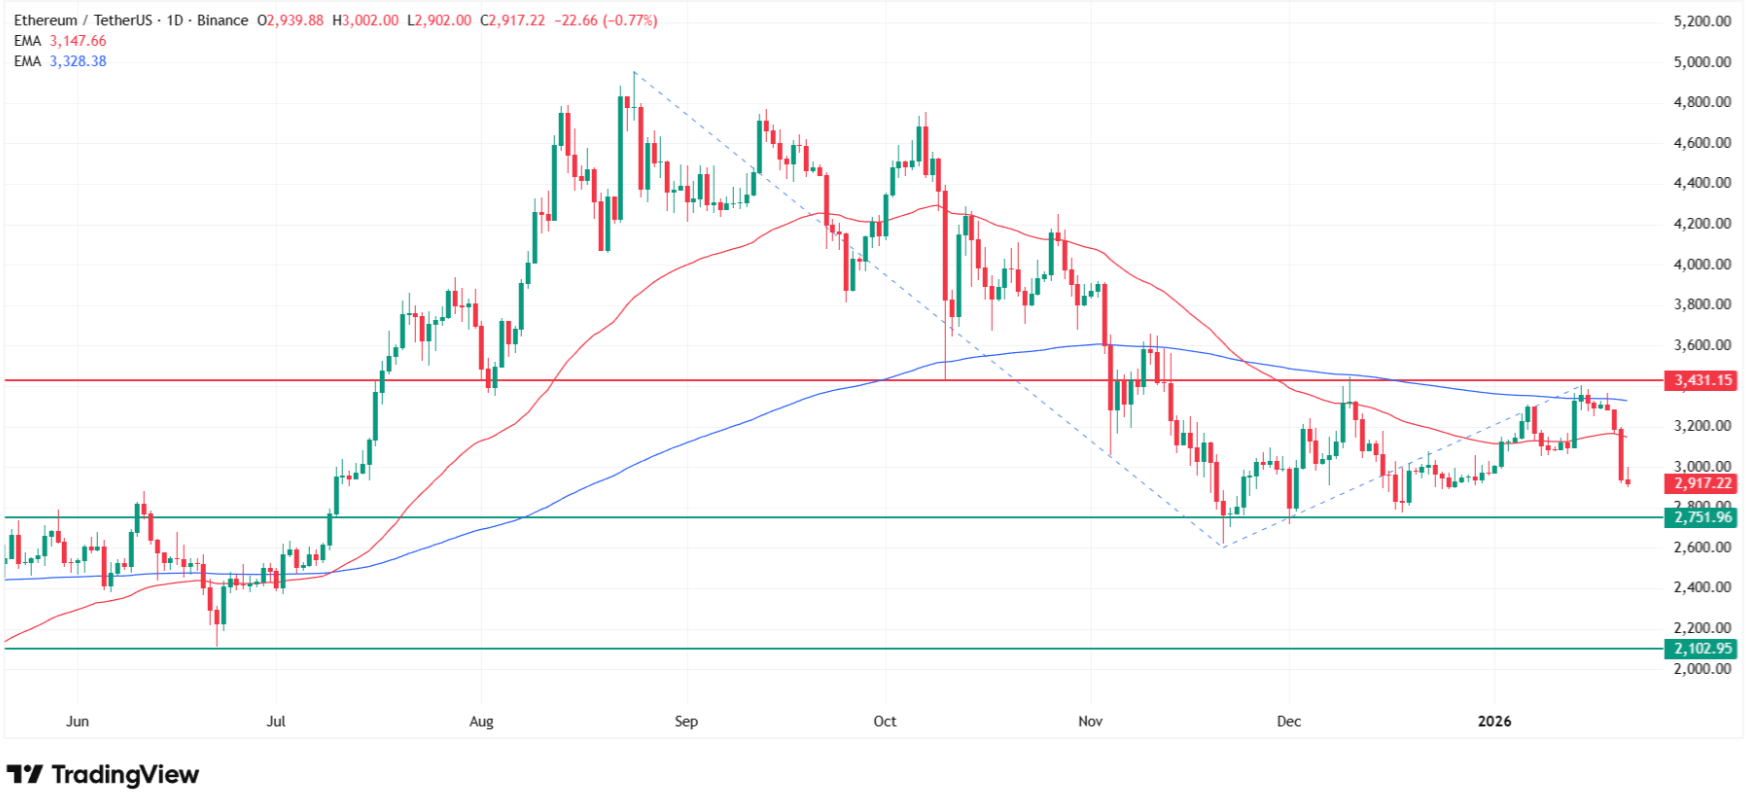
Ethereum Price and
Technical Analysis: Why Ethereum Is Going Down Today
Ethereum (ETH) price is logging
its fourth straight losing session, currently down about 0.7%
on Wednesday and trading near $2,920. As you can see
on my chart, ETH is clearly targeting at least $2,750,
which is the lower boundary of a two-month-long consolidation range.
My
medium-term downside target is the June lows near $2,100, extending toward
the round psychological support at $2,000. From current prices
around $2,920, this represents a potential decline of roughly 28-32%,
which would take Ethereum back to levels last seen during the summer
consolidation phase.
Why Ethereum price is going down today? Source: Tradingview.com
My extreme
bearish scenario, based on Fibonacci extensions, points toward the $1,000
area, which would mark the weakest Ethereum price since November 2022 and
represent a stunning 66% decline from current levels. While
this is an outlier scenario, it illustrates the tail risk embedded in the
current technical structure on my chart.
Ethereum Technical Levels
Current
price: $2,920
(down 0.7% Wednesday) Recent low: $2,965 (below $3K for first time in 3 weeks) Consolidation range: $2,750-$3,400 (two-month sideways pattern)
My downside targets:
Immediate: $2,750
(lower consolidation band, -6%)
Medium-term: $2,100
(June lows, -28%)
Round
support: $2,000 (psychological level, -32%)
Extreme
Fibonacci: $1,000 (Nov 2022 lows, -66%)
Bullish
invalidation on my chart:
Reclaim
200 EMA
Break back above $3,400 (upper
consolidation band)
Push through $3,800 (cluster
of autumn 2025 lows/highs)
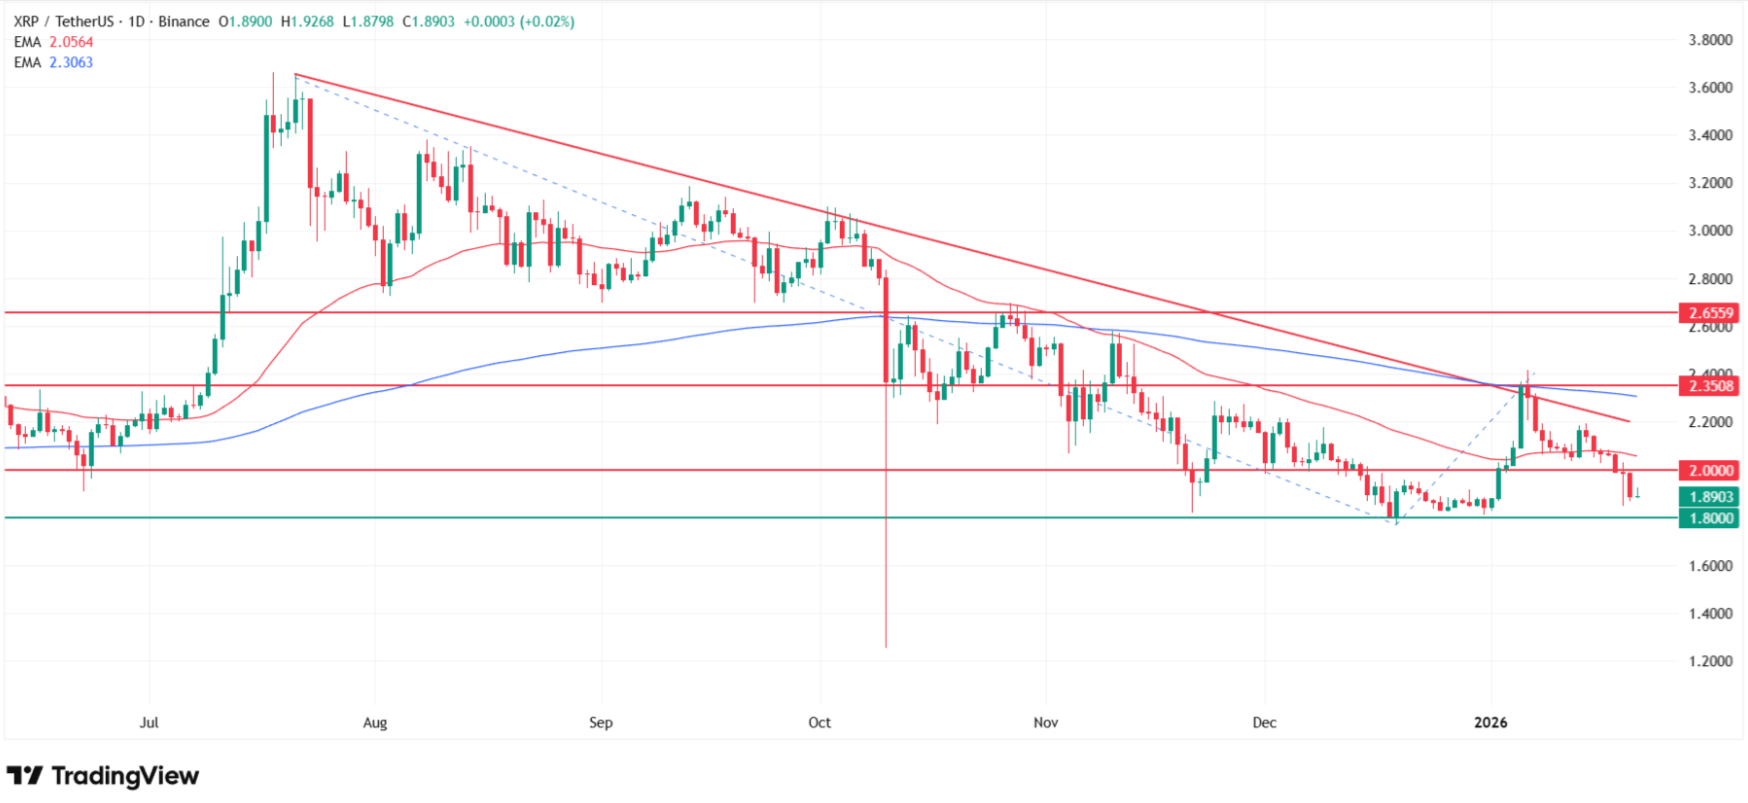
XRP Price and Technical
Analysis: Why XRP Is Falling
XRP has
just logged seven straight red sessions, and today (Wednesday, 21
January 2026) it is drifting toward the lower end of the range,
trading around $1.89. Since the early-January test of two-month
highs on January 6, there has been just one meaningful up session on
January 13, with the rest of the days dominated by declines, that's exactly
what my chart is highlighting.
XRP
recorded a 3.42% decline in Monday's session and continues to
trade defensively as the broader crypto market selloff intensifies. As you can
see on my technical setup, XRP is now facing a direct test of local
support at $1.80, which overlaps with this year's and last year's lows.
The
moving averages on my XRP chart clearly point to a bearish trend, and my
technical analysis shows that a clean break below $1.80 opens the way to deeper
depreciation. In
an environment where investors are running from risk, higher-beta,
litigation-scarred names like XRP tend to suffer more, which aligns with
the seven-session losing streak visible on my candles.
Why XRP price is going down today? Source: Tradingview.com
XRP Downside Roadmap on My
Chart
Current
price: $1.89
(Wednesday, 7th down session) Critical support: $1.80 (yearly/prior-year lows) Sessions: 7 straight declines (only 1 up day since Jan 6)
My
downside targets if $1.80 breaks:
First major target: $1.25 (flash-crash low
from October 10)
Extreme Fibonacci scenario: $0.50 (lowest XRP price
since November 2024)
If this
support band at $1.80 breaks on my technical setup, XRP
could accelerate lower toward the $1.25 zone, which I identify
as the flash-crash low from 10 October. That would represent
a 34% decline from current levels and would likely trigger
significant stop-loss cascades among leveraged traders.
My extreme
Fibonacci-based scenario on my chart points to around $0.50,
which would be the lowest XRP price since November 2024 and
represent a catastrophic 74% decline from current prices.
While this is a tail-risk scenario, the technical structure on my longer-term
charts keeps this level in play if the macro environment deteriorates further
and liquidations accelerate.
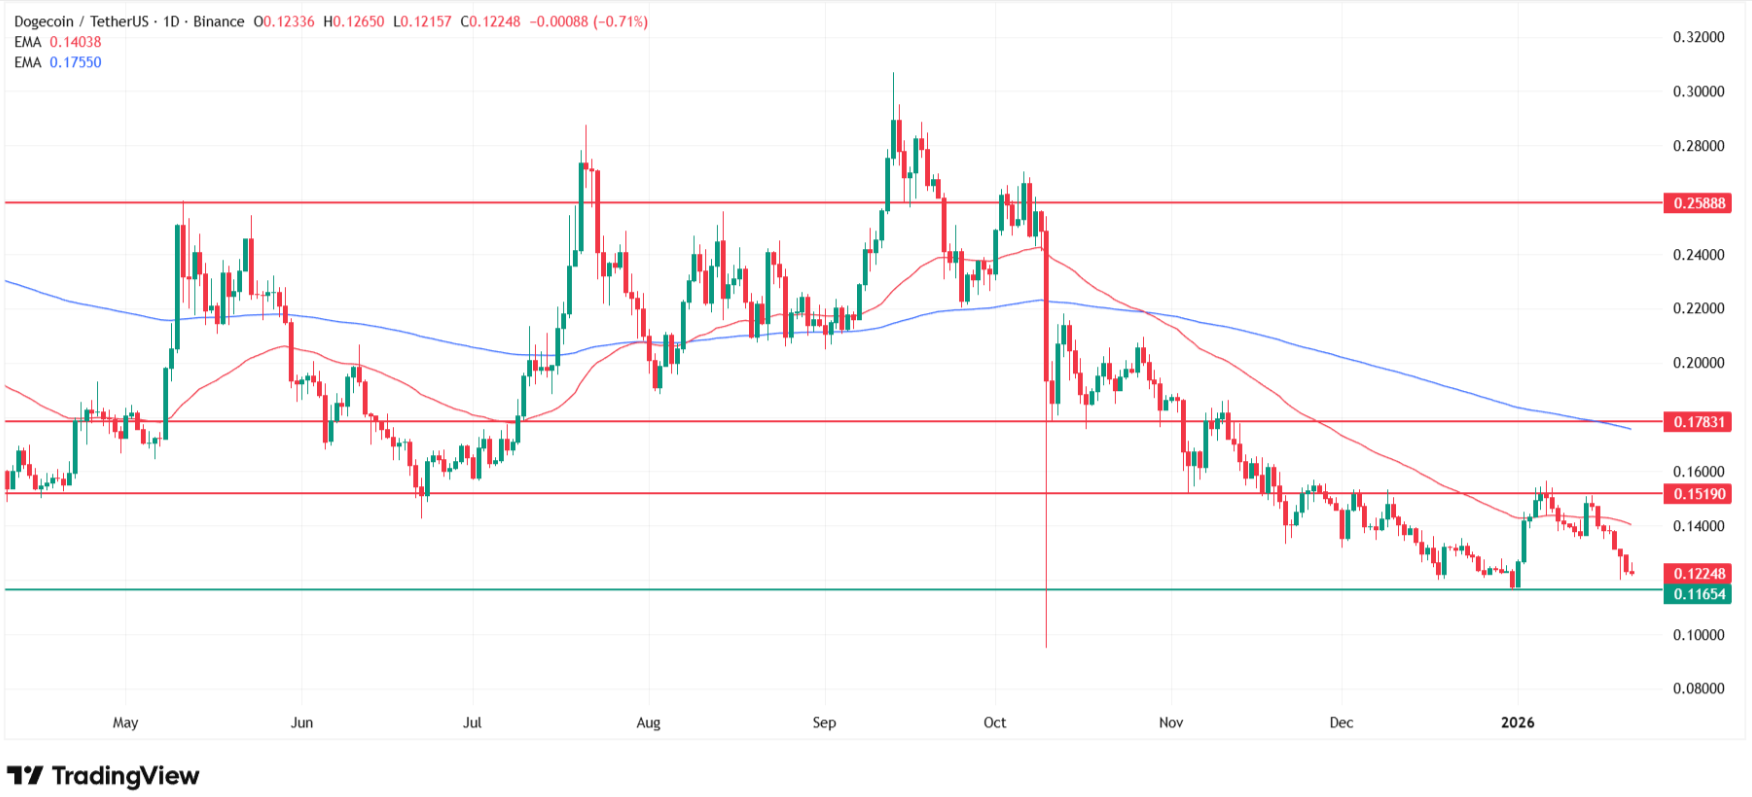
Dogecoin Price and
Technical Analysis: Why Dogecoin Is Going Down Today
Since 6
January, Dogecoin (DOGE)
has had only one green session (13 January), and is now falling for
the eighth straight day, down around 0.7% on Wednesday and
changing hands near $0.1254. As you can see on my chart,
DOGE is clearly pointed toward this year's lows in the $0.12065 region,
which also lines up with the lower limit of the recent consolidation.
Dogecoin
recorded a 2.23% decline in Monday's session, making it one of
the better performers among major cryptocurrencies on a relative basis, though
the absolute trend remains firmly negative. On my technical setup,
Dogecoin could accelerate lower, potentially slipping below $0.08, which is
the next major downside zone I am watching if the current support fails.
Dogecoin Technical
Structure
Why Dogecoin price is going down today? Source: Tradingview.com
Current
price: $0.1254
(8th straight down day) Winning sessions since Jan 6: Only 1 (out of 15 total sessions) Current target: $0.12065 (2026 lows, lower consolidation limit)
My downside scenario:
If support breaks: Below $0.08 (next major
support zone, -36%)
From my
perspective, the negative scenario gets properly neutralized only if Dogecoin
can reclaim at least $0.18, where the 200 EMA currently sits and
where a key resistance cluster formed by the mid-October lows and mid-November
highs is located. A move back above that region would reopen the way
toward $0.26, last seen only three months ago in October 2025.
FAQ: Why Crypto Is Going
Down Today
Why is crypto going down
today?
Why crypto
is going down today: Bitcoin fell to $88,626, Ethereum to $2,920, XRP logged
7th straight decline to $1.89, driven by Trump tariff threats over Greenland
triggering risk-off rotation. According to my technical analysis, Bitcoin
targets $74K consolidation lower band, with extreme risk to $52K on Fibonacci
extensions. $1.7B liquidated in 24 hours, $500M ETF outflows in 2 sessions.
Why is Bitcoin falling?
Bitcoin is
falling after 6 straight down sessions, now at $88,626, as you can see on my
chart below 200 EMA in confirmed downtrend. My technical analysis shows
immediate test of $74K (Nov consolidation/April lows), then $68K (200-week
EMA), extreme scenario $52K (-41%). EU Commission President warns response will
be "unflinching" to tariffs, JGB yields hit records, tightening
global liquidity.
Why is Ethereum going down
today?
Ethereum
down 4th straight session to $2,920, fell below $3K for first time in 3 weeks.
On my chart, ETH targeting $2,750 lower consolidation band, then $2,100 June
lows (-28%), extreme $1,000 Fibonacci scenario (-66%). ETH/BTC ratio sliding as
Ethereum trades "more like a growth asset with higher sensitivity to
liquidity and risk sentiment" per LMAX analyst.
Why is XRP falling?
XRP falling
7th straight session to $1.89, only 1 up day since Jan 6 highs. Moving averages
on my XRP chart clearly point to bearish trend, with direct test of $1.80
yearly/prior-year lows support. My technical analysis shows break below $1.80
opens way to $1.25 flash-crash lows (-34%), extreme Fibonacci $0.50 (-74%).
Higher-beta, litigation-scarred names suffer more in risk-off.
Why is Dogecoin going down
today?
Dogecoin
down 8th straight day to $0.1254, only 1 green session since Jan 6 (out of 15
total). On my chart, DOGE targeting $0.12065 (2026 lows, lower consolidation),
break opens path below $0.08 (-36%). Bullish invalidation only if reclaim $0.18
(200 EMA, Oct/Nov resistance cluster) toward $0.26. Macro risk-off draining
liquidity from most speculative corners.
Why
crypto is going down today and why crypto is falling can be summed up in one
sentence: this is a classic macro-driven risk-off move hitting a technically
weak market, with my charts on Bitcoin, Ethereum, XRP and Dogecoin all pointing
lower.
The
cryptocurrency market extended its selloff on Wednesday, January 21, 2026, as
Bitcoin dropped below $89,000 to trade around $88,626, Ethereum slipped to
$2,920, and XRP logged its seventh consecutive down session at $1.89.
Let’s check
together why crypto is falling today. We’ll take a look at the charts and go
through XRP/USDT, BTC/USDT, ETH/USDT, and DOGE/USDT, walking step by
step through a technical analysis based on my more than ten years of experience
as an investor and analyst.
European
Commission President Ursula von der Leyen stated that any EU response to US
measures would be "unflinching, united, and proportional," reinforcing
market concerns about broader economic spillovers. As one European politician
put it, Trump's rhetoric serves as a "Nero warning" to
the established international order, and this fracture in Western alliances is
making Bitcoin and altcoins look even riskier in the near term.
Why
crypto is falling today extends beyond just tariff headlines. Safe-haven repricing has
accelerated as the EU weighs its "anti-coercion tool" and
potential retaliatory trade actions, with
gold investors now watching the $5,000 level as concerns mount.
Meanwhile, billionaire investor Ray Dalio warned that the global economy may be
entering a "new phase of financial conflict," telling
CNBC that geopolitical disputes increasingly risk spilling into capital flows
and asset allocation decisions.
Roughly $1.7
billion was liquidated from the crypto market in the last 24 hours
according to Coinglass, while the Crypto Fear & Greed Index lingers
in "Fear" territory. US spot Bitcoin ETFs have reversed
course to post nearly $500 million in outflows over just two
sessions, suggesting that last week's record inflows were driven by speculative
hot money rather than solid, long-term accumulation.
For
real-time Bitcoin, Ethereum, XRP and Dogecoin technical analysis as my charts
test critical support zones with extreme downside risk, follow me on X (Twitter) @ChmielDk. I provide
moving average updates, Fibonacci projections, and macro impact insights on why
crypto is falling today.
Macro Pressure Points
Driving Crypto Lower
Factor
Impact on Crypto
Trump tariff threats
EU-US
trade war risk, risk-off rotation
JGB yield spike
Record
highs across maturities, liquidity squeeze
BoJ policy meeting
Hawkish
tilt fears tightening global carry trades
US 5-year Treasury yield
Highest
in 6 months, recession/inflation signal
Bitcoin ETF outflows
~$500M in
2 sessions, institutional de-risking
Liquidations
$1.7B wiped in 24 hours
As Filip
Dzięciołowski from Cryps.pl warns, as long as "geopolitical
turmoil from Greenland to Iran" persists, safe bets like gold
look more attractive while "stocks and bitcoin" look
riskier, which is exactly the kind of environment where crypto is going down
today instead of bouncing.
Bitcoin Price and
Technical Analysis: Why Bitcoin Is Falling?
Bitcoin has
just completed six straight down sessions, with only a tiny 0.2%
uptick today and is trading around $88,626. As you can see on my
chart, Bitcoin remains locked in a consolidation below the 200 EMA, which
confirms that in my technical view the market is officially in a
downtrend.
According
to my short-term chart, the immediate scenario is a test of
the lower boundary of the sideways range around $74,000. Bitcoin's current
price of $88,626 sits only 5% above this critical support zone, which
represents the November consolidation lows and the April 2025 yearly minimum of
$74,420.
My
technical analysis shows that the first downside target
from the daily chart is $74,000, followed by $68,000 from
the weekly chart, where the 200-week EMA is currently running.
If we reach that weekly level, Bitcoin would be trading nearly 23% below
current prices and testing a zone that has historically marked major cycle
lows.
Why Bitcoin price is going down today? Source: Tradingview.com
My extreme
bearish scenario, based on Fibonacci extensions, points to
around $52,000 on the Bitcoin chart, which would be the lowest
since August 2024. From current levels near $88,626, this represents a
potential decline of over 41%, though such a move would require a
complete breakdown of market structure and sustained macro stress.
Bitcoin Technical Roadmap
Current
price: $88,626
(Wednesday, Jan 21, 2026) Intraday low: $88,965 (lowest in 2+ weeks) Six-session decline: From ~$98,000 peak on Jan 17 (-9.6%)
My downside targets:
Immediate: $74,000 (November
consolidation lower band, April lows, -16%)
Medium-term: $68,000 (200-week EMA
zone, -23%)
Extreme Fibonacci: $52,000 (100% extension,
August 2024 lows, -41%)
Invalidation levels:
Reclaim
$98,000 (recent peak)
Break
above 200 EMA
Establish higher highs on daily
chart
Joel
Kruger, the LMAX strategist, still views Bitcoin's pullback as "corrective
rather than trend-breaking," noting that the asset has fallen
back into a familiar consolidation range and remains above its November lows,
preserving the broader medium-term uptrend structure. He adds that Bitcoin is
increasingly viewed as the "defensive anchor within the
sector" compared with high-beta alts, but in the near
term, my chart still points lower.
Ethereum Price and
Technical Analysis: Why Ethereum Is Going Down Today
Ethereum (ETH) price is logging
its fourth straight losing session, currently down about 0.7%
on Wednesday and trading near $2,920. As you can see
on my chart, ETH is clearly targeting at least $2,750,
which is the lower boundary of a two-month-long consolidation range.
My
medium-term downside target is the June lows near $2,100, extending toward
the round psychological support at $2,000. From current prices
around $2,920, this represents a potential decline of roughly 28-32%,
which would take Ethereum back to levels last seen during the summer
consolidation phase.
Why Ethereum price is going down today? Source: Tradingview.com
My extreme
bearish scenario, based on Fibonacci extensions, points toward the $1,000
area, which would mark the weakest Ethereum price since November 2022 and
represent a stunning 66% decline from current levels. While
this is an outlier scenario, it illustrates the tail risk embedded in the
current technical structure on my chart.
Ethereum Technical Levels
Current
price: $2,920
(down 0.7% Wednesday) Recent low: $2,965 (below $3K for first time in 3 weeks) Consolidation range: $2,750-$3,400 (two-month sideways pattern)
My downside targets:
Immediate: $2,750
(lower consolidation band, -6%)
Medium-term: $2,100
(June lows, -28%)
Round
support: $2,000 (psychological level, -32%)
Extreme
Fibonacci: $1,000 (Nov 2022 lows, -66%)
Bullish
invalidation on my chart:
Reclaim
200 EMA
Break back above $3,400 (upper
consolidation band)
Push through $3,800 (cluster
of autumn 2025 lows/highs)
XRP Price and Technical
Analysis: Why XRP Is Falling
XRP has
just logged seven straight red sessions, and today (Wednesday, 21
January 2026) it is drifting toward the lower end of the range,
trading around $1.89. Since the early-January test of two-month
highs on January 6, there has been just one meaningful up session on
January 13, with the rest of the days dominated by declines, that's exactly
what my chart is highlighting.
XRP
recorded a 3.42% decline in Monday's session and continues to
trade defensively as the broader crypto market selloff intensifies. As you can
see on my technical setup, XRP is now facing a direct test of local
support at $1.80, which overlaps with this year's and last year's lows.
The
moving averages on my XRP chart clearly point to a bearish trend, and my
technical analysis shows that a clean break below $1.80 opens the way to deeper
depreciation. In
an environment where investors are running from risk, higher-beta,
litigation-scarred names like XRP tend to suffer more, which aligns with
the seven-session losing streak visible on my candles.
Why XRP price is going down today? Source: Tradingview.com
XRP Downside Roadmap on My
Chart
Current
price: $1.89
(Wednesday, 7th down session) Critical support: $1.80 (yearly/prior-year lows) Sessions: 7 straight declines (only 1 up day since Jan 6)
My
downside targets if $1.80 breaks:
First major target: $1.25 (flash-crash low
from October 10)
Extreme Fibonacci scenario: $0.50 (lowest XRP price
since November 2024)
If this
support band at $1.80 breaks on my technical setup, XRP
could accelerate lower toward the $1.25 zone, which I identify
as the flash-crash low from 10 October. That would represent
a 34% decline from current levels and would likely trigger
significant stop-loss cascades among leveraged traders.
My extreme
Fibonacci-based scenario on my chart points to around $0.50,
which would be the lowest XRP price since November 2024 and
represent a catastrophic 74% decline from current prices.
While this is a tail-risk scenario, the technical structure on my longer-term
charts keeps this level in play if the macro environment deteriorates further
and liquidations accelerate.
Dogecoin Price and
Technical Analysis: Why Dogecoin Is Going Down Today
Since 6
January, Dogecoin (DOGE)
has had only one green session (13 January), and is now falling for
the eighth straight day, down around 0.7% on Wednesday and
changing hands near $0.1254. As you can see on my chart,
DOGE is clearly pointed toward this year's lows in the $0.12065 region,
which also lines up with the lower limit of the recent consolidation.
Dogecoin
recorded a 2.23% decline in Monday's session, making it one of
the better performers among major cryptocurrencies on a relative basis, though
the absolute trend remains firmly negative. On my technical setup,
Dogecoin could accelerate lower, potentially slipping below $0.08, which is
the next major downside zone I am watching if the current support fails.
Dogecoin Technical
Structure
Why Dogecoin price is going down today? Source: Tradingview.com
Current
price: $0.1254
(8th straight down day) Winning sessions since Jan 6: Only 1 (out of 15 total sessions) Current target: $0.12065 (2026 lows, lower consolidation limit)
My downside scenario:
If support breaks: Below $0.08 (next major
support zone, -36%)
From my
perspective, the negative scenario gets properly neutralized only if Dogecoin
can reclaim at least $0.18, where the 200 EMA currently sits and
where a key resistance cluster formed by the mid-October lows and mid-November
highs is located. A move back above that region would reopen the way
toward $0.26, last seen only three months ago in October 2025.
FAQ: Why Crypto Is Going
Down Today
Why is crypto going down
today?
Why crypto
is going down today: Bitcoin fell to $88,626, Ethereum to $2,920, XRP logged
7th straight decline to $1.89, driven by Trump tariff threats over Greenland
triggering risk-off rotation. According to my technical analysis, Bitcoin
targets $74K consolidation lower band, with extreme risk to $52K on Fibonacci
extensions. $1.7B liquidated in 24 hours, $500M ETF outflows in 2 sessions.
Why is Bitcoin falling?
Bitcoin is
falling after 6 straight down sessions, now at $88,626, as you can see on my
chart below 200 EMA in confirmed downtrend. My technical analysis shows
immediate test of $74K (Nov consolidation/April lows), then $68K (200-week
EMA), extreme scenario $52K (-41%). EU Commission President warns response will
be "unflinching" to tariffs, JGB yields hit records, tightening
global liquidity.
Why is Ethereum going down
today?
Ethereum
down 4th straight session to $2,920, fell below $3K for first time in 3 weeks.
On my chart, ETH targeting $2,750 lower consolidation band, then $2,100 June
lows (-28%), extreme $1,000 Fibonacci scenario (-66%). ETH/BTC ratio sliding as
Ethereum trades "more like a growth asset with higher sensitivity to
liquidity and risk sentiment" per LMAX analyst.
Why is XRP falling?
XRP falling
7th straight session to $1.89, only 1 up day since Jan 6 highs. Moving averages
on my XRP chart clearly point to bearish trend, with direct test of $1.80
yearly/prior-year lows support. My technical analysis shows break below $1.80
opens way to $1.25 flash-crash lows (-34%), extreme Fibonacci $0.50 (-74%).
Higher-beta, litigation-scarred names suffer more in risk-off.
Why is Dogecoin going down
today?
Dogecoin
down 8th straight day to $0.1254, only 1 green session since Jan 6 (out of 15
total). On my chart, DOGE targeting $0.12065 (2026 lows, lower consolidation),
break opens path below $0.08 (-36%). Bullish invalidation only if reclaim $0.18
(200 EMA, Oct/Nov resistance cluster) toward $0.26. Macro risk-off draining
liquidity from most speculative corners.
Damian Chmiel is a Senior Analyst & Editor at Finance Magnates with more than 15 years of experience in the CFD and online trading industry. Active as both a trader and journalist since 2010, he focuses on broker coverage, fintech innovation, and regulatory developments across Europe, the Middle East, and Asia.
His work includes interviews with C-level leaders at major brokerages and fintech platforms, as well as co-authoring Finance Magnates’ quarterly industry benchmarking reports. Damian’s reporting is data-driven, market-aware, and grounded in direct industry engagement. His analysis and commentary have also been cited by external media outlets, including Investing.com, Binance, The Asset, Stockhead, and Dispatch.
Education:
MA in Finance and Accounting, Cracow University of Economics
Inside the Prediction Markets: $1.6B Institutional Inflow Meets a Federal Crackdown
Featured Videos
FP Markets Winner Spotlight 🏆 | Global Broker of the Year 2025 #Trading #Broker #Innovation #Shorts
FP Markets Winner Spotlight 🏆 | Global Broker of the Year 2025 #Trading #Broker #Innovation #Shorts
FP Markets Winner Spotlight 🏆 | Global Broker of the Year 2025 #Trading #Broker #Innovation #Shorts
FP Markets Winner Spotlight 🏆 | Global Broker of the Year 2025 #Trading #Broker #Innovation #Shorts
FP Markets takes the spotlight as Global Broker of the Year 2025 at the Finance Magnates Awards.
Martin Stoilov, Head of Client Experience, shares that trust, innovation, and people played a key role in the company’s success, supported by a strong foundation of integrity and client-centricity.
Following this milestone, FP Markets continues to focus on growth, technology investment, and its core values of transparency and excellence.
👉 Be part of FM Awards 2026: https://awards.financemagnates.com/#nominate
In this video, we review @HolaPrimeMarketsOfficial, a multi-asset forex and CFDs broker offering different account types, trading platforms, and flexible trading conditions.
We cover the broker’s overall offering, including account options, trading environment, platforms like MT4 and MT5, and additional services such as managed accounts and fast withdrawals.
Watch the full video to see if Hola Prime Markets fits your trading needs.
📣 Stay up to date with the latest in finance and trading. Follow Finance Magnates for industry news, insights, and global event coverage.
Connect with us:
🔗 LinkedIn: /financemagnates
👍 Facebook: /financemagnates
📸 Instagram: https://www.instagram.com/financemagnates
🐦 X: https://x.com/financemagnates
🎥 TikTok: https://www.tiktok.com/tag/financemagnates
▶️ YouTube: /@financemagnates_official
#HolaPrime #ForexBroker #CFDTrading #FinanceMagnates #Trading #Forex #BrokerReview
Hola Prime Review: What You Need to Know | Full Breakdown by Finance Magnates
Hola Prime Review: What You Need to Know | Full Breakdown by Finance Magnates
Hola Prime Review: What You Need to Know | Full Breakdown by Finance Magnates
Hola Prime Review: What You Need to Know | Full Breakdown by Finance Magnates
Hola Prime Review: What You Need to Know | Full Breakdown by Finance Magnates
Hola Prime Review: What You Need to Know | Full Breakdown by Finance Magnates
In this video, we review @HolaPrime_Global, a proprietary trading firm offering evaluation programs and performance-based payouts in simulated market environments.
We cover how the challenge model works, including account types, profit splits (up to 95%), trading rules, and what it takes to reach a funded account. You’ll also learn about available platforms like MT4, MT5, cTrader, and more, along with insights into payouts, support, and trading conditions.
Watch the full video to see if Hola Prime fits your trading style.
📣 Stay up to date with the latest in finance and trading. Follow Finance Magnates for industry news, insights, and global event coverage.
Connect with us:
🔗 LinkedIn: /financemagnates
👍 Facebook: /financemagnates
📸 Instagram: https://www.instagram.com/financemagnates
🐦 X: https://x.com/financemagnates
🎥 TikTok: https://www.tiktok.com/tag/financemagnates
▶️ YouTube: /@financemagnates_official
#HolaPrime #PropFirm #Trading #FinanceMagnates #Forex #FuturesTrading #TradingReview #PropFirmReview
Axi Winner Spotlight 🏆 | Global Most Innovative Broker 2025 #Innovation #Trading #Fintech #Broker
Axi Winner Spotlight 🏆 | Global Most Innovative Broker 2025 #Innovation #Trading #Fintech #Broker
Axi Winner Spotlight 🏆 | Global Most Innovative Broker 2025 #Innovation #Trading #Fintech #Broker
Axi Winner Spotlight 🏆 | Global Most Innovative Broker 2025 #Innovation #Trading #Fintech #Broker
Axi Winner Spotlight 🏆 | Global Most Innovative Broker 2025 #Innovation #Trading #Fintech #Broker
Axi Winner Spotlight 🏆 | Global Most Innovative Broker 2025 #Innovation #Trading #Fintech #Broker
Axi takes the spotlight at the Finance Magnates Awards, winning Global Most Innovative Broker 2025.
Olivia Xenofontos and Ivanna Openko share how the team will feel: proud, motivated, and ready to keep delivering.
They also describe the night as well-organized, focused, and enjoyable for all.
👉 Be part of FM Awards 2026.
Recognition that matters.
Built on transparency.
Driven by the industry.
The Finance Magnates Awards 2026.
Nominations are now open.
🔗 https://awards.financemagnates.com/?utm_source=SM&utm_medium=social&utm_campaign=recognition-matters
Recognition that matters.
Built on transparency.
Driven by the industry.
The Finance Magnates Awards 2026.
Nominations are now open.
🔗 https://awards.financemagnates.com/?utm_source=SM&utm_medium=social&utm_campaign=recognition-matters
Recognition that matters.
Built on transparency.
Driven by the industry.
The Finance Magnates Awards 2026.
Nominations are now open.
🔗 https://awards.financemagnates.com/?utm_source=SM&utm_medium=social&utm_campaign=recognition-matters
Recognition that matters.
Built on transparency.
Driven by the industry.
The Finance Magnates Awards 2026.
Nominations are now open.
🔗 https://awards.financemagnates.com/?utm_source=SM&utm_medium=social&utm_campaign=recognition-matters
Recognition that matters.
Built on transparency.
Driven by the industry.
The Finance Magnates Awards 2026.
Nominations are now open.
🔗 https://awards.financemagnates.com/?utm_source=SM&utm_medium=social&utm_campaign=recognition-matters
Recognition that matters.
Built on transparency.
Driven by the industry.
The Finance Magnates Awards 2026.
Nominations are now open.
🔗 https://awards.financemagnates.com/?utm_source=SM&utm_medium=social&utm_campaign=recognition-matters