Bitcoin trades at $90,630 on January 11, 2026, breaking below the 50-week moving average for the first time since October 2023.
According to my weekly chart analysis, Bitcoin may test the 200-week EMA at $68,00, representing a potential 25% decline from current levels.
Crypto influencers James Wynn, Brannigan Barrett, and coko.nad back bearish targets between $64,000-$68,000.
Why Bitcoin is going down today? Let's check current BTC price technical analysis and forecasts
Bitcoin (BTC)
trades at $90,605 today (Sunday), January 11, 2026, attempting a modest 0.24%
rebound after experiencing five consecutive days of declines. The world's
largest cryptocurrency remains trapped in a prolonged consolidation pattern,
down approximately 28% from its October 2025 all-time high of $126,198. While
many investors ask why Bitcoin is going down, the answer lies in critical
technical breakdowns that point toward significantly lower prices ahead. Potentially
$68,000 to $74,000 according to my weekly chart analysis.
In this article, I explain why Bitcoin is falling and
why it could drop by another 25%. Check out my technical analysis of the
BTC/USDT chart, based on more than a decade of experience as a trader and
analyst.
Why Bitcoin Is Falling? Weekly
Chart Technical Breakdown
How Bitcoin looks on the daily timeframe. Source: Tradingview.com
For a fresh
perspective, I decided to look at a slightly broader interval, namely the
weekly chart, which brings interesting observations from a technical analysis
point of view.
As I show
on the weekly chart, we see exactly the same consolidation pattern and support
zone defined by April 2025 lows between $78,000 and $74,000. As a
reminder, $74,000
is my bearish target that
I have mentioned many times in recent weeks, where I expect reaccumulation
after weak hands are shaken out and a return to growth.
However,
the weekly chart reveals that this $74,000 zone could significantly expand when
looking at local peaks drawn from March to July 2024. According to my
analysis, the $68,000 level particularly catches my attention, representing
the July 2024 highs, which currently coincides with the 200-week
exponential moving average, which price last tested nearly three years ago.
Breaking above it was the official start of the uptrend that pushed Bitcoin's
price from $23,000 to $123,000.
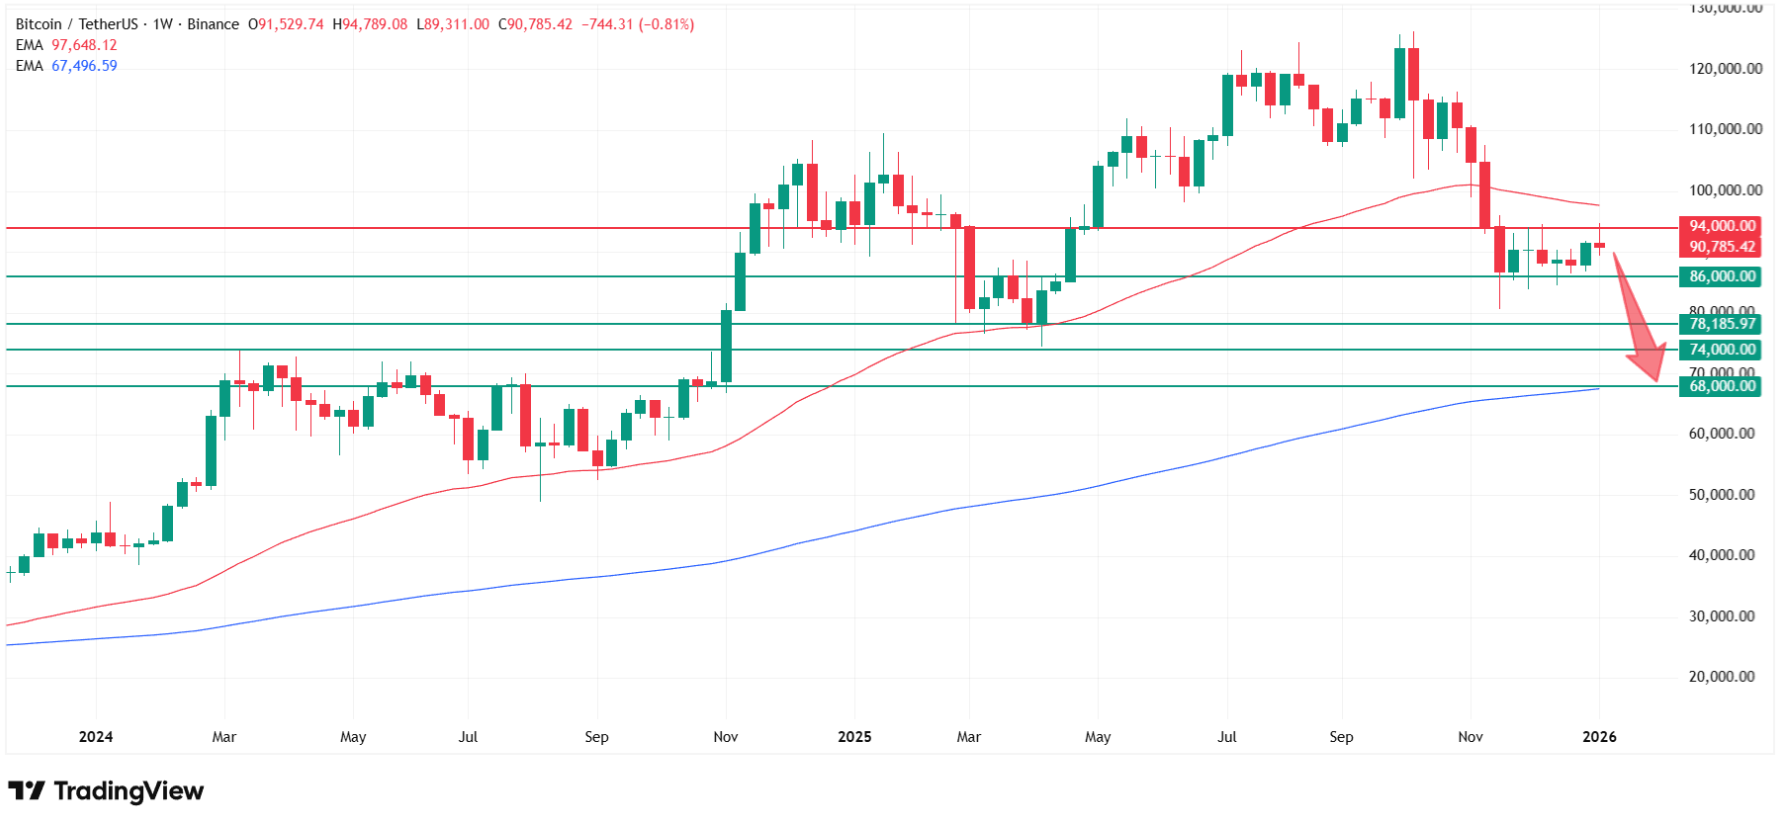
The fact
that we dropped below the 50-week moving average for the first time since
October 2023 also gives much to think about and suggests that price may again head
toward the longer-term 200-week average I mentioned. This would expand my
bearish target nominally by $6,000, meaning Bitcoin could fall 25% from
current levels to test the $68,000 zone.
How low can Bitcoin go? We are targeting the 200 WMA. Source: Tradingview.com
Extended target: $68,000 (July 2024 highs
+ 200-week EMA confluence)
Potential
decline: 25% from current $90,605 levels
Support zone expansion: March-July 2024 local
peaks create $68K-$78K band
The
200-week exponential moving average represents a critical historical support
level. Three years ago, when Bitcoin reclaimed this moving average, it marked
the beginning of a massive rally from bear market lows around $23,000 all the
way to the October 2025 all-time high of $126,198.
Major
corrections typically revisit these long-term moving averages to reset
sentiment and create sustainable foundations for the next bull phase.
If
you found this Bitcoin technical analysis valuable, follow me on X
(Twitter) @ChmielDk for real-time market updates,
in-depth crypto analysis, and trading insights.
Crypto Influencers Back
$64K-$68K Bitcoin Predictions
My weekly
chart analysis showing $68,000-$74,000 downside targets isn't an isolated
bearish view. Several prominent crypto influencers and traders have recently
published remarkably similar predictions, creating an emerging consensus around
major support in the mid-to-high $60,000 range.
James Wynn published
a prescient call on December 17, 2025: "$67,000 $BTC. 200 day moving
average on the weekly there. Said it since $120k. That's the next major support
channel. You have to hit them to have that 'flush' / 'reset'. - Wynn"
His $67,000
target aligns almost perfectly with my $68,000 extended support zone at the
200-week EMA.
Brannigan
Barrett also provided detailed bearish analysis on January 8, 2026, noting
current price action weakness: "BTC price action continues with weak
efforts to bounce. This is not a market to be long. As I mentioned last
year, $68k is likely to be tested. This is the 24' election
breakout. Sentiment remains sour and is confirmed by the markets inability to
bounce, despite being oversold."
BTC price action continues with weak efforts to bounce. This is not a market to be long. As I mentioned last year. $68k is likely to be tested. This is the 24' election breakout. Sentiment remains sour and is confirmed by the markets inability to bounce-despite being oversold.… pic.twitter.com/6XlKUbWvyp
Barrett's
$68,000 target matches my extended support analysis precisely, referencing the
2024 election breakout level that now serves as major historical support. His
timeline suggests several more weeks of consolidation before the eventual
breakdown toward $68,000.
Perhaps the
most detailed bearish roadmap comes from coko.nad, who outlined a multi-stage
decline scenario on January 5, 2026: "Now, changed my mind about Bitcoin.
I am now expecting $98K - $99K. Then hard crash to $77K. Horizontal and no-vol
phase between $77K - $83K. Then, drop to $64K - $66K. Here is 1.5-2 month
plan."
Why Bitcoin Can Fall
Further? Fundamental Headwinds
Beyond
technical analysis, several fundamental factors support the thesis that Bitcoin
is going down and has further to decline before bottoming.
Macro Environment Remains
Challenging
Despite the
Federal Reserve cutting interest rates by 175 basis points cumulatively over
2024-2025, bringing the target range to 3.50-3.75%, monetary conditions remain
restrictive for risk assets. The dollar has strengthened against major
currencies, creating headwinds for dollar-denominated assets like Bitcoin.
Equity markets show stretched valuations with ongoing concerns about artificial
intelligence investment sustainability, factors that typically pressure Bitcoin
given its high correlation to risk-on assets.
Market Structure
Deterioration
Institutional
forecasts showing BTC hitting only $150K in 2026 reflect growing caution among
sophisticated market participants. Digital Asset Treasury (DAT) companies that
accumulated massive Bitcoin holdings during 2024-2025 have largely exhausted
their buying power as valuations became unsupportive of additional capital
raises.
Technical Necessity of
Deeper Correction
From a pure
technical perspective, Bitcoin's failure to test the 200-week EMA for nearly
three years represents an anomaly. Historically, major bull markets experience
periodic corrections to long-term moving averages that serve as "trend
separators" between bull and bear market conditions.
How Low Can Bitcoin Go?
$68K-$74K Target Zone
According
to my technical analysis, Bitcoin's downside targets break into two distinct
levels:
Primary target: $74,000
Represents April 2025 yearly
lows last tested during spring correction
Initial reaccumulation zone
where weak hands begin capitulating
17.5%
decline from current $90,605 levels
First major test of whether
buyers defend 2025 lows
Extended target: $68,000
July 2024 local highs now
serving as support
Coincides with 200-week
exponential moving average (untested for three years)
Historical significance as
launchpad for $23,000-$123,000 rally
24.9% decline from current
levels (25% round-number correction)
Likely triggers maximum
capitulation and final flush
As I show
on the weekly chart, the $68,000 level represents convergence of multiple
technical factors: July 2024 resistance-turned-support, the critical 200-week
EMA, and March-July 2024 consolidation peaks. This confluence creates a
high-probability zone for trend reversal after capitulation.
What Happens at $68K-$74K
Support?
Based on
historical precedent and market cycle dynamics, the expected scenario at major
support involves:
Phase 1 - Initial test ($74,000): Brief stabilization as some buyers defend
April 2025 lows, followed by breakdown as selling pressure overwhelms demand
Phase 2 - Acceleration ($74K → $68K): Rapid decline as stop-losses trigger and
leveraged positions liquidate, creating panic selling
Phase 3 - Capitulation ($68,000): Maximum fear and weak hand exits at
200-week EMA, creating classic "V-bottom" or extended base formation
Phase 4 - Reaccumulation: Institutional buyers and long-term holders accumulate aggressively
at attractive valuations, absorbing selling pressure
Phase 5 - Recovery: Return to growth as technical structure improves, moving averages
reclaim, and momentum shifts bullish
This
process typically takes several weeks to months, suggesting Q1 2026 correction
followed by Q2 2026 reaccumulation and potential Q3-Q4 2026 return to all-time
high territory.
FAQ: Why Bitcoin Is Going
Down
Why is Bitcoin going down
today?
Bitcoin is
declining due to breakdown below the 50-week moving average for the first time
since October 2023, weak bounce attempts despite oversold conditions, and
technical targeting of the 200-week EMA at $68,000. According to my weekly
chart analysis, current consolidation suggests continuation toward
$68,000-$74,000 support zone where reaccumulation is expected.
How low can Bitcoin go in
2026?
According
to my technical analysis, Bitcoin targets $74,000 (April 2025 lows) with
extended support at $68,000 (July 2024 highs + 200-week EMA), representing
potential 25% decline from current $90,605 levels. coko.nad predicts even lower
targets of $64,000-$66,000 in 1.5-2 month scenario, while James Wynn targets
$67,000 and Brannigan Barrett expects $68,000 test.
Will Bitcoin crash to
$60,000?
My primary
targets are $74,000 and $68,000 based on weekly chart support confluence and
200-week EMA location. coko.nad's $64,000-$66,000 scenario represents deeper
extension beyond 200-week EMA but remains within historical correction ranges.
Sub-$60,000 would require breakdown of all major 2024 support levels, which
seems unlikely based on current technical structure.
When will Bitcoin stop
falling?
According
to my analysis, significant support and reaccumulation expected at
$68,000-$74,000 zone where 200-week EMA and April 2025/July 2024 historical
levels converge. Brannigan Barrett suggests "continue consolidation range
between 80-94k for a few more weeks" before breakdown, while coko.nad
outlines 1.5-2 month timeline to final lows. Expect capitulation and reversal
in Q1 2026.
Is this a Bitcoin bear
market?
Breaking
below 50-week MA (first since October 2023) signals correction phase rather
than full bear market. According to my weekly chart analysis, testing 200-week
EMA at $68,000 is necessary for trend reset and healthy market structure.
Expect reaccumulation at major support before growth resumes, similar to
historical patterns where 200-week EMA tests marked bottoms before major
rallies.
Bitcoin (BTC)
trades at $90,605 today (Sunday), January 11, 2026, attempting a modest 0.24%
rebound after experiencing five consecutive days of declines. The world's
largest cryptocurrency remains trapped in a prolonged consolidation pattern,
down approximately 28% from its October 2025 all-time high of $126,198. While
many investors ask why Bitcoin is going down, the answer lies in critical
technical breakdowns that point toward significantly lower prices ahead. Potentially
$68,000 to $74,000 according to my weekly chart analysis.
In this article, I explain why Bitcoin is falling and
why it could drop by another 25%. Check out my technical analysis of the
BTC/USDT chart, based on more than a decade of experience as a trader and
analyst.
Why Bitcoin Is Falling? Weekly
Chart Technical Breakdown
How Bitcoin looks on the daily timeframe. Source: Tradingview.com
For a fresh
perspective, I decided to look at a slightly broader interval, namely the
weekly chart, which brings interesting observations from a technical analysis
point of view.
As I show
on the weekly chart, we see exactly the same consolidation pattern and support
zone defined by April 2025 lows between $78,000 and $74,000. As a
reminder, $74,000
is my bearish target that
I have mentioned many times in recent weeks, where I expect reaccumulation
after weak hands are shaken out and a return to growth.
However,
the weekly chart reveals that this $74,000 zone could significantly expand when
looking at local peaks drawn from March to July 2024. According to my
analysis, the $68,000 level particularly catches my attention, representing
the July 2024 highs, which currently coincides with the 200-week
exponential moving average, which price last tested nearly three years ago.
Breaking above it was the official start of the uptrend that pushed Bitcoin's
price from $23,000 to $123,000.
The fact
that we dropped below the 50-week moving average for the first time since
October 2023 also gives much to think about and suggests that price may again head
toward the longer-term 200-week average I mentioned. This would expand my
bearish target nominally by $6,000, meaning Bitcoin could fall 25% from
current levels to test the $68,000 zone.
How low can Bitcoin go? We are targeting the 200 WMA. Source: Tradingview.com
Extended target: $68,000 (July 2024 highs
+ 200-week EMA confluence)
Potential
decline: 25% from current $90,605 levels
Support zone expansion: March-July 2024 local
peaks create $68K-$78K band
The
200-week exponential moving average represents a critical historical support
level. Three years ago, when Bitcoin reclaimed this moving average, it marked
the beginning of a massive rally from bear market lows around $23,000 all the
way to the October 2025 all-time high of $126,198.
Major
corrections typically revisit these long-term moving averages to reset
sentiment and create sustainable foundations for the next bull phase.
If
you found this Bitcoin technical analysis valuable, follow me on X
(Twitter) @ChmielDk for real-time market updates,
in-depth crypto analysis, and trading insights.
Crypto Influencers Back
$64K-$68K Bitcoin Predictions
My weekly
chart analysis showing $68,000-$74,000 downside targets isn't an isolated
bearish view. Several prominent crypto influencers and traders have recently
published remarkably similar predictions, creating an emerging consensus around
major support in the mid-to-high $60,000 range.
James Wynn published
a prescient call on December 17, 2025: "$67,000 $BTC. 200 day moving
average on the weekly there. Said it since $120k. That's the next major support
channel. You have to hit them to have that 'flush' / 'reset'. - Wynn"
His $67,000
target aligns almost perfectly with my $68,000 extended support zone at the
200-week EMA.
Brannigan
Barrett also provided detailed bearish analysis on January 8, 2026, noting
current price action weakness: "BTC price action continues with weak
efforts to bounce. This is not a market to be long. As I mentioned last
year, $68k is likely to be tested. This is the 24' election
breakout. Sentiment remains sour and is confirmed by the markets inability to
bounce, despite being oversold."
BTC price action continues with weak efforts to bounce. This is not a market to be long. As I mentioned last year. $68k is likely to be tested. This is the 24' election breakout. Sentiment remains sour and is confirmed by the markets inability to bounce-despite being oversold.… pic.twitter.com/6XlKUbWvyp
Barrett's
$68,000 target matches my extended support analysis precisely, referencing the
2024 election breakout level that now serves as major historical support. His
timeline suggests several more weeks of consolidation before the eventual
breakdown toward $68,000.
Perhaps the
most detailed bearish roadmap comes from coko.nad, who outlined a multi-stage
decline scenario on January 5, 2026: "Now, changed my mind about Bitcoin.
I am now expecting $98K - $99K. Then hard crash to $77K. Horizontal and no-vol
phase between $77K - $83K. Then, drop to $64K - $66K. Here is 1.5-2 month
plan."
Why Bitcoin Can Fall
Further? Fundamental Headwinds
Beyond
technical analysis, several fundamental factors support the thesis that Bitcoin
is going down and has further to decline before bottoming.
Macro Environment Remains
Challenging
Despite the
Federal Reserve cutting interest rates by 175 basis points cumulatively over
2024-2025, bringing the target range to 3.50-3.75%, monetary conditions remain
restrictive for risk assets. The dollar has strengthened against major
currencies, creating headwinds for dollar-denominated assets like Bitcoin.
Equity markets show stretched valuations with ongoing concerns about artificial
intelligence investment sustainability, factors that typically pressure Bitcoin
given its high correlation to risk-on assets.
Market Structure
Deterioration
Institutional
forecasts showing BTC hitting only $150K in 2026 reflect growing caution among
sophisticated market participants. Digital Asset Treasury (DAT) companies that
accumulated massive Bitcoin holdings during 2024-2025 have largely exhausted
their buying power as valuations became unsupportive of additional capital
raises.
Technical Necessity of
Deeper Correction
From a pure
technical perspective, Bitcoin's failure to test the 200-week EMA for nearly
three years represents an anomaly. Historically, major bull markets experience
periodic corrections to long-term moving averages that serve as "trend
separators" between bull and bear market conditions.
How Low Can Bitcoin Go?
$68K-$74K Target Zone
According
to my technical analysis, Bitcoin's downside targets break into two distinct
levels:
Primary target: $74,000
Represents April 2025 yearly
lows last tested during spring correction
Initial reaccumulation zone
where weak hands begin capitulating
17.5%
decline from current $90,605 levels
First major test of whether
buyers defend 2025 lows
Extended target: $68,000
July 2024 local highs now
serving as support
Coincides with 200-week
exponential moving average (untested for three years)
Historical significance as
launchpad for $23,000-$123,000 rally
24.9% decline from current
levels (25% round-number correction)
Likely triggers maximum
capitulation and final flush
As I show
on the weekly chart, the $68,000 level represents convergence of multiple
technical factors: July 2024 resistance-turned-support, the critical 200-week
EMA, and March-July 2024 consolidation peaks. This confluence creates a
high-probability zone for trend reversal after capitulation.
What Happens at $68K-$74K
Support?
Based on
historical precedent and market cycle dynamics, the expected scenario at major
support involves:
Phase 1 - Initial test ($74,000): Brief stabilization as some buyers defend
April 2025 lows, followed by breakdown as selling pressure overwhelms demand
Phase 2 - Acceleration ($74K → $68K): Rapid decline as stop-losses trigger and
leveraged positions liquidate, creating panic selling
Phase 3 - Capitulation ($68,000): Maximum fear and weak hand exits at
200-week EMA, creating classic "V-bottom" or extended base formation
Phase 4 - Reaccumulation: Institutional buyers and long-term holders accumulate aggressively
at attractive valuations, absorbing selling pressure
Phase 5 - Recovery: Return to growth as technical structure improves, moving averages
reclaim, and momentum shifts bullish
This
process typically takes several weeks to months, suggesting Q1 2026 correction
followed by Q2 2026 reaccumulation and potential Q3-Q4 2026 return to all-time
high territory.
FAQ: Why Bitcoin Is Going
Down
Why is Bitcoin going down
today?
Bitcoin is
declining due to breakdown below the 50-week moving average for the first time
since October 2023, weak bounce attempts despite oversold conditions, and
technical targeting of the 200-week EMA at $68,000. According to my weekly
chart analysis, current consolidation suggests continuation toward
$68,000-$74,000 support zone where reaccumulation is expected.
How low can Bitcoin go in
2026?
According
to my technical analysis, Bitcoin targets $74,000 (April 2025 lows) with
extended support at $68,000 (July 2024 highs + 200-week EMA), representing
potential 25% decline from current $90,605 levels. coko.nad predicts even lower
targets of $64,000-$66,000 in 1.5-2 month scenario, while James Wynn targets
$67,000 and Brannigan Barrett expects $68,000 test.
Will Bitcoin crash to
$60,000?
My primary
targets are $74,000 and $68,000 based on weekly chart support confluence and
200-week EMA location. coko.nad's $64,000-$66,000 scenario represents deeper
extension beyond 200-week EMA but remains within historical correction ranges.
Sub-$60,000 would require breakdown of all major 2024 support levels, which
seems unlikely based on current technical structure.
When will Bitcoin stop
falling?
According
to my analysis, significant support and reaccumulation expected at
$68,000-$74,000 zone where 200-week EMA and April 2025/July 2024 historical
levels converge. Brannigan Barrett suggests "continue consolidation range
between 80-94k for a few more weeks" before breakdown, while coko.nad
outlines 1.5-2 month timeline to final lows. Expect capitulation and reversal
in Q1 2026.
Is this a Bitcoin bear
market?
Breaking
below 50-week MA (first since October 2023) signals correction phase rather
than full bear market. According to my weekly chart analysis, testing 200-week
EMA at $68,000 is necessary for trend reset and healthy market structure.
Expect reaccumulation at major support before growth resumes, similar to
historical patterns where 200-week EMA tests marked bottoms before major
rallies.
Damian Chmiel is a Senior Analyst & Editor at Finance Magnates with more than 15 years of experience in the CFD and online trading industry. Active as both a trader and journalist since 2010, he focuses on broker coverage, fintech innovation, and regulatory developments across Europe, the Middle East, and Asia.
His work includes interviews with C-level leaders at major brokerages and fintech platforms, as well as co-authoring Finance Magnates’ quarterly industry benchmarking reports. Damian’s reporting is data-driven, market-aware, and grounded in direct industry engagement. His analysis and commentary have also been cited by external media outlets, including Investing.com, Binance, The Asset, Stockhead, and Dispatch.
Education:
MA in Finance and Accounting, Cracow University of Economics
Citi Cuts Bitcoin and Ethereum Price Predictions, But Those BTC and ETH Charts Go Even Lower
Featured Videos
Fintech Education Explained: How Finance Magnates Academy Helps You Build a Career
Fintech Education Explained: How Finance Magnates Academy Helps You Build a Career
Fintech Education Explained: How Finance Magnates Academy Helps You Build a Career
Fintech Education Explained: How Finance Magnates Academy Helps You Build a Career
What does it take to build a successful career in fintech?
In this exclusive interview, Dora Christofi, Head of Marketing at Finance Magnates, sits down with Jeff Patterson, Head of Education at Finance Magnates Academy, to discuss why fintech education has become more important than ever.
They explore how Finance Magnates Academy is helping students, professionals, career changers, HR teams, and fintech companies build practical industry knowledge through expert-led courses and recognised certifications.
In this interview:
✅ Why fintech needs specialised education
✅ The difference between theory and practical learning
✅ How Finance Magnates Academy prepares professionals for real careers
✅ The value of industry-recognised certifications
✅ How companies can improve employee onboarding and training
✅ What's coming next for Finance Magnates Academy
Whether you're looking to start a career in fintech, grow within the financial services industry, or improve your team's onboarding process, this conversation offers valuable insights from one of the industry's leading education initiatives.
Learn more about Finance Magnates Academy:
👉 https://academy.financemagnates.com
About Finance Magnates Academy
Finance Magnates Academy provides practical fintech education through expert-led courses, professional certifications, and corporate training. Designed for individuals and organisations, the Academy helps professionals build real-world skills across brokerage operations, trading, compliance, payments, financial markets, and fintech.
Connect with Finance Magnates
🌐 Website: https://www.financemagnates.com
🔗 LinkedIn: https://www.linkedin.com/company/finance-magnates
📺 Subscribe for more interviews, market insights, and fintech education.
#Fintech #FintechEducation #FinanceMagnates #FintechCareers #FinancialServices #CorporateTraining #OnlineLearning #FintechTraining
The FX & CFD Market Is Changing Fast. Here's What's Coming Next (2026)
The FX & CFD Market Is Changing Fast. Here's What's Coming Next (2026)
The FX & CFD Market Is Changing Fast. Here's What's Coming Next (2026)
The FX & CFD Market Is Changing Fast. Here's What's Coming Next (2026)
The FX & CFD Market Is Changing Fast. Here's What's Coming Next (2026)
The FX & CFD Market Is Changing Fast. Here's What's Coming Next (2026)
Where is the FX & CFD industry really heading in 2026?
In this free Finance Magnates Intelligence masterclass, industry experts explore the latest data shaping the global FX & CFD market, how regulation and regional demand influence expansion planning, and how brokerages benchmark performance across 265 firms on the FM Intelligence Portal.
In this session you'll learn:
✔ Where the FX/CFD industry is heading in H2 2026
✔ Why compliance should guide regional expansion decisions
✔ How internal performance compares when benchmarked against 265 brokers
✔ Regional demand shifts across Europe, APAC, and LATAM
✔Broker volume rankings, verification, and FM Intelligence Portal data
Speakers:
• Ramzi Ahmad, Director of Intelligence, Finance Magnates
• Sylwester Majewski, Head of Insights & Reporting Hub, Finance Magnates
• Philios Petrides, Data & Business Intelligence Consultant
If you work in brokerage, fintech, compliance, business development or market strategy, this session offers practical insights backed by verified industry data.
Access the FM Intelligence Portal at: https://datalab.financemagnates.com/
🔔 Subscribe to Finance Magnates for more webinars, interviews and market intelligence covering the global online trading industry.
#FinanceMagnates #FX #CFD #Fintech #Trading #Brokerage #MarketIntelligence #RegTech #Compliance #Forex
How Finance Leaders Adapt to Change | iFX EXPO
How Finance Leaders Adapt to Change | iFX EXPO
How Finance Leaders Adapt to Change | iFX EXPO
How Finance Leaders Adapt to Change | iFX EXPO
How Finance Leaders Adapt to Change | iFX EXPO
How Finance Leaders Adapt to Change | iFX EXPO
Markets never stop changing.
We asked finance executives for their number one success tip, and many came back to the same idea: adapt, stay informed and keep looking ahead.
Featuring executives from Shift Markets, Letknow Pay, Base Markets and SPAYZ.io.
#FinanceMagnates #Leadership #BusinessStrategy #Fintech #Shorts
FM Daily Brief – 20 July 2026
FM Daily Brief – 20 July 2026
FM Daily Brief – 20 July 2026
FM Daily Brief – 20 July 2026
FM Daily Brief – 20 July 2026
FM Daily Brief – 20 July 2026
Today's Monday, the 20th of July 2026, and these are our main stories: two brokers surpass the two-trillion-dollar monthly trading volume mark, Asic posts a record year for civil penalties, and Jump Trading expands its prediction markets team.
Today's Monday, the 20th of July 2026, and these are our main stories: two brokers surpass the two-trillion-dollar monthly trading volume mark, Asic posts a record year for civil penalties, and Jump Trading expands its prediction markets team.
Today's Monday, the 20th of July 2026, and these are our main stories: two brokers surpass the two-trillion-dollar monthly trading volume mark, Asic posts a record year for civil penalties, and Jump Trading expands its prediction markets team.
Today's Monday, the 20th of July 2026, and these are our main stories: two brokers surpass the two-trillion-dollar monthly trading volume mark, Asic posts a record year for civil penalties, and Jump Trading expands its prediction markets team.
Today's Monday, the 20th of July 2026, and these are our main stories: two brokers surpass the two-trillion-dollar monthly trading volume mark, Asic posts a record year for civil penalties, and Jump Trading expands its prediction markets team.
Today's Monday, the 20th of July 2026, and these are our main stories: two brokers surpass the two-trillion-dollar monthly trading volume mark, Asic posts a record year for civil penalties, and Jump Trading expands its prediction markets team.
4 Finance Leaders Share Their Best Career Advice | iFX EXPO
4 Finance Leaders Share Their Best Career Advice | iFX EXPO
4 Finance Leaders Share Their Best Career Advice | iFX EXPO
4 Finance Leaders Share Their Best Career Advice | iFX EXPO
4 Finance Leaders Share Their Best Career Advice | iFX EXPO
4 Finance Leaders Share Their Best Career Advice | iFX EXPO
What advice has had the biggest impact on your career?
We asked four finance executives to share their number one success tip.
From perseverance to curiosity, their answers offer four different perspectives on building a successful career.
#FinanceMagnates #CareerAdvice #Leadership #Fintech #Shorts
What advice has had the biggest impact on your career?
We asked four finance executives to share their number one success tip.
From perseverance to curiosity, their answers offer four different perspectives on building a successful career.
#FinanceMagnates #CareerAdvice #Leadership #Fintech #Shorts
What advice has had the biggest impact on your career?
We asked four finance executives to share their number one success tip.
From perseverance to curiosity, their answers offer four different perspectives on building a successful career.
#FinanceMagnates #CareerAdvice #Leadership #Fintech #Shorts
What advice has had the biggest impact on your career?
We asked four finance executives to share their number one success tip.
From perseverance to curiosity, their answers offer four different perspectives on building a successful career.
#FinanceMagnates #CareerAdvice #Leadership #Fintech #Shorts
What advice has had the biggest impact on your career?
We asked four finance executives to share their number one success tip.
From perseverance to curiosity, their answers offer four different perspectives on building a successful career.
#FinanceMagnates #CareerAdvice #Leadership #Fintech #Shorts
What advice has had the biggest impact on your career?
We asked four finance executives to share their number one success tip.
From perseverance to curiosity, their answers offer four different perspectives on building a successful career.
#FinanceMagnates #CareerAdvice #Leadership #Fintech #Shorts