Bitcoin (BTC) price crashed to $95,722 on Friday, November 14, 2025, marking a six-month low and representing a 24% decline from its October all-time high of $126,296. The sharp selloff accelerated as optimism from the U.S. government reopening faded and December Federal Reserve rate cut odds collapsed from 97% to just 52%, triggering over $1.3 billion in forced liquidations across cryptocurrency markets.
In this article, I answer the question why Bitcoin is falling, how low can BTC price go and why the newest Bitcoin price prediction suggests that we may witness another 30% collapse.
Why Bitcoin Is Going Down? Government Relief Fades as Rate Cut Hopes Crumble
Bitcoin's descent accelerated after Tuesday's brief rally above $107,000 failed to hold, with the cryptocurrency now down nearly 9% week-to-date despite momentarily reclaiming that level earlier this week. The broader decline mirrors weakness across growth-sensitive assets as traders reassess the macroeconomic landscape following diminished expectations for monetary easing.

"Bitcoin's sharp decline accelerated as relief from the U.S. government reopening faded and the odds of a December rate cut fell sharply," explains Samer Hasn, Senior Market Analyst at XS.com. "The token is effectively mirroring the drawdown in stock market and other growth-sensitive assets, with deleveraging pushing long liquidations higher and reducing buyers' willingness to defend key levels."
This combination creates an environment where shorts take control more easily, leaving prices vulnerable to sharper downside pressure. Bitcoin opened Friday's session at $99,610 before plunging to an intraday low of $94,456, with the day's high barely touching $99,836.
$100K Breakdown Signals Bear Control
The psychological $100,000 level has proven critical in determining near-term market direction. Arkadiusz Jóżwiak, Editor-in-Chief at Comparic.pl, warns that the breakdown below this threshold sends a clear message about shifting market dynamics.

“Breaking below $100,000 is a clear signal that bears are taking control, at least in the short term. At this point we have support ahead at $94-92K, and if this gets broken, then there's a risk of further, much deeper depreciation toward April lows around $74,000,” Jóźwiak predicted. “In the long term, however, I remain a bull and assume that even if Bitcoin drops that low, or lower, it will ultimately bounce back and return to ATH and higher.”
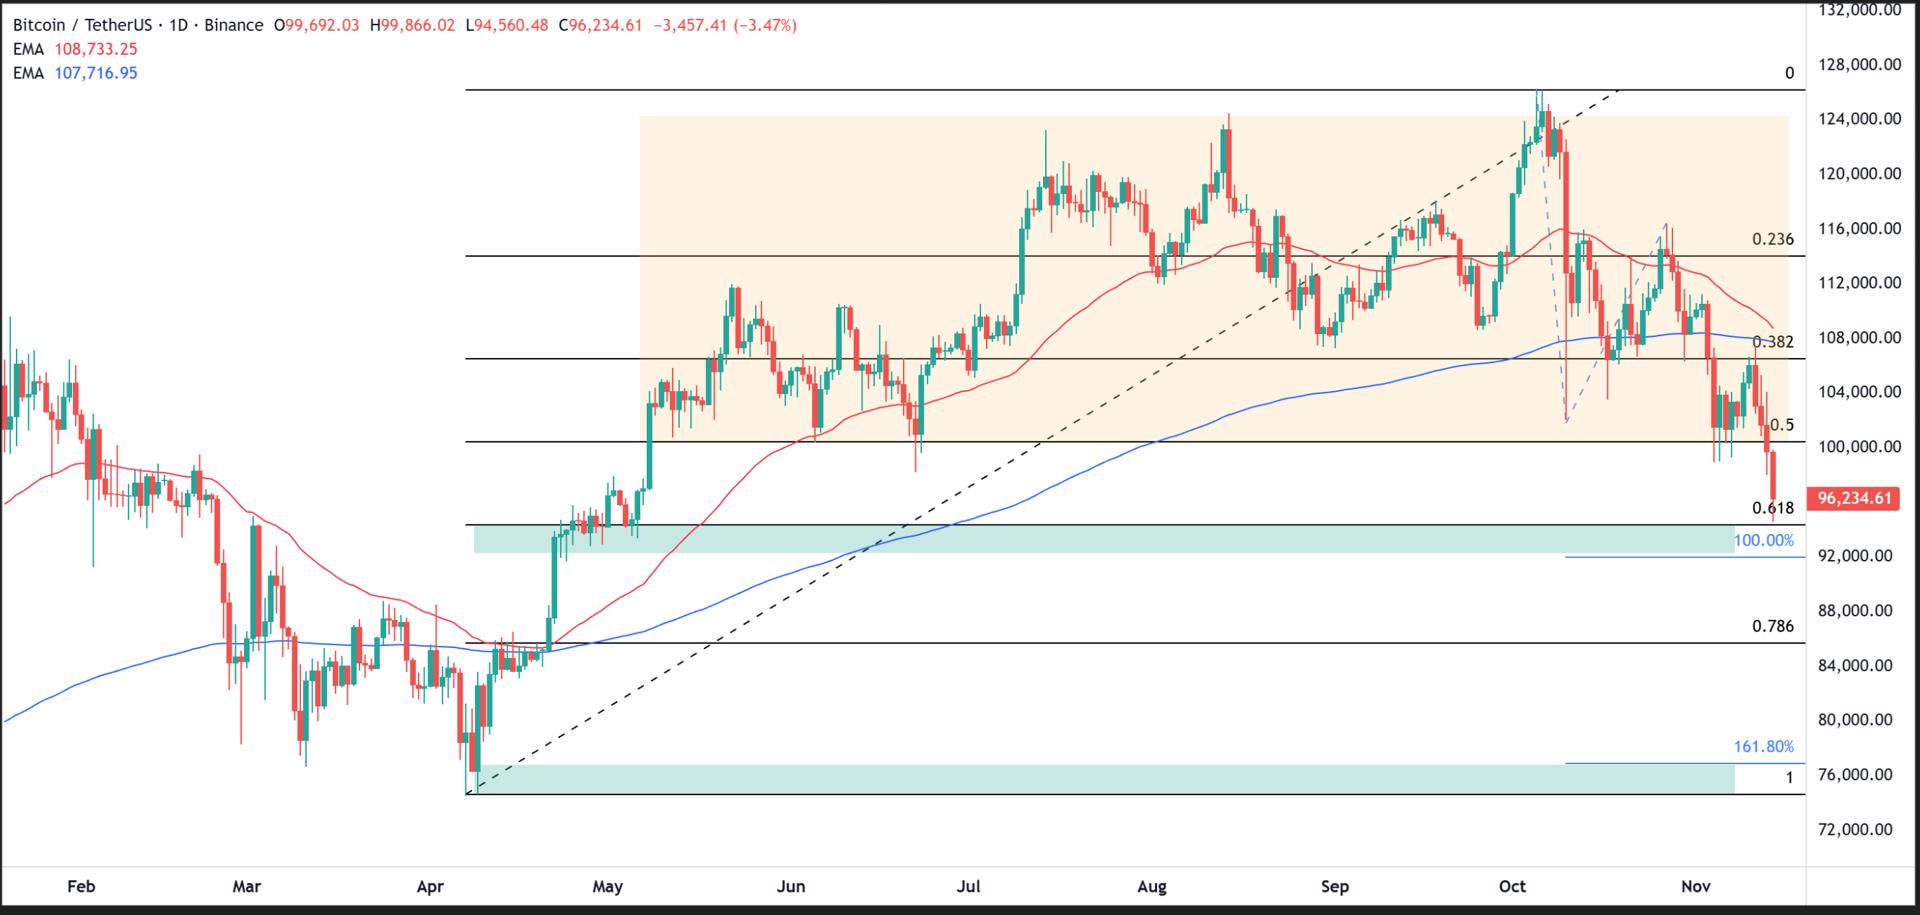
The $94,000-$92,000 support zone represents the next critical battleground for Bitcoin bulls. If this level fails to hold, technical analysts warn of significantly deeper depreciation toward April's lows around $74,000, a scenario that would represent roughly a 50% correction from recent peaks. It also coincides with my own previous Bitcoin price analysis based on the Fibonacci extensions.
Market data reveals Bitcoin's 50-week exponential moving average currently intersects at $101,285, a level the cryptocurrency must reclaim with a weekly close to preserve its bullish market structure. Trading at $95,722, Bitcoin would need to surge over 6.8% just to regain this technical threshold.
Bitcoin Price Prediction: 30% Crash Warning from Technical Analyst
TraderJonesy, a technical analyst from X, has issued a stark warning about Bitcoin's trajectory, predicting a 30% crash that "nobody sees coming". His SuperTrend indicator flipped red near $117,000 in mid-August, successfully calling the entire decline and avoiding the massive drawdown that followed.
- How Low Can Bitcoin Go? This New BTC Price Prediction Suggests Death Cross May Push it 30% Down to $74,000
- Why Crypto Is Going Down? Bitcoin, XRP, Ethereum and Dogecoin Prices Crash as Market Loses $1 Trillion
- Why Bitcoin Is Down: Price Slips Below $100,000 for First Time Since June
"Bitcoin is about to crash 30% and nobody sees it," TraderJonesy declared, pointing to a structure of lower highs and lower lows that's "about to flush below $100K". His system identifies the next major buy zone near the 200-week moving average around $70,000, suggesting significant downside remains before accumulation opportunities emerge.
The analyst dismisses optimism surrounding government stimulus or traditional four-year cycles as false hope. "The Moonboys still think the government reopening or stimulus talk is going to save crypto. They think the four-year cycle is magically different this time. It's not," he stated. His trend signals remain bearish, with tools that have been red since $117,000 now pointing toward the $70,000 region as the ultimate target.
Critical BTC Support Levels to Watch
Technical analysis reveals several key price zones that will determine whether Bitcoin stabilizes or continues its descent toward deeper support levels:
- Resistance levels: $100,000-$101,285 (psychological barrier and 50-week EMA), $107,000 (Tuesday's failed breakout), $117,000 (August SuperTrend flip zone)
- Support levels: $94,000-$92,000 (immediate critical support), $88,772 (mid-term technical floor), $74,000 (April 2025 lows), $70,000 (200-week MA and TraderJonesy's ultimate target)
Analyst Rekt Capital notes that Bitcoin has formed clusters of lower lows at the 50-week EMA region over the past six weeks following its rejection above $126,000 in October. While this pattern has historically preceded notable Bitcoin price gains—similar formations between June-September 2024 eventually led to moves from $51,000 to above $107,000—the near-term technical picture remains decidedly bearish.
Market Outlook and Recovery Scenarios
Despite the carnage, Bitcoin remains up approximately 4-5% year-to-date and has surged 28.6% over the past 12 months from $74,421—though these gains pale compared to the recent 24% collapse from all-time highs. The cryptocurrency's year-low sits at $74,421, a level that now represents major downside risk if current support zones fail.
The path forward depends heavily on several factors: whether the Federal Reserve delivers a December rate cut, how quickly Bitcoin can reclaim the psychological $100,000 level, and whether institutional buyers return after the recent $870 million in ETF outflows. Arkadiusz Jóżwiak maintains a long-term bullish stance despite near-term bearishness, suggesting that even a drop to $74,000 or lower would ultimately reverse with Bitcoin returning to all-time highs and beyond.
However, in the immediate term, momentum clearly favors sellers. Bitcoin needs to establish higher lows and reclaim key moving averages to shift sentiment, while failure at current levels opens the door to TraderJonesy's $70,000 target, a scenario that would inflict devastating losses on leveraged long positions and test the resolve of even long-term holders.
Bitcoin Price Analysis, FAQ
Why is BTC price down today?
Bitcoin crashed to $95,722 on November 14, 2025, down 3.9% on the day and nearly 9% week-to-date, as optimism from the U.S. government reopening faded and December Fed rate cut odds collapsed from 97% to 52%.
Can Bitcoin drop below $90K?
Yes. Bitcoin dropping below $90,000 is a realistic possibility if current support at $94,000-$92,000 fails to hold. Technical analysts warn that breakdown below this zone opens the door to much deeper declines toward April's lows around $74,000, with TraderJonesy's SuperTrend system targeting the 200-week moving average near $70,000.
Is this the start of a Bitcoin crash?
Yes. Bitcoin has already experienced a significant crash, plunging 24% from its October all-time high of $126,296 to $95,722, a six-month low. Technical analyst TraderJonesy warns of an additional 30% decline to $70,000, stating "Bitcoin is about to crash 30% and nobody sees it" based on his SuperTrend indicator that flipped red at $117,000 in August.
What's the BTC price forecast for 2025?
Bitcoin price forecasts for 2025 vary dramatically based on near-term technical outcomes. In the short term, analysts identify critical support at $94,000-$92,000, with breakdown scenarios targeting $88,772, then $74,000 (April lows), and ultimately $70,000 according to TraderJonesy's 200-week MA projection. For recovery scenarios, Bitcoin must reclaim $100,000-$101,285 (the 50-week EMA) to preserve bullish market structure and potentially challenge the October all-time high of $126,296.