

Gold has just delivered one of the most powerful runs in its modern history, and the key questions now are how high gold can go, and whether gold will hit $5,000 per ounce. The yellow metal is still in a clear uptrend, even after setting fresh all-time highs and pulling back slightly.
Over the past year gold surged about 65%, and in the first three weeks of 2026 it has already added roughly 12%, briefly testing the $4,888 area per ounce and setting new historical records. Today, on Thursday 22 January 2026, gold is only slightly lower, trading around $4,827 dollars, which in my technical view looks far more like a pause inside a structural bull market than the start of a top.
In this article, I examine the XAU/USD chart and explain why the new gold price forecast from Goldman Sachs points to a target of $5,400 per ounce.
Why Gold Is Going Up?
At the core, why gold is going up comes down to three overlapping forces:
- structural demand,
- macro hedging,
- strong technical uptrend that keeps attracting trend followers.
From a fundamental side, a major global investment bank – Goldman Sachs - has just raised its end‑2026 gold price forecast from $4,900 to $5,400 per ounce, explicitly citing private‑sector and emerging‑market central bank diversification into gold as the main driver.
The bank assumes these private diversification buyers, who hedge “global policy risks” and have driven the upside surprise, will not liquidate in 2026, which effectively lifts the whole path of its price profile.
At the same time, it expects Western ETF holdings to increase as the Federal Reserve cuts rates and sees central bank purchases averaging around 60 tonnes in 2026, as reserve managers continue shifting out of pure dollar exposure and into bullion.
That institutional view matches how professional market analysts describe the current phase. Rania Gule, Senior Market Analyst at XS.com MENA calls this a “delicate phase” that reflects a fragile balance between geopolitical, economic and monetary factors, yet stresses that gold has managed to recover early‑year dips and hold above $4,800 dollars, even approaching $4,925 dollars despite a slowdown in momentum.
In her view, this is not a mere short‑term spike but a sign that investors increasingly see gold as a strategic asset to be bought on dips, even when the classic safe‑haven narrative is temporarily less intense.
Gold Technical Analysis: Support Levels and Trend
On my chart, the message is straightforward: gold is in a strong, dynamic uptrend, and recent price action fits cleanly into a bullish structure.
Gold has temporarily met resistance around $4,850, but underneath that ceiling sits an entire ladder of supports that can absorb a technical correction. The first short‑term support on my chart is the gap area around $4,650 between Tuesday’s and Wednesday’s sessions. Slightly lower, I mark $4,550 as the next key level – the zone of highs tested at the end of December and earlier in October.
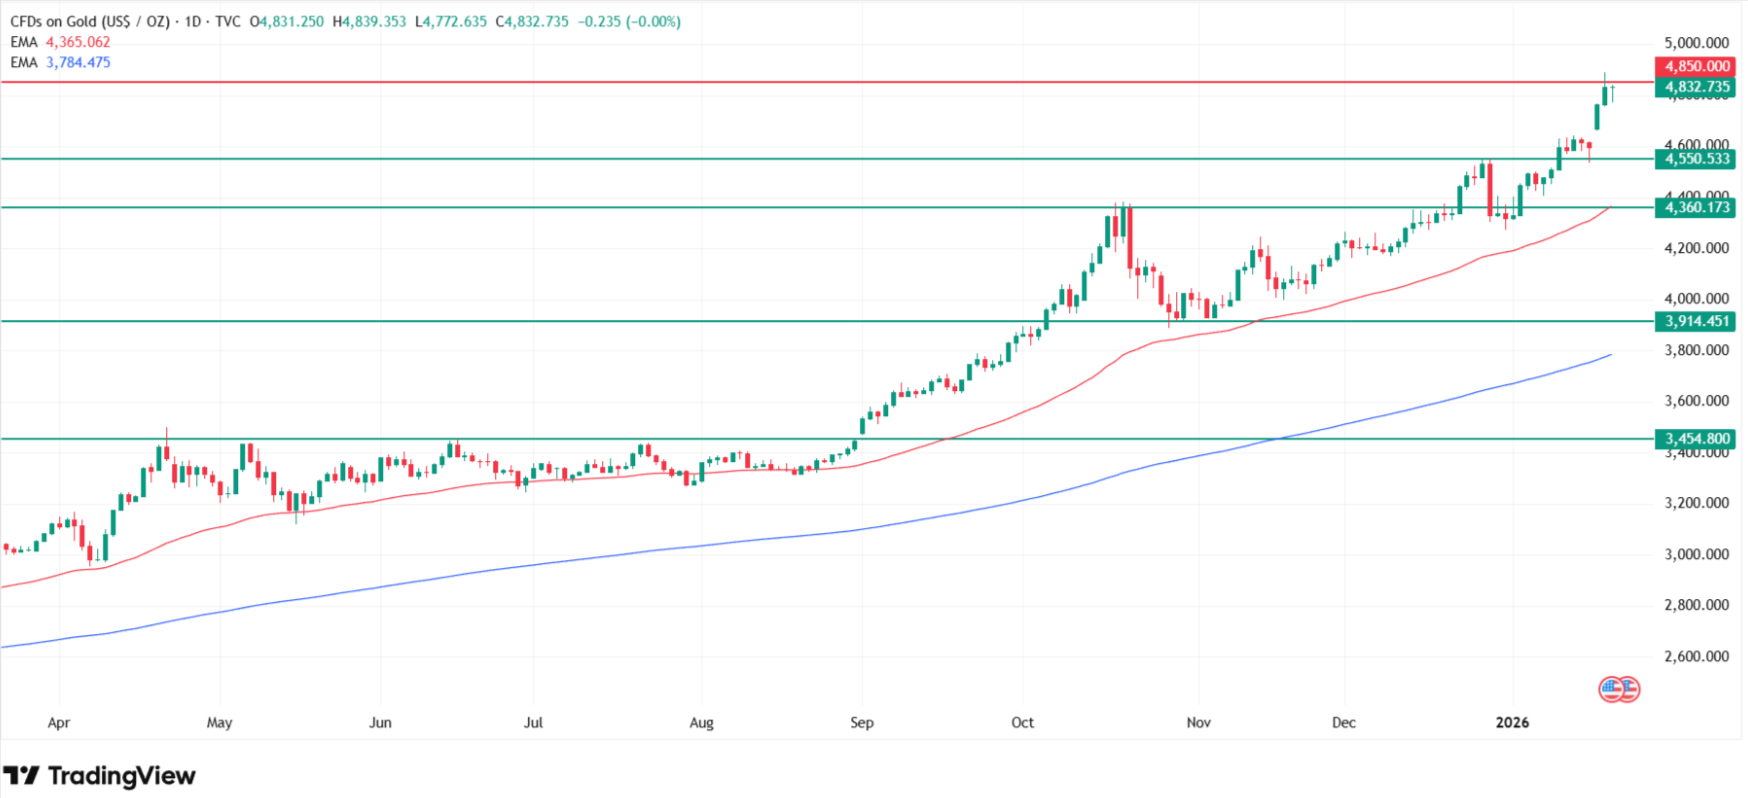
The main support zone for me right now is around $4,360, where price currently overlaps with the 50‑day exponential moving average. This is the area I consider the primary defense line for the existing uptrend.
If that $4,360 region were to break cleanly, my analysis points toward a deeper pullback into the $3,900–4,000 band per ounce, a psychologically important round area that also coincides with the volatility envelopes drawn around price in early November.
Below that, my chart shows the 200‑day moving average near $3,800 , which is the classic line separating a bull market from a bear market. This means that, in theory, gold has quite a lot of room to correct lower without breaking its structural uptrend: the metal could fall several hundred dollars, find support around the 200‑day line, and still be technically bullish.
If, and only if, that $3,800 region failed, the next historical support would sit near $3,450, the old resistance zone that capped rallies for months between April and August of last year.
Despite this space for correction, I remain a structural bull on the gold chart. In my view, deeper and sustained declines below those major supports are unlikely. And even if a sharp flush occurred, it would probably be just that, a temporary washout of excessive speculation and leveraged longs, and an opportunity to re‑enter at more attractive prices.
What H4 Says About the Gold Trend?
Zooming into the medium‑term picture, the intraday structure also supports the bullish case. Looking at gold on a four‑hour chart, Łukasz Stefanik, a financial analyst at XTB, sees a “very strong, dynamic uptrend”, noting that price has broken above prior highs and even exceeded the 161.8% extension of the last corrective decline.
The latest upward impulse pushed gold into the $4,880–4,890 zone, where the first more serious supply reaction appeared, but this leg is clearly larger than previous corrections – a classic sign that the demand side still dominates.
Using an Overbalance‑style approach, the key conclusion is that as long as gold holds above the lower boundary of the 1:1 geometry around $4,641 and the nearby support zone around $4,680, the base scenario remains continuation of the uptrend.
How High Can Gold Go – And Will It Hit 5,000?
The raised forecast from Goldman Sachs – $5,400 per ounce by the end of 2026 – provides a concrete fundamental anchor. Their scenario assumes that:
- Private‑sector diversification buyers continue to hedge global policy risks using gold and do not liquidate en masse in 2026.
- Western gold ETFs start to rebuild holdings as the Federal Reserve cuts rates, reducing the carry cost of holding bullion.
- Emerging‑market central banks keep buying around 60 tonnes per month, further tightening the physical market.
In other words, my gold price prediction for the current cycle is that gold does hit $5,000 per ounce, and that the $5,400 area outlined in the investment bank’s 2026 forecast is a reasonable, if ambitious, extension of the current trend.
The path is unlikely to be straight; corrections into the 4,650–4,360 corridor would be normal, but the structural drivers and the chart both point higher.
Please also check the previous gold price articles written by me:
- Why Gold Is Surging Today? Metal Rises With Bitcoin Price as U.S. Advances Shutdown Deal, Keeping Price Predictions Bullish
- Gold Price Prediction from Bank of America Eyes $5,000 Amid New Record Today
- Why Gold Is Surging With Silver and Why Experts Predict $6,000 Price in 2026
Gold Price Roadmap for 2026
Putting it all together, the gold price prediction from my perspective looks like this:
- Short term: Gold is consolidating beneath resistance around $4,850–4,900 after an explosive rally. As long as price holds above $4,680–4,641, the base case is a continuation of the uptrend, with shallow corrections being bought.
- Correction zones on my chart: First supports sit around $4,650 (gap area) and $4,550 (December/October highs). Deeper but still healthy corrections would target $4,360 (50‑day EMA, my main support) and then the $3,900–4,000 band. The $3,800 area (200‑day MA) is the structural bull/bear line; $3,450 is the last‑ditch historical floor.
- Upside potential: Provided those key supports hold, my base case is that gold tests 5,000 dollars in this cycle and, in line with the 5,400 institutional target, can stretch further if central banks and private hedgers maintain their current pace of buying and the Fed delivers rate cuts.
In short, why gold is going up is that it has become a strategic macro hedge in a world of policy uncertainty, and how high gold can go is now framed not by 2,000 or 3,000 but by 5,000 and beyond.
According to my technical analysis, the trend is still clearly up, support layers are well defined, and the combination of technicals and institutional forecasts makes a $5,000–5,400 scenario for 2026 entirely credible.
FAQ: Gold Price Prediction 2026
Why is gold price going up today?
Gold is going up due to structural demand from central banks, private-sector diversification hedging global policy risks, and anticipated Federal Reserve rate cuts. Goldman Sachs raised its end-2026 gold price forecast to $5,400 per ounce, citing that private diversification buyers "hedge global policy risks and have driven the upside surprise" and will not liquidate in 2026.
How high can gold go?
According to my technical analysis and Goldman Sachs forecast, gold can reach $5,400 dollars per ounce by end-2026. My gold price prediction expects $5,000 to be tested mid-year as the Fed cuts rates by 50 basis points and emerging-market central banks maintain 60 tonnes per month buying pace.
Will gold hit 5,000 per ounce?
Yes, gold will hit $5,000 per ounce in my view. I remain a structural bull on the gold chart and view any pullback toward $4,650-4,360 as a buying opportunity before testing $5,000.
What is the gold price forecast for 2026?
My gold price forecast for 2026: test of $5,000 mid-year, potential move to $5,400 by year-end per Goldman Sachs target.


