Gold dropped 2.6% to $4,911, and silver crashed 4% to $74 on February 17, 2026, testing recovery levels just two weeks after the historic crash.
ANZ Bank raised its gold forecast to $5,800 per ounce for Q2 2026, citing central bank buying and structural support.
Why gold price and silver price are falling today? Let's check XAU and XAG charts
Gold prices
tumbled over 2.5% on Tuesday, February 17, 2026, with silver falling by a
steeper 4% margin, marking the weakest levels in 11 days as both metals test
critical support zones following their brief recovery from the catastrophic
January 31 selloff.
The yellow
metal drew intraday lows at $4,858 before recovering slightly to trade at
$4,911 per ounce, while silver crashed below $73 during Asian hours before
stabilizing around $74. This renewed weakness comes despite ANZ Bank's
upgraded forecast projecting gold will reach $5,800 per ounce
in Q2 2026, up from their previous $5,400 target.
Follow
me on X for more gold and silver market analysis: @ChmielDk
Why Gold And Silver Are
Going Down Today?
Recovery Tested After
Historic Crash
February 17
marks a critical test for precious metals bulls. After staging a powerful
recovery from the January 31 crash lows, gold and silver are retesting
support levels that could determine whether the correction deepens or
the bull market resumes.
Gold peaked
at $5,608 on January 30, then crashed to $4,745 the next day before recovering
to the $4,750-4,800 range by February 2. The metal traded as high as $5,120 on
February 11, suggesting the worst was over. But Tuesday's selloff pushed gold
back toward $4,850, down 2.6% intraday, raising questions about whether another
leg down is imminent.
Gold's
Current Price Action:
Current:
$4,911 per ounce
Intraday
low: $4,858 (Feb 17)
Recent
high: $5,120 (Feb 11)
Key
support: $4,850-4,600
Resistance:
$5,000-5,100
Silver's Current Price Action:
Current:
$74 per ounce
Intraday
low: Under $73 (Feb 17)
Recent
recovery high: $83 (Feb 2)
Key
support: $70, then $55
Resistance:
$80, then $100-120
Despite the
renewed weakness, gold remains up 6.5% over the past month and
a remarkable 67% year-over-year. Silver still shows monthly gains of 4% and
annual returns exceeding 155%, underscoring that this remains a secular bull
market experiencing violent corrections rather than a trend reversal.
Dilin Wu,
Research Strategist at Pepperstone, notes: "If short-term bears
dominate, the lower boundary of the February upward channel near $4,900, and
further down at $4,640, may provide support. Conversely, a sustained
break above $5,100 could open the way toward $5,180-$5,200, representing key
resistance levels before challenging new highs."
Technical Analysis:
Critical Support Tested
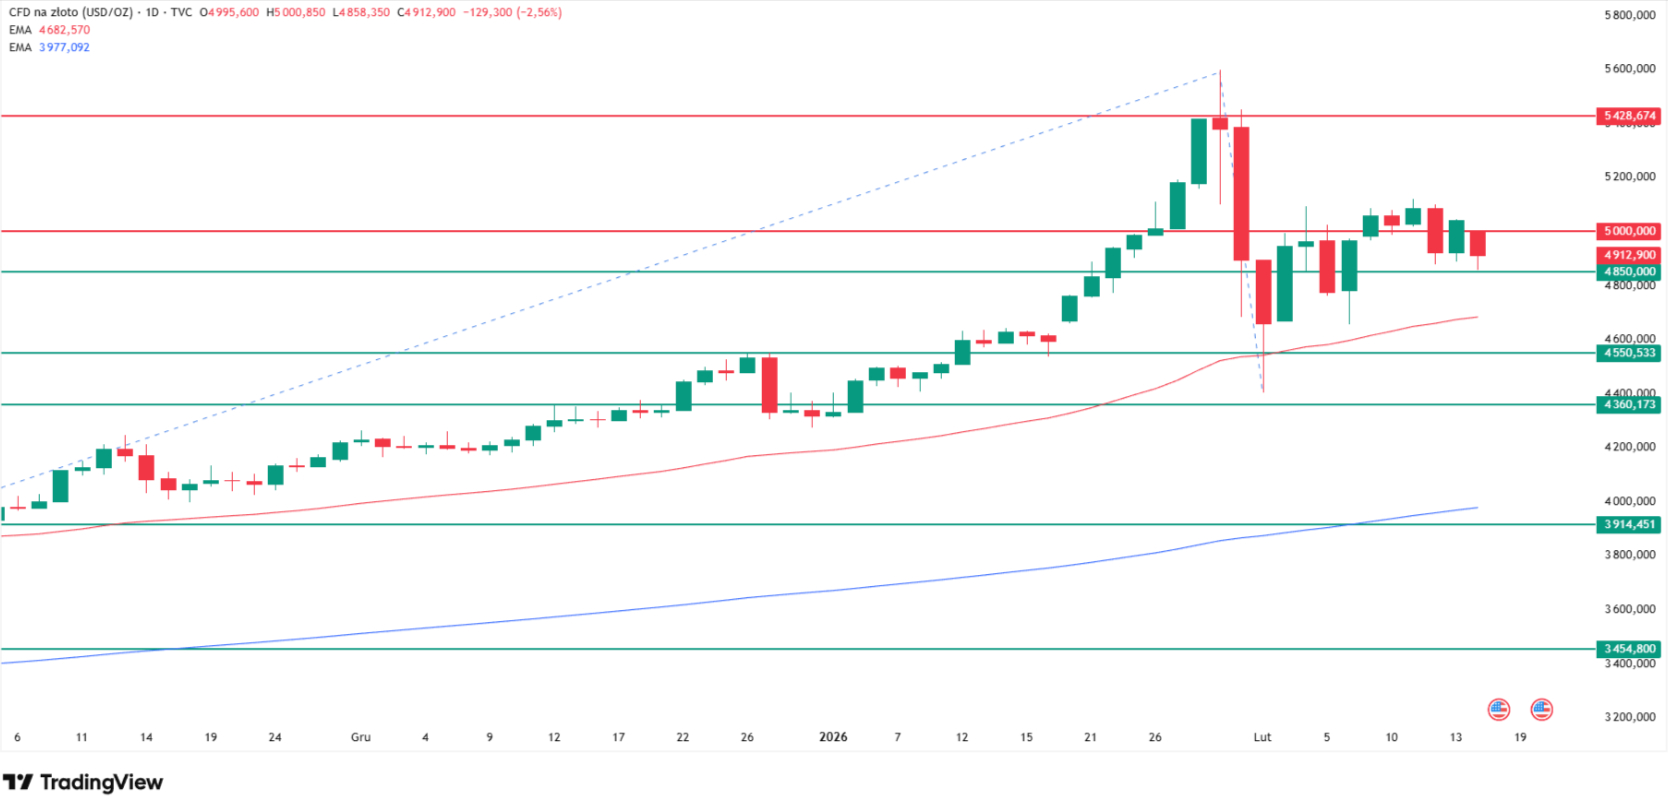
Gold's Chart Setup
Gold's
price action on February 17 shows the metal falling 2.6% with intraday lows at $4,858 before
recovering to trade slightly above $4,911 per ounce. The price is moving within
a support zone between $4,850-$4,900, marked by the psychological
$5,000 level above and critical support at $4,600 below.
According
to my chart, the 50 exponential moving average (50 EMA) has
been tested multiple times since the January 31 crash, with gold bouncing off
this level on February 2 before rallying to $5,120 on February 11. Tuesday's
weakness brings the metal back toward this critical technical level, which
could determine the next directional move.
Why gold is going down today? Source: Tradingview.com
Key
support levels include
the current $4,850-4,900 zone, followed by $4,640 (identified
by Pepperstone's Dilin Wu as highly important), and then the major support zone
at $3,900-4,000 where the 200 EMA and November 2025 lows
converge.
On the
upside, resistance sits at $5,000-5,100, with a sustained break
above that level potentially opening the path toward $5,180-5,200 before
challenging the January 30 all-time high of $5,608. The trend
remains officially bullish based on long-term moving average alignment, meaning
any moves down to support should be treated as buying opportunities for those
betting on a return to higher levels.
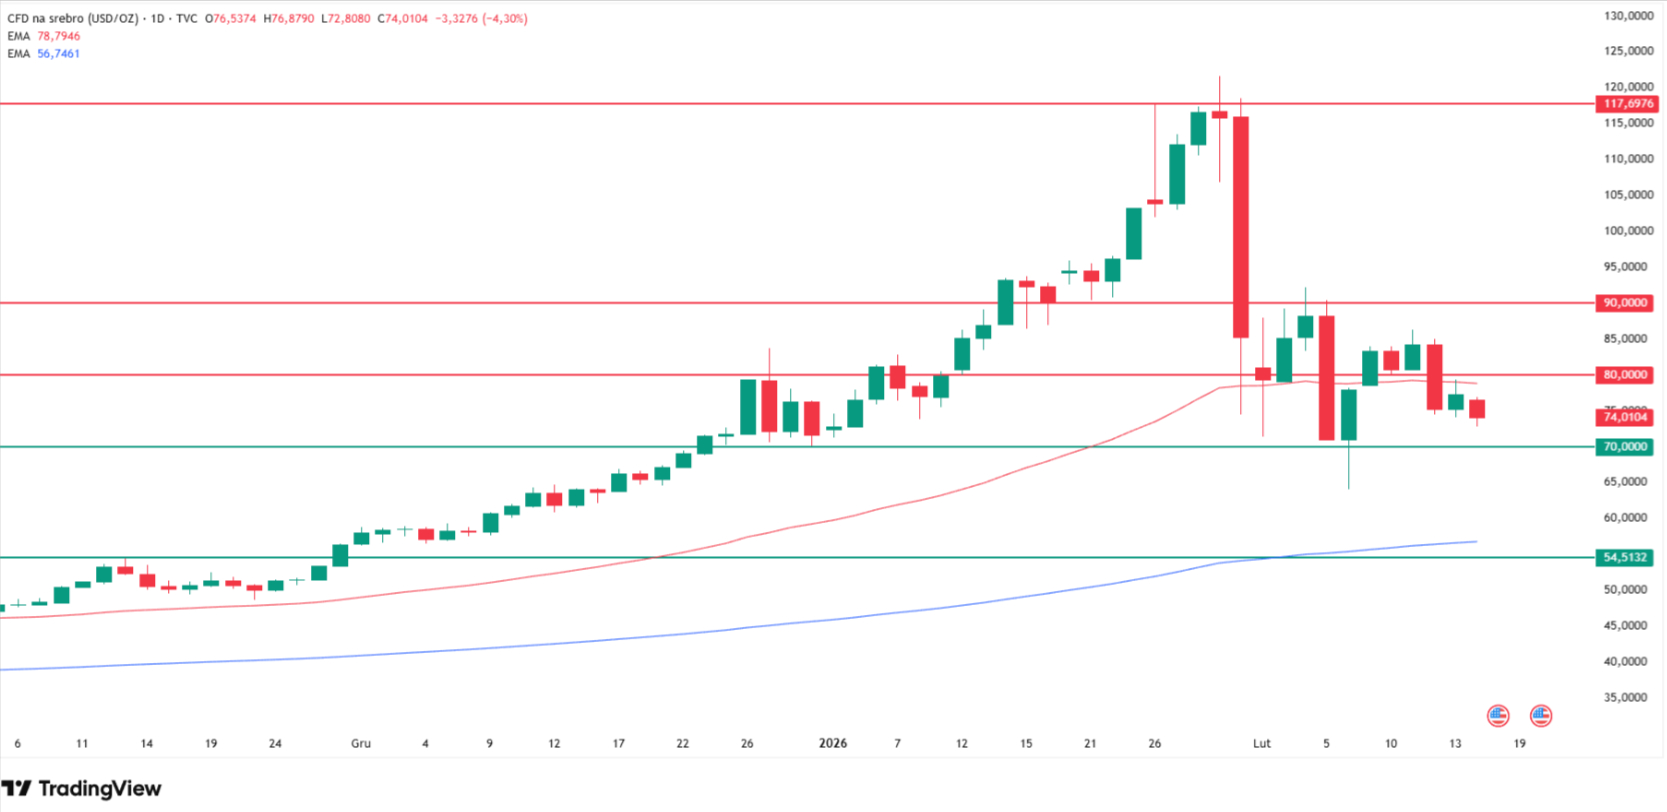
Silver's Volatile Pattern
Silver's
chart shows even more dramatic swings. According to my technical analysis, the
white metal is down over 4% on February 17, testing lows under $73 per ounce
(11-day lows) before recovering slightly to trade around $74. Direct
support sits at the round $70 level, while major support lies at $55 where
the 200 EMA currently resides.
This $55
level coincides with historical highs from October 2024, making it a critical
zone for bulls to defend if selling pressure intensifies. A break below $55
would signal bears have significantly shifted the balance of power on the
chart.
Why silver is going down today? Source: Tradingview.com
Resistance
for silver is found at $80 (the 50 EMA, which is positioned
horizontally since late January), with the next barrier at the round
$100 level and ultimately historical highs above $120 tested
in late January. The long-term trend remains bullish based on the 200 EMA
slope, meaning pullbacks to support zones should theoretically attract buyers
looking to position for the next leg higher.
If
Tuesday's session closes near current levels without further deterioration, silver will add another lower wick
to recent price action, potentially forming a base from which to launch the
next rally phase. But a close below $70 would raise concerns that another
violent leg down could be in progress.
Gold Price Prediction: ANZ
Raises Forecast to $5,800 Target for Q2 2026
While
traders panic over daily price swings, ANZ Bank upgraded its gold
forecast on February 13, projecting the metal will reach $5,800
per ounce in Q2 2026, up from the previous $5,400 target. This represents
18% upside from current levels and suggests the bank views recent weakness as a
buying opportunity rather than a trend change.
ANZ
analysts Soni Kumari and Daniel Hynes emphasized that "the rally
is not yet mature enough to reverse anytime soon." They argue the
backdrop for gold in 2026 differs fundamentally from previous peak periods in
1980 and 2013.
The key
differences: easy U.S. monetary policy, escalating geopolitical
tensions, ongoing policy uncertainty, and a weakening dollar create an
environment where appetite for diversification is intensifying. Unlike past
peaks that ended in sustained bear markets, current structural factors suggest
dips should be bought.
"We
believe gold remains an insurance asset against a plethora of
uncertainties, and the recent correction presents an opportunity for fresh
investment," the ANZ team wrote. They noted that market focus is
increasingly turning to potential tariff effects, which haven't yet shown up in
economic or inflation data but pose significant risks.
In the
meantime, Congressman
and Liberty Report host Ron Paul maintains his ultra-bullish
long-term forecast that many dismissed as extreme when first announced.
In a
January 27 interview with The David Lin Report, just days before the crash,
Paul warned: "The fiat monetary system is dying" and
predicted gold
could reach $20,000 or even $100,000 as the dollar
collapses and trust in currency evaporates.
Gold and Silver Price
Analysis FAQ
Why are gold and silver
falling today?
Gold fell
2.6% to $4,911 and silver crashed 4% to $74 on February 17, 2026, testing
recovery levels reached after the historic January 31 crash. The renewed
weakness comes despite ANZ Bank raising its Q2 2026 gold forecast to $5,800,
suggesting markets remain nervous about Kevin Warsh's Fed Chair nomination and
potential monetary policy tightening.
What is the gold price
forecast for 2026?
ANZ Bank
upgraded its gold price forecast to $5,800 per ounce for Q2 2026, up from the
previous $5,400 target. The bank views recent corrections as buying
opportunities rather than trend reversals, citing easy monetary policy,
geopolitical tensions, ongoing uncertainty, and a weakening dollar as
structural support factors that differ from previous peak periods in 1980 and
2013.
Will gold and silver
continue falling?
Technical
analysis shows gold testing critical support at $4,850-$4,900 with key levels
at $4,640 (Pepperstone's Dilin Wu calls this "highly important") and
$3,900-$4,000 (200 EMA zone). Silver is testing $70-$74 support with major
support at $55. Central bank buying (755+ tonnes expected in 2026) provides a
structural floor, while Ron Paul maintains $20,000-$100,000 long-term targets
based on fiat system collapse thesis.
Is this a good time to buy
gold and silver?
Both metals
are testing support levels after violent corrections (gold from $5,608 to
$4,850, silver from $122 to $74). ANZ characterizes this as an
"opportunity for fresh investment" with $5,800 upside target.
However, extreme volatility persists with multi-percent daily swings. Central
bank buying at 755+ tonnes annually and industrial silver demand (680 million
ounces) provide structural support, but bears could push prices lower if $4,600
gold and $70 silver break.
Gold prices
tumbled over 2.5% on Tuesday, February 17, 2026, with silver falling by a
steeper 4% margin, marking the weakest levels in 11 days as both metals test
critical support zones following their brief recovery from the catastrophic
January 31 selloff.
The yellow
metal drew intraday lows at $4,858 before recovering slightly to trade at
$4,911 per ounce, while silver crashed below $73 during Asian hours before
stabilizing around $74. This renewed weakness comes despite ANZ Bank's
upgraded forecast projecting gold will reach $5,800 per ounce
in Q2 2026, up from their previous $5,400 target.
Follow
me on X for more gold and silver market analysis: @ChmielDk
Why Gold And Silver Are
Going Down Today?
Recovery Tested After
Historic Crash
February 17
marks a critical test for precious metals bulls. After staging a powerful
recovery from the January 31 crash lows, gold and silver are retesting
support levels that could determine whether the correction deepens or
the bull market resumes.
Gold peaked
at $5,608 on January 30, then crashed to $4,745 the next day before recovering
to the $4,750-4,800 range by February 2. The metal traded as high as $5,120 on
February 11, suggesting the worst was over. But Tuesday's selloff pushed gold
back toward $4,850, down 2.6% intraday, raising questions about whether another
leg down is imminent.
Gold's
Current Price Action:
Current:
$4,911 per ounce
Intraday
low: $4,858 (Feb 17)
Recent
high: $5,120 (Feb 11)
Key
support: $4,850-4,600
Resistance:
$5,000-5,100
Silver's Current Price Action:
Current:
$74 per ounce
Intraday
low: Under $73 (Feb 17)
Recent
recovery high: $83 (Feb 2)
Key
support: $70, then $55
Resistance:
$80, then $100-120
Despite the
renewed weakness, gold remains up 6.5% over the past month and
a remarkable 67% year-over-year. Silver still shows monthly gains of 4% and
annual returns exceeding 155%, underscoring that this remains a secular bull
market experiencing violent corrections rather than a trend reversal.
Dilin Wu,
Research Strategist at Pepperstone, notes: "If short-term bears
dominate, the lower boundary of the February upward channel near $4,900, and
further down at $4,640, may provide support. Conversely, a sustained
break above $5,100 could open the way toward $5,180-$5,200, representing key
resistance levels before challenging new highs."
Technical Analysis:
Critical Support Tested
Gold's Chart Setup
Gold's
price action on February 17 shows the metal falling 2.6% with intraday lows at $4,858 before
recovering to trade slightly above $4,911 per ounce. The price is moving within
a support zone between $4,850-$4,900, marked by the psychological
$5,000 level above and critical support at $4,600 below.
According
to my chart, the 50 exponential moving average (50 EMA) has
been tested multiple times since the January 31 crash, with gold bouncing off
this level on February 2 before rallying to $5,120 on February 11. Tuesday's
weakness brings the metal back toward this critical technical level, which
could determine the next directional move.
Why gold is going down today? Source: Tradingview.com
Key
support levels include
the current $4,850-4,900 zone, followed by $4,640 (identified
by Pepperstone's Dilin Wu as highly important), and then the major support zone
at $3,900-4,000 where the 200 EMA and November 2025 lows
converge.
On the
upside, resistance sits at $5,000-5,100, with a sustained break
above that level potentially opening the path toward $5,180-5,200 before
challenging the January 30 all-time high of $5,608. The trend
remains officially bullish based on long-term moving average alignment, meaning
any moves down to support should be treated as buying opportunities for those
betting on a return to higher levels.
Silver's Volatile Pattern
Silver's
chart shows even more dramatic swings. According to my technical analysis, the
white metal is down over 4% on February 17, testing lows under $73 per ounce
(11-day lows) before recovering slightly to trade around $74. Direct
support sits at the round $70 level, while major support lies at $55 where
the 200 EMA currently resides.
This $55
level coincides with historical highs from October 2024, making it a critical
zone for bulls to defend if selling pressure intensifies. A break below $55
would signal bears have significantly shifted the balance of power on the
chart.
Why silver is going down today? Source: Tradingview.com
Resistance
for silver is found at $80 (the 50 EMA, which is positioned
horizontally since late January), with the next barrier at the round
$100 level and ultimately historical highs above $120 tested
in late January. The long-term trend remains bullish based on the 200 EMA
slope, meaning pullbacks to support zones should theoretically attract buyers
looking to position for the next leg higher.
If
Tuesday's session closes near current levels without further deterioration, silver will add another lower wick
to recent price action, potentially forming a base from which to launch the
next rally phase. But a close below $70 would raise concerns that another
violent leg down could be in progress.
Gold Price Prediction: ANZ
Raises Forecast to $5,800 Target for Q2 2026
While
traders panic over daily price swings, ANZ Bank upgraded its gold
forecast on February 13, projecting the metal will reach $5,800
per ounce in Q2 2026, up from the previous $5,400 target. This represents
18% upside from current levels and suggests the bank views recent weakness as a
buying opportunity rather than a trend change.
ANZ
analysts Soni Kumari and Daniel Hynes emphasized that "the rally
is not yet mature enough to reverse anytime soon." They argue the
backdrop for gold in 2026 differs fundamentally from previous peak periods in
1980 and 2013.
The key
differences: easy U.S. monetary policy, escalating geopolitical
tensions, ongoing policy uncertainty, and a weakening dollar create an
environment where appetite for diversification is intensifying. Unlike past
peaks that ended in sustained bear markets, current structural factors suggest
dips should be bought.
"We
believe gold remains an insurance asset against a plethora of
uncertainties, and the recent correction presents an opportunity for fresh
investment," the ANZ team wrote. They noted that market focus is
increasingly turning to potential tariff effects, which haven't yet shown up in
economic or inflation data but pose significant risks.
In the
meantime, Congressman
and Liberty Report host Ron Paul maintains his ultra-bullish
long-term forecast that many dismissed as extreme when first announced.
In a
January 27 interview with The David Lin Report, just days before the crash,
Paul warned: "The fiat monetary system is dying" and
predicted gold
could reach $20,000 or even $100,000 as the dollar
collapses and trust in currency evaporates.
Gold and Silver Price
Analysis FAQ
Why are gold and silver
falling today?
Gold fell
2.6% to $4,911 and silver crashed 4% to $74 on February 17, 2026, testing
recovery levels reached after the historic January 31 crash. The renewed
weakness comes despite ANZ Bank raising its Q2 2026 gold forecast to $5,800,
suggesting markets remain nervous about Kevin Warsh's Fed Chair nomination and
potential monetary policy tightening.
What is the gold price
forecast for 2026?
ANZ Bank
upgraded its gold price forecast to $5,800 per ounce for Q2 2026, up from the
previous $5,400 target. The bank views recent corrections as buying
opportunities rather than trend reversals, citing easy monetary policy,
geopolitical tensions, ongoing uncertainty, and a weakening dollar as
structural support factors that differ from previous peak periods in 1980 and
2013.
Will gold and silver
continue falling?
Technical
analysis shows gold testing critical support at $4,850-$4,900 with key levels
at $4,640 (Pepperstone's Dilin Wu calls this "highly important") and
$3,900-$4,000 (200 EMA zone). Silver is testing $70-$74 support with major
support at $55. Central bank buying (755+ tonnes expected in 2026) provides a
structural floor, while Ron Paul maintains $20,000-$100,000 long-term targets
based on fiat system collapse thesis.
Is this a good time to buy
gold and silver?
Both metals
are testing support levels after violent corrections (gold from $5,608 to
$4,850, silver from $122 to $74). ANZ characterizes this as an
"opportunity for fresh investment" with $5,800 upside target.
However, extreme volatility persists with multi-percent daily swings. Central
bank buying at 755+ tonnes annually and industrial silver demand (680 million
ounces) provide structural support, but bears could push prices lower if $4,600
gold and $70 silver break.
Damian Chmiel is a Senior Analyst & Editor at Finance Magnates with more than 15 years of experience in the CFD and online trading industry. Active as both a trader and journalist since 2010, he focuses on broker coverage, fintech innovation, and regulatory developments across Europe, the Middle East, and Asia.
His work includes interviews with C-level leaders at major brokerages and fintech platforms, as well as co-authoring Finance Magnates’ quarterly industry benchmarking reports. Damian’s reporting is data-driven, market-aware, and grounded in direct industry engagement. His analysis and commentary have also been cited by external media outlets, including Investing.com, Binance, The Asset, Stockhead, and Dispatch.
Education:
MA in Finance and Accounting, Cracow University of Economics
Inside the Prediction Markets: Starting to Play by the Rules
Featured Videos
Tickmill Winner Spotlight | Broker of the Year 2025 (LATAM) 🏆 | Finance Magnates Awards #Trading
Tickmill Winner Spotlight | Broker of the Year 2025 (LATAM) 🏆 | Finance Magnates Awards #Trading
Tickmill Winner Spotlight | Broker of the Year 2025 (LATAM) 🏆 | Finance Magnates Awards #Trading
Tickmill Winner Spotlight | Broker of the Year 2025 (LATAM) 🏆 | Finance Magnates Awards #Trading
What helped Tickmill stand out this year?
In this Winner Spotlight, Johnny Khalil, Executive Director at Tickmill Europe, shares how listening closely to clients and delivering strong trading conditions made the difference.
A big thank you to the community whose support continues to drive progress every day.
👉 Think your brand has what it takes? Nominate for the 2026 Finance Magnates Awards: https://awards.financemagnates.com/#nominate
CMC Markets’ Artur Delijergijevs on Metals Demand, Volatility, & Stable Execution
CMC Markets’ Artur Delijergijevs on Metals Demand, Volatility, & Stable Execution
CMC Markets’ Artur Delijergijevs on Metals Demand, Volatility, & Stable Execution
CMC Markets’ Artur Delijergijevs on Metals Demand, Volatility, & Stable Execution
CMC Markets’ Artur Delijergijevs on Metals Demand, Volatility, & Stable Execution
CMC Markets’ Artur Delijergijevs on Metals Demand, Volatility, & Stable Execution
In this exclusive Executive Interview, Finance Magnates speaks with Artur Delijergijevs, Head of Systematic Market Making at CMC Markets, about the current state of metals demand and market volatility.
Delijergijevs offers a desk-level view on:
- Metals Demand: Why metals are seeing the strongest demand from both retail and institutional clients right now.
- The Safe-Haven Debate: Questioning whether gold still fits the classic safe-haven definition given large daily price movements.
- Volatile Market Prep: How a market-making desk prepares its systems and pricing for stressed market conditions and high-impact economic events.
- Hybrid Execution: Why the best execution model combines electronic speed with human relationship support, especially during volatility.
- AI in Workflow: Where CMC Markets is integrating machine learning for risk management and pricing, and the limitations of AI during stressed markets.
- Dubai's Role: The strategic importance of Dubai’s location for covering global trading sessions across Asia, Europe, and the US.
Watch to understand how CMC Markets maintains stable pricing and reliable execution quality in high-volatility environments.
#CMCmarkets #forex #metals #gold #trading #volatility #MarketMaking #iFXDubai #FinanceMagnates #Finance #Fintech #Execution #AlgorithmicTrading #RiskManagement
Finance Magnates Awards 2026 – Nominations Now Open
Finance Magnates Awards 2026 – Nominations Now Open
Finance Magnates Awards 2026 – Nominations Now Open
Finance Magnates Awards 2026 – Nominations Now Open
Finance Magnates Awards 2026 – Nominations Now Open
Finance Magnates Awards 2026 – Nominations Now Open
The Finance Magnates Awards 2026 nominations are now open. 🏆
From fintech innovators to leading brokers, this is where the finance industry celebrates its biggest achievements.
Winners will be announced at the Cyprus Gala Dinner on November 6, 2026.
Nominate your brand now.
https://awards.financemagnates.com/?utm_source=linkedin&utm_medium=video&utm_campaign=nominations-open
#FMAwards #FinanceMagnates #FintechAwards #Fintech #FinanceIndustry
Finance Magnates Awards 2026 | Nominations Now Open 🏆#Fintech #FMAwards #TradingIndustry
Finance Magnates Awards 2026 | Nominations Now Open 🏆#Fintech #FMAwards #TradingIndustry
Finance Magnates Awards 2026 | Nominations Now Open 🏆#Fintech #FMAwards #TradingIndustry
Finance Magnates Awards 2026 | Nominations Now Open 🏆#Fintech #FMAwards #TradingIndustry
Finance Magnates Awards 2026 | Nominations Now Open 🏆#Fintech #FMAwards #TradingIndustry
Finance Magnates Awards 2026 | Nominations Now Open 🏆#Fintech #FMAwards #TradingIndustry
Lights on. Cameras ready. 🎬
Finance Magnates Awards 2026 nominations are now open. 🏆
#FMAwards #FinanceMagnates #FintechAwards #Fintech
Lights on. Cameras ready. 🎬
Finance Magnates Awards 2026 nominations are now open. 🏆
#FMAwards #FinanceMagnates #FintechAwards #Fintech
Lights on. Cameras ready. 🎬
Finance Magnates Awards 2026 nominations are now open. 🏆
#FMAwards #FinanceMagnates #FintechAwards #Fintech
Lights on. Cameras ready. 🎬
Finance Magnates Awards 2026 nominations are now open. 🏆
#FMAwards #FinanceMagnates #FintechAwards #Fintech
Lights on. Cameras ready. 🎬
Finance Magnates Awards 2026 nominations are now open. 🏆
#FMAwards #FinanceMagnates #FintechAwards #Fintech
Lights on. Cameras ready. 🎬
Finance Magnates Awards 2026 nominations are now open. 🏆
#FMAwards #FinanceMagnates #FintechAwards #Fintech
Exness sees trust as the key theme for growth in MENA Trading Growth for 2026
Exness sees trust as the key theme for growth in MENA Trading Growth for 2026
Exness sees trust as the key theme for growth in MENA Trading Growth for 2026
Exness sees trust as the key theme for growth in MENA Trading Growth for 2026
Exness sees trust as the key theme for growth in MENA Trading Growth for 2026
Exness sees trust as the key theme for growth in MENA Trading Growth for 2026
Mohammad Amer, Regional Commercial Director at Exness, sits down to discuss the booming MENA financial trading market. Find out why Dubai is key to the company's growth strategy, how a mobile-first generation is changing expectations, and why trust will be the defining theme for traders in 2026.
In this interview, you'll learn:
* Why Dubai and the MENA region are critical growth markets for fintech and online trading.
* How Exness is addressing the demands of mobile-first, younger traders through engineering, platform stability, and transparent conditions.
* The essential role local talent plays in providing a culturally relevant and compliant user experience.
* Mohammad Amer's outlook on the future of the online trading industry and why stronger controls and systems are necessary.
* Why "trust" isn't just a brand value, but has commercial value—and why he predicts 2026 will be the "Year of Trust."
Key Takeaways:
➡️ The MENA region is rapidly shaping global financial markets.
➡️ New traders expect stability, precise execution, and transparency.
➡️ Local expertise is key to regulatory compliance and user experience.
➡️ Future success belongs to firms capable of meeting rising standards across regulation and platform consistency.
Read the full article at: https://www.financemagnates.com/thought-leadership/exness-sees-trust-as-the-key-theme-for-growth-in-mena-trading-growth-for-2026/
#Exness #MENA #Trading #FinTech #Dubai #OnlineTrading #FinanceMagnates #MohammadAmer #Trust #MobileTrading