Bitcoin is going down for the fourth consecutive session on Tuesday, as Trump's tariff chaos and Iran war fears batter risk appetite.
The crypto market shed over $240 million in leveraged long liquidations on Monday alone, with ETF outflows accelerating the selloff.
Bitcoin is now down 50% from its all-time high above $125,000 and technical analysis shows the next critical support sits near $49,000-$53,000.
How low can Bitcon go?
Bitcoin (BTC)
price is falling for the fourth straight session, and the chart is sending
increasingly bearish signals. BTC tumbled below $63,000 on Tuesday, February
24, extending a decline that has now lasted four sessions without relief. The
intraday low reached $62,964, the weakest print in nearly three weeks.
According
to my technical analysis and over a decade of experience as an analyst and
trader, Bitcoin is consolidating at its lowest levels since Q4 2024, and the
structure of that consolidation looks fragile. In this article, I examine why
Bitcoin is going down, analyze the BTC chart in detail, and present the newest
Bitcoin price predictions and key technical levels to watch.
Follow
me on X for more Bitcoin and crypto market analysis: @ChmielDk
Bitcoin Price Today: Back
Below $63,000
Monday's
4%+ drop - the steepest single-day decline since February 5 - set the tone, and
Tuesday's follow-through has done nothing to reassure bulls.
The broader
damage is stark. From its all-time high of over $125,000 per token set
in October 2025, Bitcoin has now shed approximately 50% of its value.
VanEck's research desk noted that Bitcoin is currently trading -2.88
standard deviations below its 200-day moving average - a level that
has never been observed in the past ten years of data, including during COVID
and the FTX collapse.
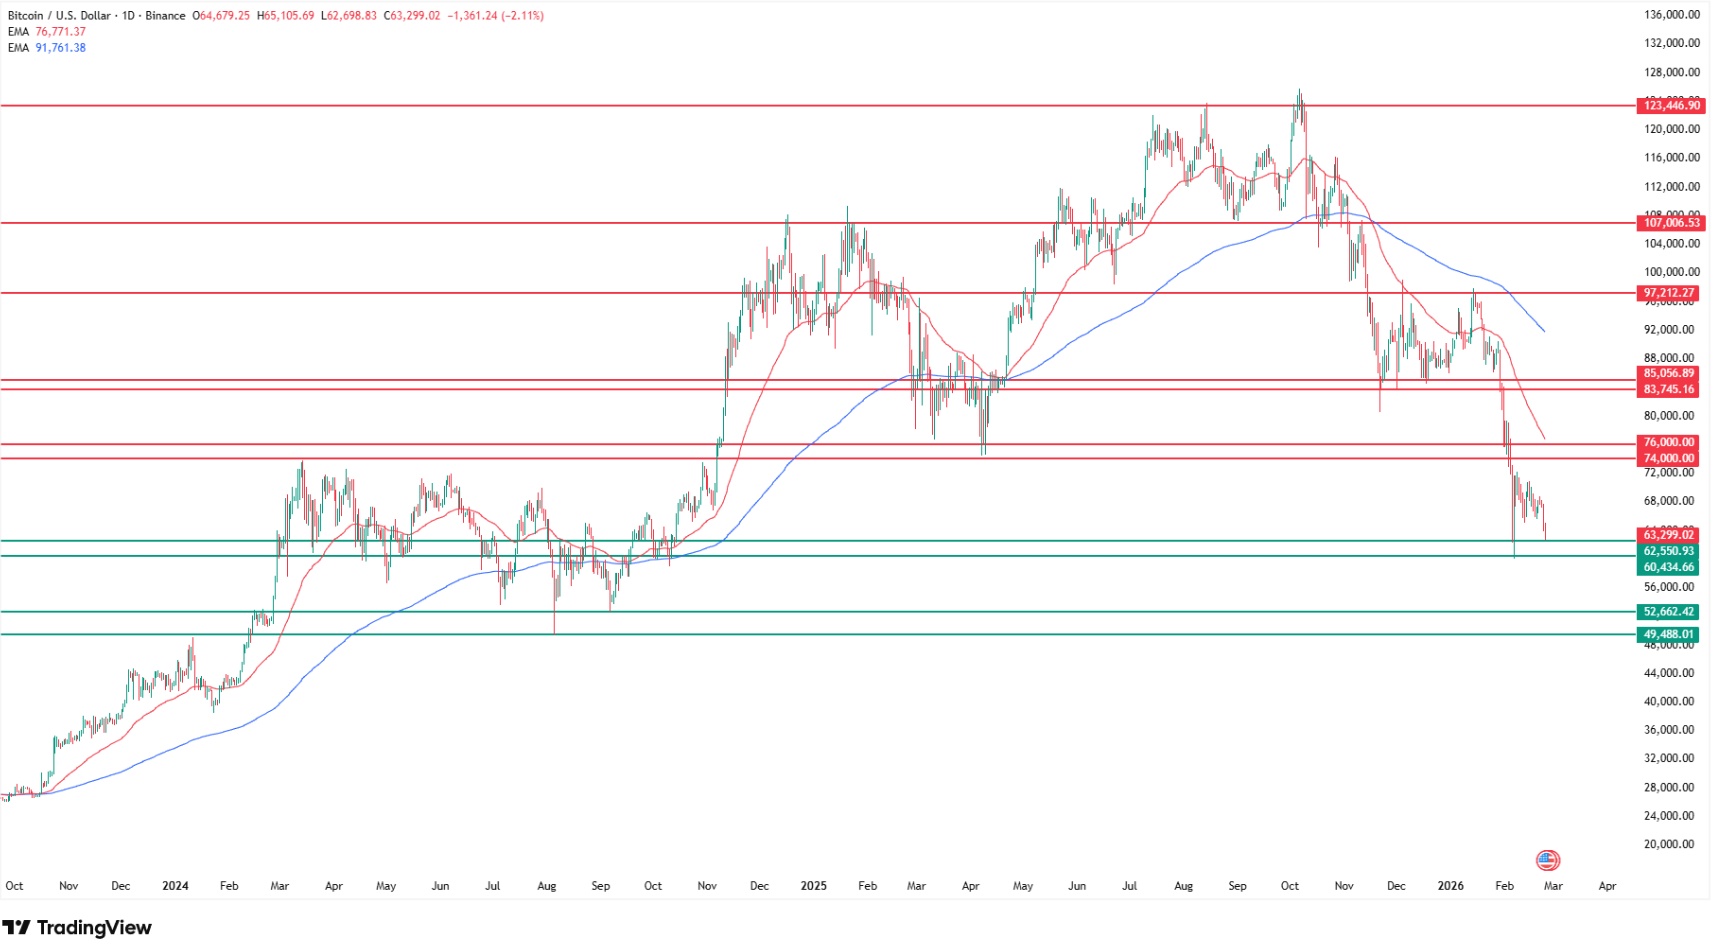
Bitcoin Technical
Analysis: What the BTC Chart Shows
According
to my technical analysis, Bitcoin is increasingly and visibly consolidating at
the lowest levels since Q4 2024. As shown on my chart, this consolidation has a
well-defined structure:
Consolidation floor: $60,000-$62,000 - where
psychological support and recent lows converge
Consolidation ceiling: $72,000-$74,000 - the
upper cap that has capped every recovery attempt
Critical breakdown target: $53,000, and potentially
as low as $49,000 - the H2 2024 lows
A weekly
close below the $60,000-$62,000 band would, in my view, confirm a breakdown
from this consolidation. From there, the next meaningful demand zone does not
appear until
the $49,000-$53,000 range, where the second half of 2024
set its structural lows. That represents a further 15-22% decline from
current levels.
Why Bitcoin price is going down today. Source: Tradingview.com
Looking
higher, the bulls need to reclaim $72,000-$74,000 on a
sustained basis to even begin talking about recovery. Until that happens, every
bounce is a selling opportunity in a bear-trending structure.
Why Is Bitcoin Going Down?
The Macro Trigger Stack
There is no
single cause here. Bitcoin is being hit from multiple directions
simultaneously.
The
immediate trigger is the ongoing Trump tariff chaos. Following the
Supreme Court's IEEPA ruling last week, Trump imposed new 15% global tariffs
via executive order, reintroducing trade policy uncertainty just as markets had
begun to stabilize. Risk-off sentiment spilled directly from equities into
crypto.
"Crypto
markets remain under pressure into Tuesday, with Bitcoin extending its pullback
toward the February low," said Joel Kruger, crypto strategist at
LMAX. As he added: "The negative tone reflects a combination of
macro-driven risk aversion, ongoing deleveraging, and defensive positioning -
including elevated sovereign yields, a firm US dollar, and lingering
geopolitical uncertainty."
The second
major pressure point is geopolitical. The US-Iran military buildup -
described by multiple sources as the largest since the 2003 Iraq War - is
driving a classic flight from risk assets toward traditional safe havens. Gold
and oil are rising. Bitcoin is not.
"Bitcoin
has officially exited its consolidation phase and entered a new bearish
cycle," said Samer Hasn, Senior Market Analyst at XS.com.
"This toxic cocktail of economic, political, and geopolitical shocks is
aggressively flushing capital out of the crypto market - leaving significant
room for bears to dominate."
The
mechanics of the selloff have amplified the fundamental picture:
$240 million in forced
liquidations of
leveraged long positions on Monday alone
Continued ETF outflows, with institutional demand
insufficient to absorb selling
Whale selling - on-chain data shows
large holders moving significant BTC to exchanges
AI stock correlation - as AI and HPC stocks
corrected, Bitcoin miners with data center exposure sold BTC to cover
balance sheet stress
"The
decline in Bitcoin appears less like a specific shock to the cryptocurrency and
more akin to a typical reset in risk sentiment," said Christopher
Hamilton, Head of Client Investment Solutions APAC at Invesco. He described
the move as "tactical de-risking rather than a long-term withdrawal."
How Low Can Bitcoin Go?
Key Levels and Predictions
This is the
question every trader is asking right now - and the honest answer is that the
range of outcomes remains wide.
Level
Significance
$63,000
Current
price zone, 3-week low
$60,000
Psychological floor, consolidation bottom
$53,000
First
breakdown target (H2 2024 structure)
$49,000
Deeper H2
2024 lows - full breakdown scenario
$38,000-$42,000
200 EMA
zone - major long-term trend support
Institutional
forecasters remain divided. On the bearish side, the breakdown of the
$60,000-$62,000 zone would technically open the $49,000-$53,000 window. On the
cautiously optimistic side, VanEck notes that the combination of a deep
drawdown and materially lower-than-historical volatility "suggests that a
significant portion of downside risk has already been absorbed."
The key
variable is macro resolution. If US-Iran tensions de-escalate or tariff
uncertainty clears, the relief trade could be sharp. But as Hasn of XS.com
noted, "buyers are currently surfacing only for short-lived corrective
bounces" - not the sustained demand needed to flip the structure.
Bitcoin Price, FAQ
Why is Bitcoin falling
today?
Bitcoin is
going down due to a combination of Trump's 15% global tariff announcement,
escalating US-Iran military tensions, $240M+ in forced liquidations of
leveraged long positions, and continued ETF outflows. Risk-off sentiment is
driving capital into traditional safe havens like gold rather than crypto.
How low can Bitcoin go in
2026?
Based on my
technical analysis, the critical level is the $60,000-$62,000 consolidation
floor. A weekly close below that zone opens a technical target of $53,000 and
potentially $49,000 - the H2 2024 structural lows. The 200 EMA
sits near $38,000-$42,000 and represents the deepest bear case support.
The chart
requires a sustained reclaim of $72,000-$74,000 - the top of
the current consolidation range - to signal any meaningful trend reversal.
Until that happens, the path of least resistance remains lower. Macro clarity
on US-Iran tensions and tariff policy would be the most likely catalysts for a
stabilization.
Bitcoin (BTC)
price is falling for the fourth straight session, and the chart is sending
increasingly bearish signals. BTC tumbled below $63,000 on Tuesday, February
24, extending a decline that has now lasted four sessions without relief. The
intraday low reached $62,964, the weakest print in nearly three weeks.
According
to my technical analysis and over a decade of experience as an analyst and
trader, Bitcoin is consolidating at its lowest levels since Q4 2024, and the
structure of that consolidation looks fragile. In this article, I examine why
Bitcoin is going down, analyze the BTC chart in detail, and present the newest
Bitcoin price predictions and key technical levels to watch.
Follow
me on X for more Bitcoin and crypto market analysis: @ChmielDk
Bitcoin Price Today: Back
Below $63,000
Monday's
4%+ drop - the steepest single-day decline since February 5 - set the tone, and
Tuesday's follow-through has done nothing to reassure bulls.
The broader
damage is stark. From its all-time high of over $125,000 per token set
in October 2025, Bitcoin has now shed approximately 50% of its value.
VanEck's research desk noted that Bitcoin is currently trading -2.88
standard deviations below its 200-day moving average - a level that
has never been observed in the past ten years of data, including during COVID
and the FTX collapse.
Bitcoin Technical
Analysis: What the BTC Chart Shows
According
to my technical analysis, Bitcoin is increasingly and visibly consolidating at
the lowest levels since Q4 2024. As shown on my chart, this consolidation has a
well-defined structure:
Consolidation floor: $60,000-$62,000 - where
psychological support and recent lows converge
Consolidation ceiling: $72,000-$74,000 - the
upper cap that has capped every recovery attempt
Critical breakdown target: $53,000, and potentially
as low as $49,000 - the H2 2024 lows
A weekly
close below the $60,000-$62,000 band would, in my view, confirm a breakdown
from this consolidation. From there, the next meaningful demand zone does not
appear until
the $49,000-$53,000 range, where the second half of 2024
set its structural lows. That represents a further 15-22% decline from
current levels.
Why Bitcoin price is going down today. Source: Tradingview.com
Looking
higher, the bulls need to reclaim $72,000-$74,000 on a
sustained basis to even begin talking about recovery. Until that happens, every
bounce is a selling opportunity in a bear-trending structure.
Why Is Bitcoin Going Down?
The Macro Trigger Stack
There is no
single cause here. Bitcoin is being hit from multiple directions
simultaneously.
The
immediate trigger is the ongoing Trump tariff chaos. Following the
Supreme Court's IEEPA ruling last week, Trump imposed new 15% global tariffs
via executive order, reintroducing trade policy uncertainty just as markets had
begun to stabilize. Risk-off sentiment spilled directly from equities into
crypto.
"Crypto
markets remain under pressure into Tuesday, with Bitcoin extending its pullback
toward the February low," said Joel Kruger, crypto strategist at
LMAX. As he added: "The negative tone reflects a combination of
macro-driven risk aversion, ongoing deleveraging, and defensive positioning -
including elevated sovereign yields, a firm US dollar, and lingering
geopolitical uncertainty."
The second
major pressure point is geopolitical. The US-Iran military buildup -
described by multiple sources as the largest since the 2003 Iraq War - is
driving a classic flight from risk assets toward traditional safe havens. Gold
and oil are rising. Bitcoin is not.
"Bitcoin
has officially exited its consolidation phase and entered a new bearish
cycle," said Samer Hasn, Senior Market Analyst at XS.com.
"This toxic cocktail of economic, political, and geopolitical shocks is
aggressively flushing capital out of the crypto market - leaving significant
room for bears to dominate."
The
mechanics of the selloff have amplified the fundamental picture:
$240 million in forced
liquidations of
leveraged long positions on Monday alone
Continued ETF outflows, with institutional demand
insufficient to absorb selling
Whale selling - on-chain data shows
large holders moving significant BTC to exchanges
AI stock correlation - as AI and HPC stocks
corrected, Bitcoin miners with data center exposure sold BTC to cover
balance sheet stress
"The
decline in Bitcoin appears less like a specific shock to the cryptocurrency and
more akin to a typical reset in risk sentiment," said Christopher
Hamilton, Head of Client Investment Solutions APAC at Invesco. He described
the move as "tactical de-risking rather than a long-term withdrawal."
How Low Can Bitcoin Go?
Key Levels and Predictions
This is the
question every trader is asking right now - and the honest answer is that the
range of outcomes remains wide.
Level
Significance
$63,000
Current
price zone, 3-week low
$60,000
Psychological floor, consolidation bottom
$53,000
First
breakdown target (H2 2024 structure)
$49,000
Deeper H2
2024 lows - full breakdown scenario
$38,000-$42,000
200 EMA
zone - major long-term trend support
Institutional
forecasters remain divided. On the bearish side, the breakdown of the
$60,000-$62,000 zone would technically open the $49,000-$53,000 window. On the
cautiously optimistic side, VanEck notes that the combination of a deep
drawdown and materially lower-than-historical volatility "suggests that a
significant portion of downside risk has already been absorbed."
The key
variable is macro resolution. If US-Iran tensions de-escalate or tariff
uncertainty clears, the relief trade could be sharp. But as Hasn of XS.com
noted, "buyers are currently surfacing only for short-lived corrective
bounces" - not the sustained demand needed to flip the structure.
Bitcoin Price, FAQ
Why is Bitcoin falling
today?
Bitcoin is
going down due to a combination of Trump's 15% global tariff announcement,
escalating US-Iran military tensions, $240M+ in forced liquidations of
leveraged long positions, and continued ETF outflows. Risk-off sentiment is
driving capital into traditional safe havens like gold rather than crypto.
How low can Bitcoin go in
2026?
Based on my
technical analysis, the critical level is the $60,000-$62,000 consolidation
floor. A weekly close below that zone opens a technical target of $53,000 and
potentially $49,000 - the H2 2024 structural lows. The 200 EMA
sits near $38,000-$42,000 and represents the deepest bear case support.
The chart
requires a sustained reclaim of $72,000-$74,000 - the top of
the current consolidation range - to signal any meaningful trend reversal.
Until that happens, the path of least resistance remains lower. Macro clarity
on US-Iran tensions and tariff policy would be the most likely catalysts for a
stabilization.
Damian Chmiel is a Senior Analyst & Editor at Finance Magnates with more than 15 years of experience in the CFD and online trading industry. Active as both a trader and journalist since 2010, he focuses on broker coverage, fintech innovation, and regulatory developments across Europe, the Middle East, and Asia.
His work includes interviews with C-level leaders at major brokerages and fintech platforms, as well as co-authoring Finance Magnates’ quarterly industry benchmarking reports. Damian’s reporting is data-driven, market-aware, and grounded in direct industry engagement. His analysis and commentary have also been cited by external media outlets, including Investing.com, Binance, The Asset, Stockhead, and Dispatch.
Education:
MA in Finance and Accounting, Cracow University of Economics
Recognition that matters.
Built on transparency.
Driven by the industry.
The Finance Magnates Awards 2026.
Nominations are now open.
🔗 https://awards.financemagnates.com/?utm_source=SM&utm_medium=social&utm_campaign=recognition-matters
Recognition that matters.
Built on transparency.
Driven by the industry.
The Finance Magnates Awards 2026.
Nominations are now open.
🔗 https://awards.financemagnates.com/?utm_source=SM&utm_medium=social&utm_campaign=recognition-matters
Recognition that matters.
Built on transparency.
Driven by the industry.
The Finance Magnates Awards 2026.
Nominations are now open.
🔗 https://awards.financemagnates.com/?utm_source=SM&utm_medium=social&utm_campaign=recognition-matters
Recognition that matters.
Built on transparency.
Driven by the industry.
The Finance Magnates Awards 2026.
Nominations are now open.
🔗 https://awards.financemagnates.com/?utm_source=SM&utm_medium=social&utm_campaign=recognition-matters
Tickmill Winner Spotlight | Broker of the Year 2025 (LATAM) 🏆 | Finance Magnates Awards #Trading
Tickmill Winner Spotlight | Broker of the Year 2025 (LATAM) 🏆 | Finance Magnates Awards #Trading
Tickmill Winner Spotlight | Broker of the Year 2025 (LATAM) 🏆 | Finance Magnates Awards #Trading
Tickmill Winner Spotlight | Broker of the Year 2025 (LATAM) 🏆 | Finance Magnates Awards #Trading
Tickmill Winner Spotlight | Broker of the Year 2025 (LATAM) 🏆 | Finance Magnates Awards #Trading
Tickmill Winner Spotlight | Broker of the Year 2025 (LATAM) 🏆 | Finance Magnates Awards #Trading
What helped Tickmill stand out this year?
In this Winner Spotlight, Johnny Khalil, Executive Director at Tickmill Europe, shares how listening closely to clients and delivering strong trading conditions made the difference.
A big thank you to the community whose support continues to drive progress every day.
👉 Think your brand has what it takes? Nominate for the 2026 Finance Magnates Awards: https://awards.financemagnates.com/#nominate
CMC Markets’ Artur Delijergijevs on Metals Demand, Volatility, & Stable Execution
CMC Markets’ Artur Delijergijevs on Metals Demand, Volatility, & Stable Execution
CMC Markets’ Artur Delijergijevs on Metals Demand, Volatility, & Stable Execution
CMC Markets’ Artur Delijergijevs on Metals Demand, Volatility, & Stable Execution
CMC Markets’ Artur Delijergijevs on Metals Demand, Volatility, & Stable Execution
CMC Markets’ Artur Delijergijevs on Metals Demand, Volatility, & Stable Execution
In this exclusive Executive Interview, Finance Magnates speaks with Artur Delijergijevs, Head of Systematic Market Making at CMC Markets, about the current state of metals demand and market volatility.
Delijergijevs offers a desk-level view on:
- Metals Demand: Why metals are seeing the strongest demand from both retail and institutional clients right now.
- The Safe-Haven Debate: Questioning whether gold still fits the classic safe-haven definition given large daily price movements.
- Volatile Market Prep: How a market-making desk prepares its systems and pricing for stressed market conditions and high-impact economic events.
- Hybrid Execution: Why the best execution model combines electronic speed with human relationship support, especially during volatility.
- AI in Workflow: Where CMC Markets is integrating machine learning for risk management and pricing, and the limitations of AI during stressed markets.
- Dubai's Role: The strategic importance of Dubai’s location for covering global trading sessions across Asia, Europe, and the US.
Watch to understand how CMC Markets maintains stable pricing and reliable execution quality in high-volatility environments.
#CMCmarkets #forex #metals #gold #trading #volatility #MarketMaking #iFXDubai #FinanceMagnates #Finance #Fintech #Execution #AlgorithmicTrading #RiskManagement
Finance Magnates Awards 2026 – Nominations Now Open
Finance Magnates Awards 2026 – Nominations Now Open
Finance Magnates Awards 2026 – Nominations Now Open
Finance Magnates Awards 2026 – Nominations Now Open
Finance Magnates Awards 2026 – Nominations Now Open
Finance Magnates Awards 2026 – Nominations Now Open
The Finance Magnates Awards 2026 nominations are now open. 🏆
From fintech innovators to leading brokers, this is where the finance industry celebrates its biggest achievements.
Winners will be announced at the Cyprus Gala Dinner on November 6, 2026.
Nominate your brand now.
https://awards.financemagnates.com/?utm_source=linkedin&utm_medium=video&utm_campaign=nominations-open
#FMAwards #FinanceMagnates #FintechAwards #Fintech #FinanceIndustry
Finance Magnates Awards 2026 | Nominations Now Open 🏆#Fintech #FMAwards #TradingIndustry
Finance Magnates Awards 2026 | Nominations Now Open 🏆#Fintech #FMAwards #TradingIndustry
Finance Magnates Awards 2026 | Nominations Now Open 🏆#Fintech #FMAwards #TradingIndustry
Finance Magnates Awards 2026 | Nominations Now Open 🏆#Fintech #FMAwards #TradingIndustry
Finance Magnates Awards 2026 | Nominations Now Open 🏆#Fintech #FMAwards #TradingIndustry
Finance Magnates Awards 2026 | Nominations Now Open 🏆#Fintech #FMAwards #TradingIndustry
Lights on. Cameras ready. 🎬
Finance Magnates Awards 2026 nominations are now open. 🏆
#FMAwards #FinanceMagnates #FintechAwards #Fintech
Lights on. Cameras ready. 🎬
Finance Magnates Awards 2026 nominations are now open. 🏆
#FMAwards #FinanceMagnates #FintechAwards #Fintech
Lights on. Cameras ready. 🎬
Finance Magnates Awards 2026 nominations are now open. 🏆
#FMAwards #FinanceMagnates #FintechAwards #Fintech
Lights on. Cameras ready. 🎬
Finance Magnates Awards 2026 nominations are now open. 🏆
#FMAwards #FinanceMagnates #FintechAwards #Fintech
Lights on. Cameras ready. 🎬
Finance Magnates Awards 2026 nominations are now open. 🏆
#FMAwards #FinanceMagnates #FintechAwards #Fintech
Lights on. Cameras ready. 🎬
Finance Magnates Awards 2026 nominations are now open. 🏆
#FMAwards #FinanceMagnates #FintechAwards #Fintech