XRP fell 0.5% to $1.89 on Tuesday, trapped in a 2.5-month consolidation between $1.80-$2.35 with price 25.9% below the 200 EMA at $2.55.
According to technical analysis, XRP has three downside targets, starting with short-term one of $1.80 (-6%).
The medium-term target stands at $1.26 (-33%), while the extreme $0.53 Fibonacci extension at -70% from current quotes.
How low can XRP price go? Let's check the current XRP price predictions
XRP price
is falling a modest 0.5% during Tuesday's session on January
27, 2026, trading at $1.89.
According
to technical analysis, there are currently three distinct downside targets now
active: a short-term test of the $1.80 consolidation lower boundary,
a medium-term drop to $1.26 representing a 33% decline,
and an extreme bearish scenario pointing to $0.53, which would mark
a catastrophic 70% correction from current levels.
In this article, I examine how low will XRP price go
and what are the most up to date XRP price predictions for 2026.
Why XRP Is Falling Today?
Why XRP
is falling today boils
down to a combination of technical breakdown risk, macro liquidity drain, and
the continuation of a structural bear trend that has been in place since the
July 2025 downtrend line was established.
Samer Hasn,
Senior Market Analyst at XS.com, notes that "liquidity is
shrinking across channels," with spot ETFs seeing "less
than $7 million" in inflows yesterday after "$1.3
billion of outflows last week", while total crypto futures open
interest slid to $128 billion, the weakest levels since
early January according to CoinGlass. This liquidity drought is
hitting altcoins like XRP particularly hard, as institutional capital rotates
away from speculative crypto positions.
As I
documented in my previous
analysis, XRP had
just logged 7 consecutive down sessions amid tariff fears and
a broader crypto selloff. Earlier, on January 19, I
warned that
XRP had declined in 13 of 14 sessions.
XRP Technical Analysis:
Below Moving Averages
XRP is
currently trading below both the 50-day moving average at $1.98 and
far below the 200-day moving average at $2.55. This confirms that
on my chart, XRP remains in a clear downtrend with bears firmly in
control. The cryptocurrency is down 48.4% from its year high
of $3.67 reached in early January, while sitting only 17.6% above
the year low of $1.61 established earlier this month.
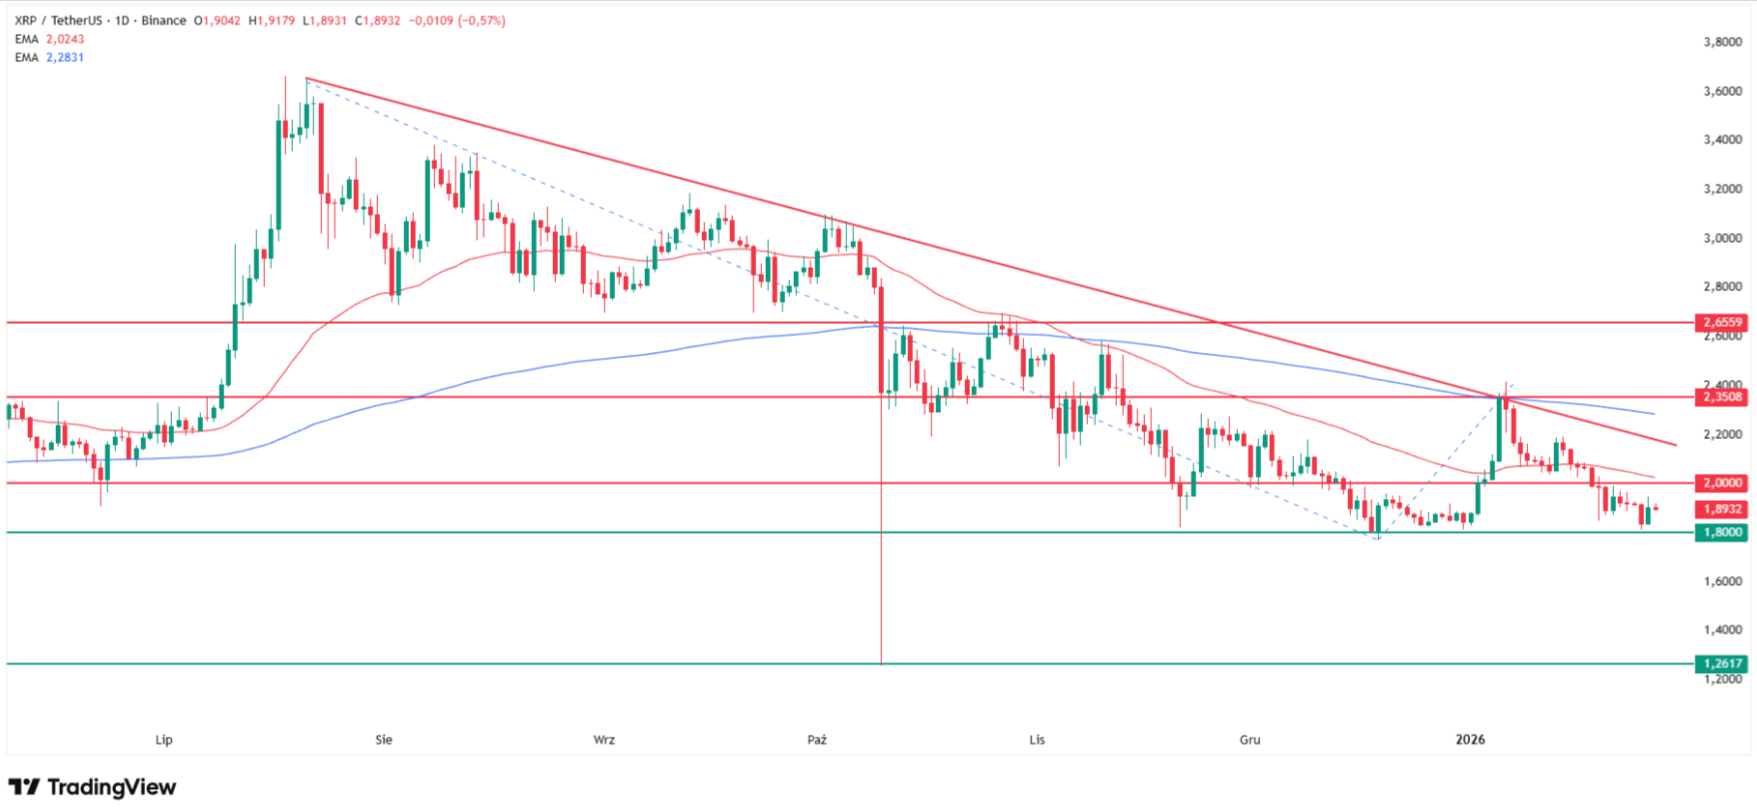
From the
perspective of my conducted technical analysis, the price has
remained in the same consolidation for 2.5 months, with the upper
boundary around $2.35, last tested on January 5 when it
climbed to medium-term local highs.
Why XRP price is going down today? Source: Tradingview.com
At that
time, XRP also tested the downtrend line drawn from July 2025,
connecting progressively lower highs, which triggered a stronger supply
reaction, broke the round $2.00 level, and sent price back down
to the lower consolidation boundary around $1.80, tested multiple
times including at the start of this year.
Current
XRP price: $1.89
(Tuesday, January 27, 2026)
Consolidation upper boundary: $2.35 (last tested January 5)
Consolidation lower boundary: $1.80 (tested multiple times, under
threat)
Downtrend line: From July 2025 highs, connecting lower highs
200 EMA: $2.55 (price 25.9% below)
50 EMA: $1.98 (price 4.5% below)
Paul
Howard, Senior Director at Wincent, observes that "in the
perpetuals market, aggressive taker selling over the weekend drove prices
lower" and that "momentum suggests further downside
risk" with "fast-money flows appear to have rotated
into commodities, particularly long silver and copper, while BTC and ETH have
been left behind".
If Bitcoin
and Ethereum, the market's blue chips, are being abandoned by fast money, XRP
faces an even tougher environment as a higher-beta, litigation-scarred altcoin.
What Would Change My Bear
View
If XRP
is to lift supply pressure from its shoulders, we would need to see price return at least
above the downtrend line from July 2025 and also above
the 200-day exponential moving average (200 EMA) which
currently sits at $2.55. Of course, it will also be necessary to
break the upper consolidation boundary around $2.35, which would
remove a significant portion of the pressure from buyers' shoulders.
However, I
remain a structural bear on XRP. The moving average alignment (price below
50 EMA below 200 EMA), the downtrend line resistance, and the failure to
reclaim $2.00 all confirm the bearish bias on my chart.
For
real-time XRP technical analysis, follow me on
X (Twitter) @ChmielDk. I provide moving average updates, Fibonacci
projections, and liquidity flow insights on why XRP is falling and how low it
can go.
How Low Can XRP Go? My
Three Downside Targets
The
critical question, how low will XRP go, has three distinct answers
depending on the depth and duration of the correction according to my
technical analysis.
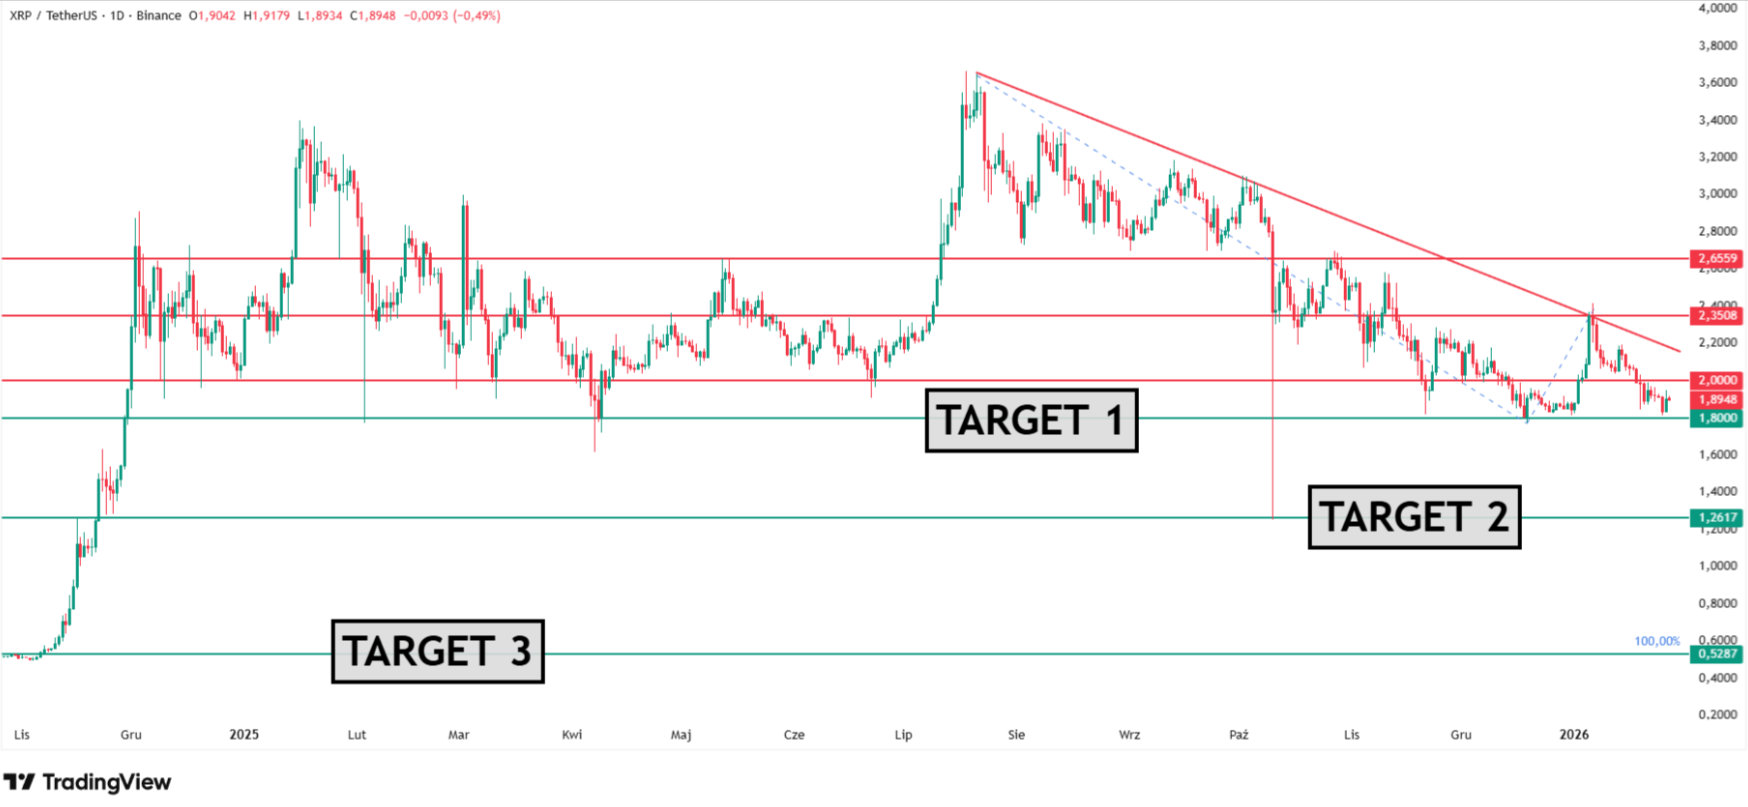
How low will XRP go? Three XRP price predictions. Source: Tradingview.com
Short-Term Target: $1.80
(-7%)
As you can
see on my chart, XRP is currently trading at $1.89,
just 7% above the $1.80 lower consolidation boundary that
has been tested multiple times over the past 2.5 months. This is the immediate
level under attack, and given the weakening momentum, compressed volatility,
and position below both moving averages, a test of this support appears
imminent.
In the
short term, I am targeting a return to the $1.80 level, which means a potential decline of
about 7% from current prices. This level has held on multiple
occasions, but the proximity to the year low of $1.61 (only
17.6% below current price) suggests limited cushion if $1.80 breaks.
My
long-term, ultra-bearish scenario based on Fibonacci extensions paints an even
grimmer picture. Measuring the downtrend from July to December 2025 and
then the correction we interrupted at the turn of December and January this
year, the 100% Fibonacci extension falls at a level of just under $0.53.
This would
represent the lowest XRP price since November 2024 and a
potential decline of approximately 70% from current levels.
While this is an extreme scenario, it remains technically valid on my
chart if macro conditions worsen significantly, liquidity continues
draining from altcoins, and the broader crypto market enters a full risk-off
cascade.
XRP Price Prediction Roadmap
Target
Level
Decline from Current
Scenario
Chart Basis
Short-term
$1.80
-6% to -7%
Consolidation
lower boundary, immediate test
Tested multiple times, weakening
Medium-term
$1.26
-33%
Flash-crash
low (Oct 10, Binance)
Next
major support if $1.80 breaks
Extreme bearish
$0.53
-70%
100% Fibonacci extension, Nov 2024 lows
July-Dec
downtrend + correction measure
Liquidity Drain Supports
Bear Case
Hasn’s
observation that "liquidity is shrinking across channels" with
spot ETFs seeing minimal inflows and crypto futures open interest dropping
to $128 billion (weakest since early January) aligns perfectly
with the weakness visible on the XRP chart. When institutional
liquidity evaporates, high-beta altcoins like XRP suffer disproportionately.
Maxime
Seiler, CEO at STS Digital, adds that "the broader picture is one
of heavy volatility supply, realized volatility has been subdued, and implied
volatility is likely to remain under pressure until a meaningful catalyst
forces a repricing".
This fits
the grinding, low-volatility breakdown pattern. Price slowly compressing toward
the $1.80 support before an eventual break and acceleration lowerWhy is XRP
falling today?
XRP is
falling today due to technical breakdown risk at $1.80 consolidation support,
continued downtrend from July 2025 line, and shrinking liquidity. Price at
$1.89, down 0.46%, trades 25.9% below 200 EMA at $2.55 and 4.5% below 50 EMA at
$1.98. One senior analyst notes "liquidity is shrinking across
channels" with spot ETFs seeing less than $7 million inflows after $1.3
billion outflows last week. As I documented in my January 21 Finance Magnates
analysis, XRP logged 7 straight down sessions amid $1.7B market-wide
liquidations.
XRP Price Analysis, FAQ
How low can XRP go?
According
to my technical analysis, XRP has three downside targets: short-term $1.80
(consolidation lower boundary, -5% to -6%), medium-term $1.26 (October 10
flash-crash low, -33%), and extreme $0.53 (100% Fibonacci extension, -70% from
current $1.89).
What is XRP price
prediction for 2026?
My XRP
price prediction: near-term test of $1.80 support likely within days, followed
by breakdown to $1.26 medium-term target (-33%) on my chart. If macro worsens
and liquidity drain accelerates, extreme $0.53 Fibonacci target (-70%) remains
valid.
Why is XRP falling after
reaching $3.67?
XRP falling
from year high $3.67 due to downtrend line from July 2025 resistance, failure
to hold above $2.00, and structural bear market. Now at $1.89, down 48.4% from
highs, only 17.6% above year low $1.61.
How low will XRP go if
$1.80 breaks?
If $1.80
consolidation floor breaks cleanly, XRP will target $1.26 (October 10
flash-crash low, -33% from current $1.89).
XRP price
is falling a modest 0.5% during Tuesday's session on January
27, 2026, trading at $1.89.
According
to technical analysis, there are currently three distinct downside targets now
active: a short-term test of the $1.80 consolidation lower boundary,
a medium-term drop to $1.26 representing a 33% decline,
and an extreme bearish scenario pointing to $0.53, which would mark
a catastrophic 70% correction from current levels.
In this article, I examine how low will XRP price go
and what are the most up to date XRP price predictions for 2026.
Why XRP Is Falling Today?
Why XRP
is falling today boils
down to a combination of technical breakdown risk, macro liquidity drain, and
the continuation of a structural bear trend that has been in place since the
July 2025 downtrend line was established.
Samer Hasn,
Senior Market Analyst at XS.com, notes that "liquidity is
shrinking across channels," with spot ETFs seeing "less
than $7 million" in inflows yesterday after "$1.3
billion of outflows last week", while total crypto futures open
interest slid to $128 billion, the weakest levels since
early January according to CoinGlass. This liquidity drought is
hitting altcoins like XRP particularly hard, as institutional capital rotates
away from speculative crypto positions.
As I
documented in my previous
analysis, XRP had
just logged 7 consecutive down sessions amid tariff fears and
a broader crypto selloff. Earlier, on January 19, I
warned that
XRP had declined in 13 of 14 sessions.
XRP Technical Analysis:
Below Moving Averages
XRP is
currently trading below both the 50-day moving average at $1.98 and
far below the 200-day moving average at $2.55. This confirms that
on my chart, XRP remains in a clear downtrend with bears firmly in
control. The cryptocurrency is down 48.4% from its year high
of $3.67 reached in early January, while sitting only 17.6% above
the year low of $1.61 established earlier this month.
From the
perspective of my conducted technical analysis, the price has
remained in the same consolidation for 2.5 months, with the upper
boundary around $2.35, last tested on January 5 when it
climbed to medium-term local highs.
Why XRP price is going down today? Source: Tradingview.com
At that
time, XRP also tested the downtrend line drawn from July 2025,
connecting progressively lower highs, which triggered a stronger supply
reaction, broke the round $2.00 level, and sent price back down
to the lower consolidation boundary around $1.80, tested multiple
times including at the start of this year.
Current
XRP price: $1.89
(Tuesday, January 27, 2026)
Consolidation upper boundary: $2.35 (last tested January 5)
Consolidation lower boundary: $1.80 (tested multiple times, under
threat)
Downtrend line: From July 2025 highs, connecting lower highs
200 EMA: $2.55 (price 25.9% below)
50 EMA: $1.98 (price 4.5% below)
Paul
Howard, Senior Director at Wincent, observes that "in the
perpetuals market, aggressive taker selling over the weekend drove prices
lower" and that "momentum suggests further downside
risk" with "fast-money flows appear to have rotated
into commodities, particularly long silver and copper, while BTC and ETH have
been left behind".
If Bitcoin
and Ethereum, the market's blue chips, are being abandoned by fast money, XRP
faces an even tougher environment as a higher-beta, litigation-scarred altcoin.
What Would Change My Bear
View
If XRP
is to lift supply pressure from its shoulders, we would need to see price return at least
above the downtrend line from July 2025 and also above
the 200-day exponential moving average (200 EMA) which
currently sits at $2.55. Of course, it will also be necessary to
break the upper consolidation boundary around $2.35, which would
remove a significant portion of the pressure from buyers' shoulders.
However, I
remain a structural bear on XRP. The moving average alignment (price below
50 EMA below 200 EMA), the downtrend line resistance, and the failure to
reclaim $2.00 all confirm the bearish bias on my chart.
For
real-time XRP technical analysis, follow me on
X (Twitter) @ChmielDk. I provide moving average updates, Fibonacci
projections, and liquidity flow insights on why XRP is falling and how low it
can go.
How Low Can XRP Go? My
Three Downside Targets
The
critical question, how low will XRP go, has three distinct answers
depending on the depth and duration of the correction according to my
technical analysis.
How low will XRP go? Three XRP price predictions. Source: Tradingview.com
Short-Term Target: $1.80
(-7%)
As you can
see on my chart, XRP is currently trading at $1.89,
just 7% above the $1.80 lower consolidation boundary that
has been tested multiple times over the past 2.5 months. This is the immediate
level under attack, and given the weakening momentum, compressed volatility,
and position below both moving averages, a test of this support appears
imminent.
In the
short term, I am targeting a return to the $1.80 level, which means a potential decline of
about 7% from current prices. This level has held on multiple
occasions, but the proximity to the year low of $1.61 (only
17.6% below current price) suggests limited cushion if $1.80 breaks.
My
long-term, ultra-bearish scenario based on Fibonacci extensions paints an even
grimmer picture. Measuring the downtrend from July to December 2025 and
then the correction we interrupted at the turn of December and January this
year, the 100% Fibonacci extension falls at a level of just under $0.53.
This would
represent the lowest XRP price since November 2024 and a
potential decline of approximately 70% from current levels.
While this is an extreme scenario, it remains technically valid on my
chart if macro conditions worsen significantly, liquidity continues
draining from altcoins, and the broader crypto market enters a full risk-off
cascade.
XRP Price Prediction Roadmap
Target
Level
Decline from Current
Scenario
Chart Basis
Short-term
$1.80
-6% to -7%
Consolidation
lower boundary, immediate test
Tested multiple times, weakening
Medium-term
$1.26
-33%
Flash-crash
low (Oct 10, Binance)
Next
major support if $1.80 breaks
Extreme bearish
$0.53
-70%
100% Fibonacci extension, Nov 2024 lows
July-Dec
downtrend + correction measure
Liquidity Drain Supports
Bear Case
Hasn’s
observation that "liquidity is shrinking across channels" with
spot ETFs seeing minimal inflows and crypto futures open interest dropping
to $128 billion (weakest since early January) aligns perfectly
with the weakness visible on the XRP chart. When institutional
liquidity evaporates, high-beta altcoins like XRP suffer disproportionately.
Maxime
Seiler, CEO at STS Digital, adds that "the broader picture is one
of heavy volatility supply, realized volatility has been subdued, and implied
volatility is likely to remain under pressure until a meaningful catalyst
forces a repricing".
This fits
the grinding, low-volatility breakdown pattern. Price slowly compressing toward
the $1.80 support before an eventual break and acceleration lowerWhy is XRP
falling today?
XRP is
falling today due to technical breakdown risk at $1.80 consolidation support,
continued downtrend from July 2025 line, and shrinking liquidity. Price at
$1.89, down 0.46%, trades 25.9% below 200 EMA at $2.55 and 4.5% below 50 EMA at
$1.98. One senior analyst notes "liquidity is shrinking across
channels" with spot ETFs seeing less than $7 million inflows after $1.3
billion outflows last week. As I documented in my January 21 Finance Magnates
analysis, XRP logged 7 straight down sessions amid $1.7B market-wide
liquidations.
XRP Price Analysis, FAQ
How low can XRP go?
According
to my technical analysis, XRP has three downside targets: short-term $1.80
(consolidation lower boundary, -5% to -6%), medium-term $1.26 (October 10
flash-crash low, -33%), and extreme $0.53 (100% Fibonacci extension, -70% from
current $1.89).
What is XRP price
prediction for 2026?
My XRP
price prediction: near-term test of $1.80 support likely within days, followed
by breakdown to $1.26 medium-term target (-33%) on my chart. If macro worsens
and liquidity drain accelerates, extreme $0.53 Fibonacci target (-70%) remains
valid.
Why is XRP falling after
reaching $3.67?
XRP falling
from year high $3.67 due to downtrend line from July 2025 resistance, failure
to hold above $2.00, and structural bear market. Now at $1.89, down 48.4% from
highs, only 17.6% above year low $1.61.
How low will XRP go if
$1.80 breaks?
If $1.80
consolidation floor breaks cleanly, XRP will target $1.26 (October 10
flash-crash low, -33% from current $1.89).
Damian Chmiel is a Senior Analyst & Editor at Finance Magnates with more than 15 years of experience in the CFD and online trading industry. Active as both a trader and journalist since 2010, he focuses on broker coverage, fintech innovation, and regulatory developments across Europe, the Middle East, and Asia.
His work includes interviews with C-level leaders at major brokerages and fintech platforms, as well as co-authoring Finance Magnates’ quarterly industry benchmarking reports. Damian’s reporting is data-driven, market-aware, and grounded in direct industry engagement. His analysis and commentary have also been cited by external media outlets, including Investing.com, Binance, The Asset, Stockhead, and Dispatch.
Education:
MA in Finance and Accounting, Cracow University of Economics
Inside the Prediction Markets: $1.6B Institutional Inflow Meets a Federal Crackdown
Featured Videos
FP Markets Winner Spotlight 🏆 | Global Broker of the Year 2025 #Trading #Broker #Innovation #Shorts
FP Markets Winner Spotlight 🏆 | Global Broker of the Year 2025 #Trading #Broker #Innovation #Shorts
FP Markets Winner Spotlight 🏆 | Global Broker of the Year 2025 #Trading #Broker #Innovation #Shorts
FP Markets Winner Spotlight 🏆 | Global Broker of the Year 2025 #Trading #Broker #Innovation #Shorts
FP Markets takes the spotlight as Global Broker of the Year 2025 at the Finance Magnates Awards.
Martin Stoilov, Head of Client Experience, shares that trust, innovation, and people played a key role in the company’s success, supported by a strong foundation of integrity and client-centricity.
Following this milestone, FP Markets continues to focus on growth, technology investment, and its core values of transparency and excellence.
👉 Be part of FM Awards 2026: https://awards.financemagnates.com/#nominate
In this video, we review @HolaPrimeMarketsOfficial, a multi-asset forex and CFDs broker offering different account types, trading platforms, and flexible trading conditions.
We cover the broker’s overall offering, including account options, trading environment, platforms like MT4 and MT5, and additional services such as managed accounts and fast withdrawals.
Watch the full video to see if Hola Prime Markets fits your trading needs.
📣 Stay up to date with the latest in finance and trading. Follow Finance Magnates for industry news, insights, and global event coverage.
Connect with us:
🔗 LinkedIn: /financemagnates
👍 Facebook: /financemagnates
📸 Instagram: https://www.instagram.com/financemagnates
🐦 X: https://x.com/financemagnates
🎥 TikTok: https://www.tiktok.com/tag/financemagnates
▶️ YouTube: /@financemagnates_official
#HolaPrime #ForexBroker #CFDTrading #FinanceMagnates #Trading #Forex #BrokerReview
Hola Prime Review: What You Need to Know | Full Breakdown by Finance Magnates
Hola Prime Review: What You Need to Know | Full Breakdown by Finance Magnates
Hola Prime Review: What You Need to Know | Full Breakdown by Finance Magnates
Hola Prime Review: What You Need to Know | Full Breakdown by Finance Magnates
Hola Prime Review: What You Need to Know | Full Breakdown by Finance Magnates
Hola Prime Review: What You Need to Know | Full Breakdown by Finance Magnates
In this video, we review @HolaPrime_Global, a proprietary trading firm offering evaluation programs and performance-based payouts in simulated market environments.
We cover how the challenge model works, including account types, profit splits (up to 95%), trading rules, and what it takes to reach a funded account. You’ll also learn about available platforms like MT4, MT5, cTrader, and more, along with insights into payouts, support, and trading conditions.
Watch the full video to see if Hola Prime fits your trading style.
📣 Stay up to date with the latest in finance and trading. Follow Finance Magnates for industry news, insights, and global event coverage.
Connect with us:
🔗 LinkedIn: /financemagnates
👍 Facebook: /financemagnates
📸 Instagram: https://www.instagram.com/financemagnates
🐦 X: https://x.com/financemagnates
🎥 TikTok: https://www.tiktok.com/tag/financemagnates
▶️ YouTube: /@financemagnates_official
#HolaPrime #PropFirm #Trading #FinanceMagnates #Forex #FuturesTrading #TradingReview #PropFirmReview
Axi Winner Spotlight 🏆 | Global Most Innovative Broker 2025 #Innovation #Trading #Fintech #Broker
Axi Winner Spotlight 🏆 | Global Most Innovative Broker 2025 #Innovation #Trading #Fintech #Broker
Axi Winner Spotlight 🏆 | Global Most Innovative Broker 2025 #Innovation #Trading #Fintech #Broker
Axi Winner Spotlight 🏆 | Global Most Innovative Broker 2025 #Innovation #Trading #Fintech #Broker
Axi Winner Spotlight 🏆 | Global Most Innovative Broker 2025 #Innovation #Trading #Fintech #Broker
Axi Winner Spotlight 🏆 | Global Most Innovative Broker 2025 #Innovation #Trading #Fintech #Broker
Axi takes the spotlight at the Finance Magnates Awards, winning Global Most Innovative Broker 2025.
Olivia Xenofontos and Ivanna Openko share how the team will feel: proud, motivated, and ready to keep delivering.
They also describe the night as well-organized, focused, and enjoyable for all.
👉 Be part of FM Awards 2026.
Recognition that matters.
Built on transparency.
Driven by the industry.
The Finance Magnates Awards 2026.
Nominations are now open.
🔗 https://awards.financemagnates.com/?utm_source=SM&utm_medium=social&utm_campaign=recognition-matters
Recognition that matters.
Built on transparency.
Driven by the industry.
The Finance Magnates Awards 2026.
Nominations are now open.
🔗 https://awards.financemagnates.com/?utm_source=SM&utm_medium=social&utm_campaign=recognition-matters
Recognition that matters.
Built on transparency.
Driven by the industry.
The Finance Magnates Awards 2026.
Nominations are now open.
🔗 https://awards.financemagnates.com/?utm_source=SM&utm_medium=social&utm_campaign=recognition-matters
Recognition that matters.
Built on transparency.
Driven by the industry.
The Finance Magnates Awards 2026.
Nominations are now open.
🔗 https://awards.financemagnates.com/?utm_source=SM&utm_medium=social&utm_campaign=recognition-matters
Recognition that matters.
Built on transparency.
Driven by the industry.
The Finance Magnates Awards 2026.
Nominations are now open.
🔗 https://awards.financemagnates.com/?utm_source=SM&utm_medium=social&utm_campaign=recognition-matters
Recognition that matters.
Built on transparency.
Driven by the industry.
The Finance Magnates Awards 2026.
Nominations are now open.
🔗 https://awards.financemagnates.com/?utm_source=SM&utm_medium=social&utm_campaign=recognition-matters