BTC reached $81,237.94, its highest since May, after completing the first target from last week's chart.
The $81,500-$84,400 resistance zone can trigger a pullback before $98,068 and $100,000 come into view.
Bitcoin token with a candle chart in the background. Source: Shutterstock
Bitcoin rose above $80,000 on Tuesday, August 25, reaching $81,237.94 before trading at $80,323.24 in Asian hours. The intraday high was BTC's strongest level since mid-May, while its August gain reached 28%.
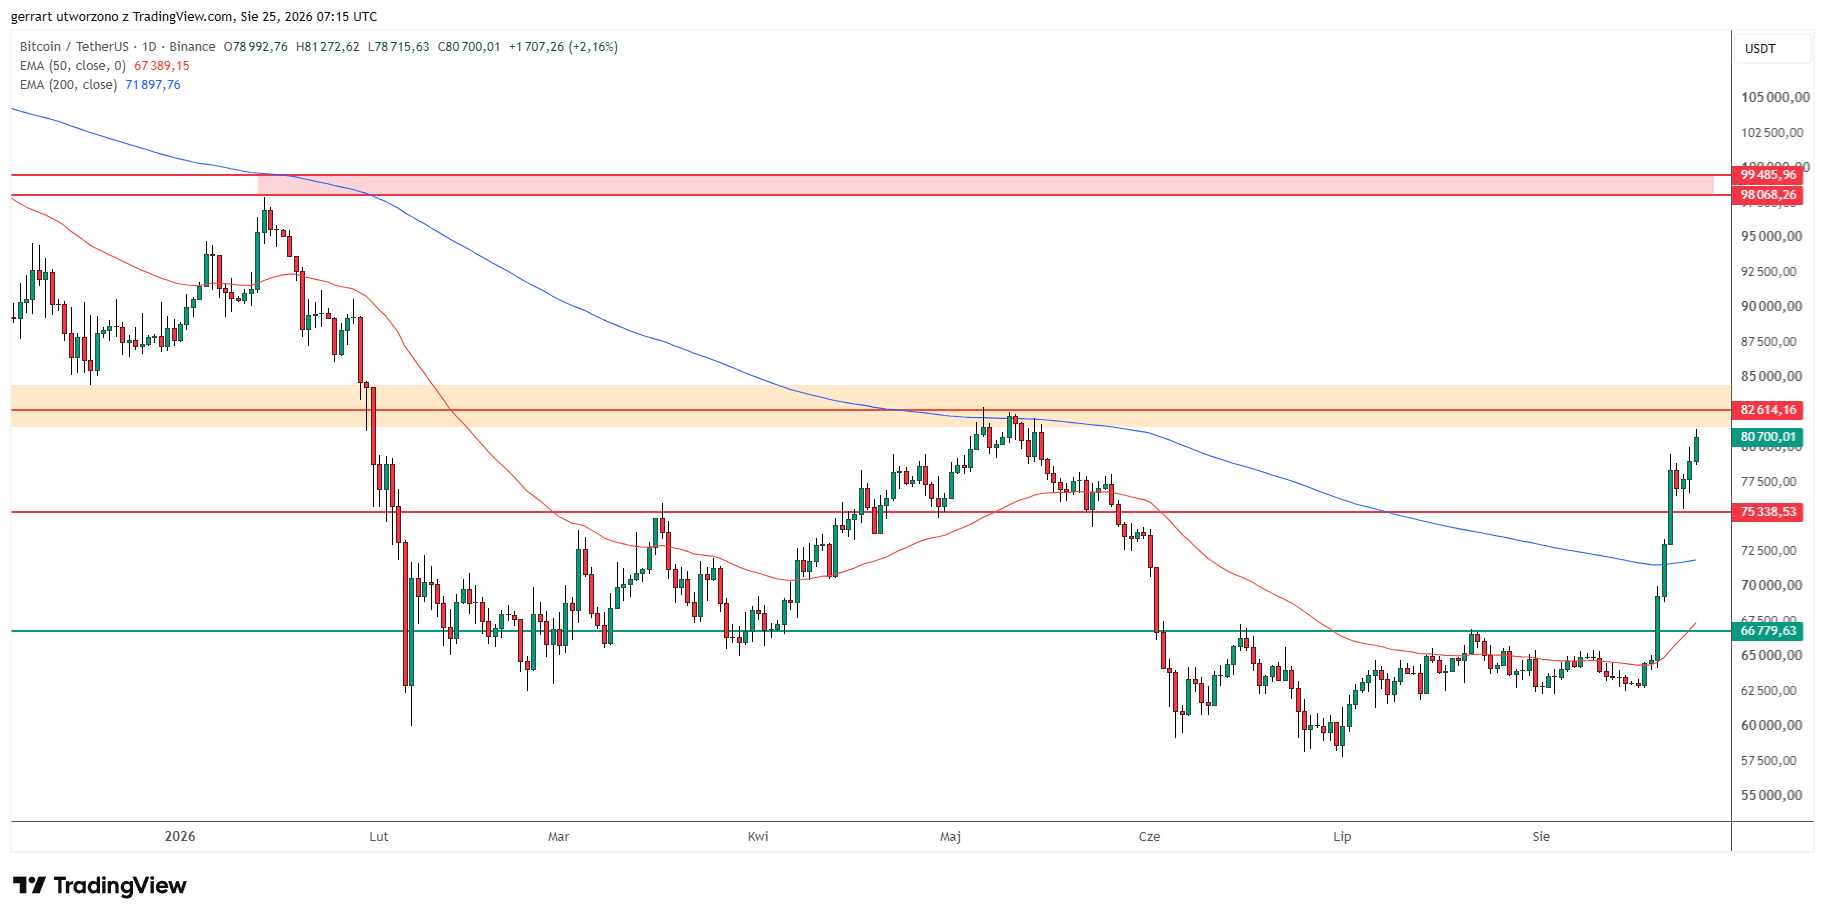
The move completed the first phase of my Bitcoin price prediction from last week. BTC broke its 200-day exponential moving average, cleared the $75,338.53 target the next day and has now put the larger $81,500 to $84,400 resistance zone under pressure.
That zone can still produce a short-term correction. A sustained break above $84,400 would instead put the January high at $98,068.26 and the psychological $100,000 level back in play, an advance of approximately 21% to 23% from Tuesday's intraday high.
Bitcoin Hits Last Week's $75,339 Target
My August 20 analysis identified a daily close above the 200 EMA near $71,541 as the signal that would restore the bullish daily trend. It mapped $75,338.53 as the first resistance, followed by $82,614.16 and then $98,068.26.
How high can Bitcoin price go? Source: Tradingview.com
Tuesday's continuation above $80,000 means the market is now approaching the second target. The earlier point estimate at $82,614 sits inside a broader orange supply zone on my updated chart, running from approximately $81,500 to $84,400.
The lower edge is not yet decisively broken. Tuesday's $81,237.94 high stopped roughly $262 short of it, so the present move is a test of resistance rather than a confirmed breakout through the entire band.
Scenario
Confirmation
Next Levels
Warning or Invalidation
Bullish extension
Daily close above $84,400
$98,068, then $100,000
Return below $80,000
Short-term correction
Rejection inside $81,500-$84,400
$80,000, then $75,339
Recovery above $84,400
Broader breakout failure
Daily close below the 200 EMA near $71,541
Former range support near $66,780
Recovery above the 200 EMA
Can Bitcoin Reach $100,000 From Here?
The $81,500 to $84,400 band combines price reactions from May 2026 with former lows from November and December 2025. This is why I expect sellers to become more active here even though the broader daily trend has turned higher.
A pullback from this area would not automatically cancel the bullish structure. Holding $80,000 would be the first sign that the breakout is consolidating, while the completed $75,338.53 target is the more important support if volatility expands.
If buyers absorb supply above $84,400, my next objective is $98,068.26, the January 14 high identified in last week's analysis. The round $100,000 mark extends that zone and would require a 23.1% rise from Tuesday's $81,237.94 high.
Tony Sycamore, a market analyst at IG, reached a similar conditional conclusion. "A sustained break above here would open the door for a move towards $95,000-$100,000," he told Reuters.
That outside forecast supports the destination, but it does not remove the resistance directly overhead. My chart still requires price to clear $84,400 before the $98,000 to $100,000 path becomes active.
Why Is Bitcoin Rising Above $80,000?
The macro backdrop remains the same catalyst that accompanied last week's technical break. The U.S. Treasury expanded planned buybacks of longer-dated debt, a step markets associated with lower long-term yields, a softer dollar and renewed demand for assets used in the so-called debasement trade.
Regulatory clarity may offer a separate tailwind for institutional activity. "The biggest catalyst for the development of the U.S. institutional derivatives market will be clearly delineating SEC and CFTC oversight," Paul Howard, Senior Director at Wincent, said in commentary shared with FinanceMagnates.com. Adam Haeems, Head of Asset Management at Tesseract Group, cautioned that clarity removes a reason not to act, but does not itself create institutional demand.
Part of the rally was mechanical, however. More than $4 billion of short positions were liquidated during last week's surge, forcing bearish traders to buy back exposure as the price rose. That can accelerate a breakout, but it also leaves a test for whether spot and ETF demand can maintain the move once forced buying fades.
What Would Weaken the Bitcoin Breakout?
The immediate test is a daily hold above $80,000. A close back below the round level would favor the short-term correction scenario and return attention to $75,338.53.
The larger trend reversal has more room. Bitcoin remains well above the 200-day EMA near $71,541 that activated last week's call. A daily close back below that average would materially weaken the bullish setup and bring the former $66,780 range ceiling back into view.
Bitcoin rose above $80,000 on Tuesday, August 25, reaching $81,237.94 before trading at $80,323.24 in Asian hours. The intraday high was BTC's strongest level since mid-May, while its August gain reached 28%.
The move completed the first phase of my Bitcoin price prediction from last week. BTC broke its 200-day exponential moving average, cleared the $75,338.53 target the next day and has now put the larger $81,500 to $84,400 resistance zone under pressure.
That zone can still produce a short-term correction. A sustained break above $84,400 would instead put the January high at $98,068.26 and the psychological $100,000 level back in play, an advance of approximately 21% to 23% from Tuesday's intraday high.
Bitcoin Hits Last Week's $75,339 Target
My August 20 analysis identified a daily close above the 200 EMA near $71,541 as the signal that would restore the bullish daily trend. It mapped $75,338.53 as the first resistance, followed by $82,614.16 and then $98,068.26.
How high can Bitcoin price go? Source: Tradingview.com
Tuesday's continuation above $80,000 means the market is now approaching the second target. The earlier point estimate at $82,614 sits inside a broader orange supply zone on my updated chart, running from approximately $81,500 to $84,400.
The lower edge is not yet decisively broken. Tuesday's $81,237.94 high stopped roughly $262 short of it, so the present move is a test of resistance rather than a confirmed breakout through the entire band.
Scenario
Confirmation
Next Levels
Warning or Invalidation
Bullish extension
Daily close above $84,400
$98,068, then $100,000
Return below $80,000
Short-term correction
Rejection inside $81,500-$84,400
$80,000, then $75,339
Recovery above $84,400
Broader breakout failure
Daily close below the 200 EMA near $71,541
Former range support near $66,780
Recovery above the 200 EMA
Can Bitcoin Reach $100,000 From Here?
The $81,500 to $84,400 band combines price reactions from May 2026 with former lows from November and December 2025. This is why I expect sellers to become more active here even though the broader daily trend has turned higher.
A pullback from this area would not automatically cancel the bullish structure. Holding $80,000 would be the first sign that the breakout is consolidating, while the completed $75,338.53 target is the more important support if volatility expands.
If buyers absorb supply above $84,400, my next objective is $98,068.26, the January 14 high identified in last week's analysis. The round $100,000 mark extends that zone and would require a 23.1% rise from Tuesday's $81,237.94 high.
Tony Sycamore, a market analyst at IG, reached a similar conditional conclusion. "A sustained break above here would open the door for a move towards $95,000-$100,000," he told Reuters.
That outside forecast supports the destination, but it does not remove the resistance directly overhead. My chart still requires price to clear $84,400 before the $98,000 to $100,000 path becomes active.
Why Is Bitcoin Rising Above $80,000?
The macro backdrop remains the same catalyst that accompanied last week's technical break. The U.S. Treasury expanded planned buybacks of longer-dated debt, a step markets associated with lower long-term yields, a softer dollar and renewed demand for assets used in the so-called debasement trade.
Regulatory clarity may offer a separate tailwind for institutional activity. "The biggest catalyst for the development of the U.S. institutional derivatives market will be clearly delineating SEC and CFTC oversight," Paul Howard, Senior Director at Wincent, said in commentary shared with FinanceMagnates.com. Adam Haeems, Head of Asset Management at Tesseract Group, cautioned that clarity removes a reason not to act, but does not itself create institutional demand.
Part of the rally was mechanical, however. More than $4 billion of short positions were liquidated during last week's surge, forcing bearish traders to buy back exposure as the price rose. That can accelerate a breakout, but it also leaves a test for whether spot and ETF demand can maintain the move once forced buying fades.
What Would Weaken the Bitcoin Breakout?
The immediate test is a daily hold above $80,000. A close back below the round level would favor the short-term correction scenario and return attention to $75,338.53.
The larger trend reversal has more room. Bitcoin remains well above the 200-day EMA near $71,541 that activated last week's call. A daily close back below that average would materially weaken the bullish setup and bring the former $66,780 range ceiling back into view.
Damian Chmiel is a Senior Analyst & Editor at Finance Magnates with more than 15 years of experience in the CFD and online trading industry. Active as both a trader and journalist since 2010, he focuses on broker coverage, fintech innovation, and regulatory developments across Europe, the Middle East, and Asia.
His work includes interviews with C-level leaders at major brokerages and fintech platforms, as well as co-authoring Finance Magnates’ quarterly industry benchmarking reports. Damian’s reporting is data-driven, market-aware, and grounded in direct industry engagement. His analysis and commentary have also been cited by external media outlets, including Investing.com, Binance, The Asset, Stockhead, and Dispatch.
Education:
MA in Finance and Accounting, Cracow University of Economics
This Bitcoin Price Prediction Shows Golden Cross Could Push BTC 28% to $100K
Featured Videos
IG Group Tech Chiefs Exit; Pepperstone Revenue Grows
IG Group Tech Chiefs Exit; Pepperstone Revenue Grows
IG Group Tech Chiefs Exit; Pepperstone Revenue Grows
IG Group Tech Chiefs Exit; Pepperstone Revenue Grows
Today’s financial news recap covers IG Group loses two technology chiefs, Pepperstone reports double-digit growth, and eToro backs a euro stablecoin.
Finance Magnates Daily Recap brings you the latest news from forex and CFD brokers, fintech, payments, cryptocurrency, digital assets, trading platforms, financial regulation and global markets.
Get the key company news, executive moves, deals, regulatory updates and market developments of the day, in just a few minutes. New episodes published every weekday.
Read more: https://www.financemagnates.com
#FinanceMagnates #ForexNews #FintechNews
Today’s financial news recap covers IG Group loses two technology chiefs, Pepperstone reports double-digit growth, and eToro backs a euro stablecoin.
Finance Magnates Daily Recap brings you the latest news from forex and CFD brokers, fintech, payments, cryptocurrency, digital assets, trading platforms, financial regulation and global markets.
Get the key company news, executive moves, deals, regulatory updates and market developments of the day, in just a few minutes. New episodes published every weekday.
Read more: https://www.financemagnates.com
#FinanceMagnates #ForexNews #FintechNews
Today’s financial news recap covers IG Group loses two technology chiefs, Pepperstone reports double-digit growth, and eToro backs a euro stablecoin.
Finance Magnates Daily Recap brings you the latest news from forex and CFD brokers, fintech, payments, cryptocurrency, digital assets, trading platforms, financial regulation and global markets.
Get the key company news, executive moves, deals, regulatory updates and market developments of the day, in just a few minutes. New episodes published every weekday.
Read more: https://www.financemagnates.com
#FinanceMagnates #ForexNews #FintechNews
Today’s financial news recap covers IG Group loses two technology chiefs, Pepperstone reports double-digit growth, and eToro backs a euro stablecoin.
Finance Magnates Daily Recap brings you the latest news from forex and CFD brokers, fintech, payments, cryptocurrency, digital assets, trading platforms, financial regulation and global markets.
Get the key company news, executive moves, deals, regulatory updates and market developments of the day, in just a few minutes. New episodes published every weekday.
Read more: https://www.financemagnates.com
#FinanceMagnates #ForexNews #FintechNews
Today’s financial news recap covers IG Group expects lower Q3 revenue, MetaQuotes adds Benzinga news, Match-Trader launches an MCP, and brokers weigh build versus buy.
Finance Magnates Daily Recap brings you the latest news from forex and CFD brokers, fintech, payments, cryptocurrency, digital assets, trading platforms, financial regulation and global markets.
Get the key company news, executive moves, deals, regulatory updates and market developments of the day, in just a few minutes. New episodes published every weekday.
Read more: https://www.financemagnates.com
#FinanceMagnates #ForexNews #FintechNews
Today’s financial news recap covers IG Group expects lower Q3 revenue, MetaQuotes adds Benzinga news, Match-Trader launches an MCP, and brokers weigh build versus buy.
Finance Magnates Daily Recap brings you the latest news from forex and CFD brokers, fintech, payments, cryptocurrency, digital assets, trading platforms, financial regulation and global markets.
Get the key company news, executive moves, deals, regulatory updates and market developments of the day, in just a few minutes. New episodes published every weekday.
Read more: https://www.financemagnates.com
#FinanceMagnates #ForexNews #FintechNews
Today’s financial news recap covers IG Group expects lower Q3 revenue, MetaQuotes adds Benzinga news, Match-Trader launches an MCP, and brokers weigh build versus buy.
Finance Magnates Daily Recap brings you the latest news from forex and CFD brokers, fintech, payments, cryptocurrency, digital assets, trading platforms, financial regulation and global markets.
Get the key company news, executive moves, deals, regulatory updates and market developments of the day, in just a few minutes. New episodes published every weekday.
Read more: https://www.financemagnates.com
#FinanceMagnates #ForexNews #FintechNews
Today’s financial news recap covers IG Group expects lower Q3 revenue, MetaQuotes adds Benzinga news, Match-Trader launches an MCP, and brokers weigh build versus buy.
Finance Magnates Daily Recap brings you the latest news from forex and CFD brokers, fintech, payments, cryptocurrency, digital assets, trading platforms, financial regulation and global markets.
Get the key company news, executive moves, deals, regulatory updates and market developments of the day, in just a few minutes. New episodes published every weekday.
Read more: https://www.financemagnates.com
#FinanceMagnates #ForexNews #FintechNews
Today’s financial news recap covers IG Group expects lower Q3 revenue, MetaQuotes adds Benzinga news, Match-Trader launches an MCP, and brokers weigh build versus buy.
Finance Magnates Daily Recap brings you the latest news from forex and CFD brokers, fintech, payments, cryptocurrency, digital assets, trading platforms, financial regulation and global markets.
Get the key company news, executive moves, deals, regulatory updates and market developments of the day, in just a few minutes. New episodes published every weekday.
Read more: https://www.financemagnates.com
#FinanceMagnates #ForexNews #FintechNews
Today’s financial news recap covers IG Group expects lower Q3 revenue, MetaQuotes adds Benzinga news, Match-Trader launches an MCP, and brokers weigh build versus buy.
Finance Magnates Daily Recap brings you the latest news from forex and CFD brokers, fintech, payments, cryptocurrency, digital assets, trading platforms, financial regulation and global markets.
Get the key company news, executive moves, deals, regulatory updates and market developments of the day, in just a few minutes. New episodes published every weekday.
Read more: https://www.financemagnates.com
#FinanceMagnates #ForexNews #FintechNews
Binance Faces EU Scrutiny; CFI Adds Seven-Day Gold Trading
Binance Faces EU Scrutiny; CFI Adds Seven-Day Gold Trading
Binance Faces EU Scrutiny; CFI Adds Seven-Day Gold Trading
Binance Faces EU Scrutiny; CFI Adds Seven-Day Gold Trading
Binance Faces EU Scrutiny; CFI Adds Seven-Day Gold Trading
Binance Faces EU Scrutiny; CFI Adds Seven-Day Gold Trading
Today’s financial news recap covers EU regulators question Binance's use of reverse solicitation, CFI launches seven-day gold trading, the FCA opens a crypto authorisation window, and Polymarket adds trading safeguards.
Finance Magnates Daily Recap brings you the latest news from forex and CFD brokers, fintech, payments, cryptocurrency, digital assets, trading platforms, financial regulation and global markets.
Get the key company news, executive moves, deals, regulatory updates and market developments of the day, in just a few minutes. New episodes published every weekday.
Read more: https://www.financemagnates.com
#FinanceMagnates #ForexNews #FintechNews
Today’s financial news recap covers EU regulators question Binance's use of reverse solicitation, CFI launches seven-day gold trading, the FCA opens a crypto authorisation window, and Polymarket adds trading safeguards.
Finance Magnates Daily Recap brings you the latest news from forex and CFD brokers, fintech, payments, cryptocurrency, digital assets, trading platforms, financial regulation and global markets.
Get the key company news, executive moves, deals, regulatory updates and market developments of the day, in just a few minutes. New episodes published every weekday.
Read more: https://www.financemagnates.com
#FinanceMagnates #ForexNews #FintechNews
Today’s financial news recap covers EU regulators question Binance's use of reverse solicitation, CFI launches seven-day gold trading, the FCA opens a crypto authorisation window, and Polymarket adds trading safeguards.
Finance Magnates Daily Recap brings you the latest news from forex and CFD brokers, fintech, payments, cryptocurrency, digital assets, trading platforms, financial regulation and global markets.
Get the key company news, executive moves, deals, regulatory updates and market developments of the day, in just a few minutes. New episodes published every weekday.
Read more: https://www.financemagnates.com
#FinanceMagnates #ForexNews #FintechNews
Today’s financial news recap covers EU regulators question Binance's use of reverse solicitation, CFI launches seven-day gold trading, the FCA opens a crypto authorisation window, and Polymarket adds trading safeguards.
Finance Magnates Daily Recap brings you the latest news from forex and CFD brokers, fintech, payments, cryptocurrency, digital assets, trading platforms, financial regulation and global markets.
Get the key company news, executive moves, deals, regulatory updates and market developments of the day, in just a few minutes. New episodes published every weekday.
Read more: https://www.financemagnates.com
#FinanceMagnates #ForexNews #FintechNews
Today’s financial news recap covers EU regulators question Binance's use of reverse solicitation, CFI launches seven-day gold trading, the FCA opens a crypto authorisation window, and Polymarket adds trading safeguards.
Finance Magnates Daily Recap brings you the latest news from forex and CFD brokers, fintech, payments, cryptocurrency, digital assets, trading platforms, financial regulation and global markets.
Get the key company news, executive moves, deals, regulatory updates and market developments of the day, in just a few minutes. New episodes published every weekday.
Read more: https://www.financemagnates.com
#FinanceMagnates #ForexNews #FintechNews
Today’s financial news recap covers EU regulators question Binance's use of reverse solicitation, CFI launches seven-day gold trading, the FCA opens a crypto authorisation window, and Polymarket adds trading safeguards.
Finance Magnates Daily Recap brings you the latest news from forex and CFD brokers, fintech, payments, cryptocurrency, digital assets, trading platforms, financial regulation and global markets.
Get the key company news, executive moves, deals, regulatory updates and market developments of the day, in just a few minutes. New episodes published every weekday.
Read more: https://www.financemagnates.com
#FinanceMagnates #ForexNews #FintechNews
The5ers Connects Trading Accounts to AI; EC Markets Doubles UK Revenue
The5ers Connects Trading Accounts to AI; EC Markets Doubles UK Revenue
The5ers Connects Trading Accounts to AI; EC Markets Doubles UK Revenue
The5ers Connects Trading Accounts to AI; EC Markets Doubles UK Revenue
The5ers Connects Trading Accounts to AI; EC Markets Doubles UK Revenue
The5ers Connects Trading Accounts to AI; EC Markets Doubles UK Revenue
Today’s financial news recap covers The5ers connects trading accounts to ChatGPT and Claude, EC Markets doubles UK revenue, ThinkMarkets returns to profit, and Alpaca advances its Southeast Asia expansion.
Finance Magnates Daily Recap brings you the latest news from forex and CFD brokers, fintech, payments, cryptocurrency, digital assets, trading platforms, financial regulation and global markets.
Get the key company news, executive moves, deals, regulatory updates and market developments of the day, in just a few minutes. New episodes published every weekday.
Read more: https://www.financemagnates.com
#FinanceMagnates #ForexNews #FintechNews
Today’s financial news recap covers The5ers connects trading accounts to ChatGPT and Claude, EC Markets doubles UK revenue, ThinkMarkets returns to profit, and Alpaca advances its Southeast Asia expansion.
Finance Magnates Daily Recap brings you the latest news from forex and CFD brokers, fintech, payments, cryptocurrency, digital assets, trading platforms, financial regulation and global markets.
Get the key company news, executive moves, deals, regulatory updates and market developments of the day, in just a few minutes. New episodes published every weekday.
Read more: https://www.financemagnates.com
#FinanceMagnates #ForexNews #FintechNews
Today’s financial news recap covers The5ers connects trading accounts to ChatGPT and Claude, EC Markets doubles UK revenue, ThinkMarkets returns to profit, and Alpaca advances its Southeast Asia expansion.
Finance Magnates Daily Recap brings you the latest news from forex and CFD brokers, fintech, payments, cryptocurrency, digital assets, trading platforms, financial regulation and global markets.
Get the key company news, executive moves, deals, regulatory updates and market developments of the day, in just a few minutes. New episodes published every weekday.
Read more: https://www.financemagnates.com
#FinanceMagnates #ForexNews #FintechNews
Today’s financial news recap covers The5ers connects trading accounts to ChatGPT and Claude, EC Markets doubles UK revenue, ThinkMarkets returns to profit, and Alpaca advances its Southeast Asia expansion.
Finance Magnates Daily Recap brings you the latest news from forex and CFD brokers, fintech, payments, cryptocurrency, digital assets, trading platforms, financial regulation and global markets.
Get the key company news, executive moves, deals, regulatory updates and market developments of the day, in just a few minutes. New episodes published every weekday.
Read more: https://www.financemagnates.com
#FinanceMagnates #ForexNews #FintechNews
Today’s financial news recap covers The5ers connects trading accounts to ChatGPT and Claude, EC Markets doubles UK revenue, ThinkMarkets returns to profit, and Alpaca advances its Southeast Asia expansion.
Finance Magnates Daily Recap brings you the latest news from forex and CFD brokers, fintech, payments, cryptocurrency, digital assets, trading platforms, financial regulation and global markets.
Get the key company news, executive moves, deals, regulatory updates and market developments of the day, in just a few minutes. New episodes published every weekday.
Read more: https://www.financemagnates.com
#FinanceMagnates #ForexNews #FintechNews
Today’s financial news recap covers The5ers connects trading accounts to ChatGPT and Claude, EC Markets doubles UK revenue, ThinkMarkets returns to profit, and Alpaca advances its Southeast Asia expansion.
Finance Magnates Daily Recap brings you the latest news from forex and CFD brokers, fintech, payments, cryptocurrency, digital assets, trading platforms, financial regulation and global markets.
Get the key company news, executive moves, deals, regulatory updates and market developments of the day, in just a few minutes. New episodes published every weekday.
Read more: https://www.financemagnates.com
#FinanceMagnates #ForexNews #FintechNews
MyForexFunds Brand Rights Sold; FundedSeat Closes
MyForexFunds Brand Rights Sold; FundedSeat Closes
MyForexFunds Brand Rights Sold; FundedSeat Closes
MyForexFunds Brand Rights Sold; FundedSeat Closes
MyForexFunds Brand Rights Sold; FundedSeat Closes
MyForexFunds Brand Rights Sold; FundedSeat Closes
Today’s financial news recap covers MyForexFunds' brand assets are sold to a Dubai-based firm, FundedSeat closes, Valbury adds DXtrade, and Germany expands its fight against trading fraud.
Finance Magnates Daily Recap brings you the latest news from forex and CFD brokers, fintech, payments, cryptocurrency, digital assets, trading platforms, financial regulation and global markets.
Get the key company news, executive moves, deals, regulatory updates and market developments of the day, in just a few minutes. New episodes published every weekday.
Read more: https://www.financemagnates.com
#FinanceMagnates #ForexNews #FintechNews
Today’s financial news recap covers MyForexFunds' brand assets are sold to a Dubai-based firm, FundedSeat closes, Valbury adds DXtrade, and Germany expands its fight against trading fraud.
Finance Magnates Daily Recap brings you the latest news from forex and CFD brokers, fintech, payments, cryptocurrency, digital assets, trading platforms, financial regulation and global markets.
Get the key company news, executive moves, deals, regulatory updates and market developments of the day, in just a few minutes. New episodes published every weekday.
Read more: https://www.financemagnates.com
#FinanceMagnates #ForexNews #FintechNews
Today’s financial news recap covers MyForexFunds' brand assets are sold to a Dubai-based firm, FundedSeat closes, Valbury adds DXtrade, and Germany expands its fight against trading fraud.
Finance Magnates Daily Recap brings you the latest news from forex and CFD brokers, fintech, payments, cryptocurrency, digital assets, trading platforms, financial regulation and global markets.
Get the key company news, executive moves, deals, regulatory updates and market developments of the day, in just a few minutes. New episodes published every weekday.
Read more: https://www.financemagnates.com
#FinanceMagnates #ForexNews #FintechNews
Today’s financial news recap covers MyForexFunds' brand assets are sold to a Dubai-based firm, FundedSeat closes, Valbury adds DXtrade, and Germany expands its fight against trading fraud.
Finance Magnates Daily Recap brings you the latest news from forex and CFD brokers, fintech, payments, cryptocurrency, digital assets, trading platforms, financial regulation and global markets.
Get the key company news, executive moves, deals, regulatory updates and market developments of the day, in just a few minutes. New episodes published every weekday.
Read more: https://www.financemagnates.com
#FinanceMagnates #ForexNews #FintechNews
Today’s financial news recap covers MyForexFunds' brand assets are sold to a Dubai-based firm, FundedSeat closes, Valbury adds DXtrade, and Germany expands its fight against trading fraud.
Finance Magnates Daily Recap brings you the latest news from forex and CFD brokers, fintech, payments, cryptocurrency, digital assets, trading platforms, financial regulation and global markets.
Get the key company news, executive moves, deals, regulatory updates and market developments of the day, in just a few minutes. New episodes published every weekday.
Read more: https://www.financemagnates.com
#FinanceMagnates #ForexNews #FintechNews
Today’s financial news recap covers MyForexFunds' brand assets are sold to a Dubai-based firm, FundedSeat closes, Valbury adds DXtrade, and Germany expands its fight against trading fraud.
Finance Magnates Daily Recap brings you the latest news from forex and CFD brokers, fintech, payments, cryptocurrency, digital assets, trading platforms, financial regulation and global markets.
Get the key company news, executive moves, deals, regulatory updates and market developments of the day, in just a few minutes. New episodes published every weekday.
Read more: https://www.financemagnates.com
#FinanceMagnates #ForexNews #FintechNews