Gold crashed 8% to $4,941 and silver plunged 17% to $95 on January 30, 2026, the worst single-day decline since 2013.
Despite the brutal selloff, gold remains up 18% year-to-date while silver holds 40% gains.
Moreover, the major banks maintain bullish targets of $5,400-$6,200 for gold.
Why gold price and silver price are falling today? Let's check XAU and XAG charts
Gold
plunged as much as 8% on Friday, January 30, 2026, testing $4,941
per ounce level during European trading hours. Silver price experienced
an even more dramatic collapse, crashing over 17% from
Thursday's peak of $120 down to $95 per ounce in
what traders described as a "capitulation event".
While both
metals have recovered slightly from their intraday lows, gold now trading
around $5,180 (down 4.77%) and silver hovering just below the
psychological $100 level, the volatility remains extremely
elevated. This sudden reversal comes mere hours after both metals tested
all-time highs: gold touched $5,595 and silver reached $120.45
per ounce on Thursday.
The crash
represents the most severe single-day decline in over a decade for
both metals. In this article, I examine why silver price is falling and why
gold is going down, analyzing XAU/USD and XAG/USD charts.
Silver and Gold Price:
When Did Metals Last Fall This Hard?
The
magnitude of Friday's collapse rivals the worst single-day crashes in modern
precious metals history. The last time gold fell with comparable force
was April 15, 2013, when it plummeted 9% (losing
$140.30) to $1,361.10. the biggest one-day fall in 30 years at
that time. On that same infamous day, silver crashed 11%, shedding
$2.97 to close at $23.361 per ounce.
Silver's
trauma is even fresher. On December 29, 2025, the white metal
logged its worst day since February 2021, plunging 8.7% after
breaching $80 per ounce. The intraday swing was even more vicious—15%
peak-to-trough, representing the biggest high-to-low change going
back to August 2020, when silver dropped 16.85%.
Follow
me on X for more gold, silver and commodity market analysis: @ChmielDk
Why Silver And Gold Prices
Are Going Down?
Friday's
precious metals massacre isn't the result of a single catalyst but rather a
perfect storm of powerful forces that simultaneously hammered the market after
months of uninterrupted gains.
Fed Chair Uncertainty
Triggers Risk Reassessment
President
Trump's announcement that he would name a new Federal Reserve Chair on Friday
created immediate market turbulence. Speculation centered on Kevin
Warsh, a former Fed governor known for advocating "regime change"
at the central bank and calling for lower interest rates. The uncertainty
around monetary policy direction triggered a broad repricing of non-yielding
assets like gold and silver.
Konstantinos
Chrysikos, Head of Customer Relationship Management at Kudotrade, explained
that "gold pulled back toward the USD 5,000 level on Friday, as
investors reassessed positioning ahead of the expected announcement of the next
chair of the Federal Reserve." Despite the dramatic intraday
correction, he emphasized the metal "remains on track to close both
the week and the month higher."
Profit-Taking After
Record-Breaking Rally
Gold had
tested $5,595 per ounce just hours before the crash, while
silver touched $120.45, both representing all-time highs achieved
on January 29. After seven consecutive sessions of gains and
gold's 20%+ monthly surge marking its strongest performance in
decades, the market was severely overextended.
Ahmad
Assiri, Research Strategist at Pepperstone, provided crucial context: "gold
has gained more than 20% since the start of the month, marking its strongest
monthly performance in decades. Moves of this magnitude are rare and are
certainly not the result of short term speculation alone. They point instead to
a genuine reallocation of capital."
Government Shutdown
Averted - Removing One Gold Tailwind
Kathleen
Brooks, Research Director at XTB, observed that "the momentum rally
faces challenges at dizzy heights" after "extreme price
moves across asset classes on Thursday." She highlighted that "the
prospect of another US government shutdown appears to have been averted" through
a bipartisan funding deal.
Brooks
noted this development "should be good for risk sentiment, and it
is a massive relief for consumer and business confidence as we move through
Q1." Paradoxically, reduced political chaos removed one of gold's
key support pillars, the fear premium that had been priced into the metal
throughout January.
Dollar Weakness Paradox
and Positioning Reassessment
Assiri
highlighted a critical market anomaly: the US dollar is "trading
near its lowest levels in years, around levels last seen in early 2022." This
move "cannot be explained solely by interest rate differentials
but also reflects a confidence issue tied to recent actions and signals from
the US administration".
Silver and Gold Technical
Analysis: Critical Support and Resistance Levels
The violent
price action has reset the technical landscape for both metals, with key levels
now coming into sharp focus that will determine whether this correction extends
or finds a floor.
The sudden
drop follows Thursday's test of historical highs at the $5,600 level,
after which came the long-awaited downward correction and profit-taking. So
far, however, we have stopped at the psychological level of $5,000,
which will now likely play the role of an important support level.
Gold has
behind it as many as seven consecutive up sessions, and even
despite this correction, it is still up 18% in 2026 alone.
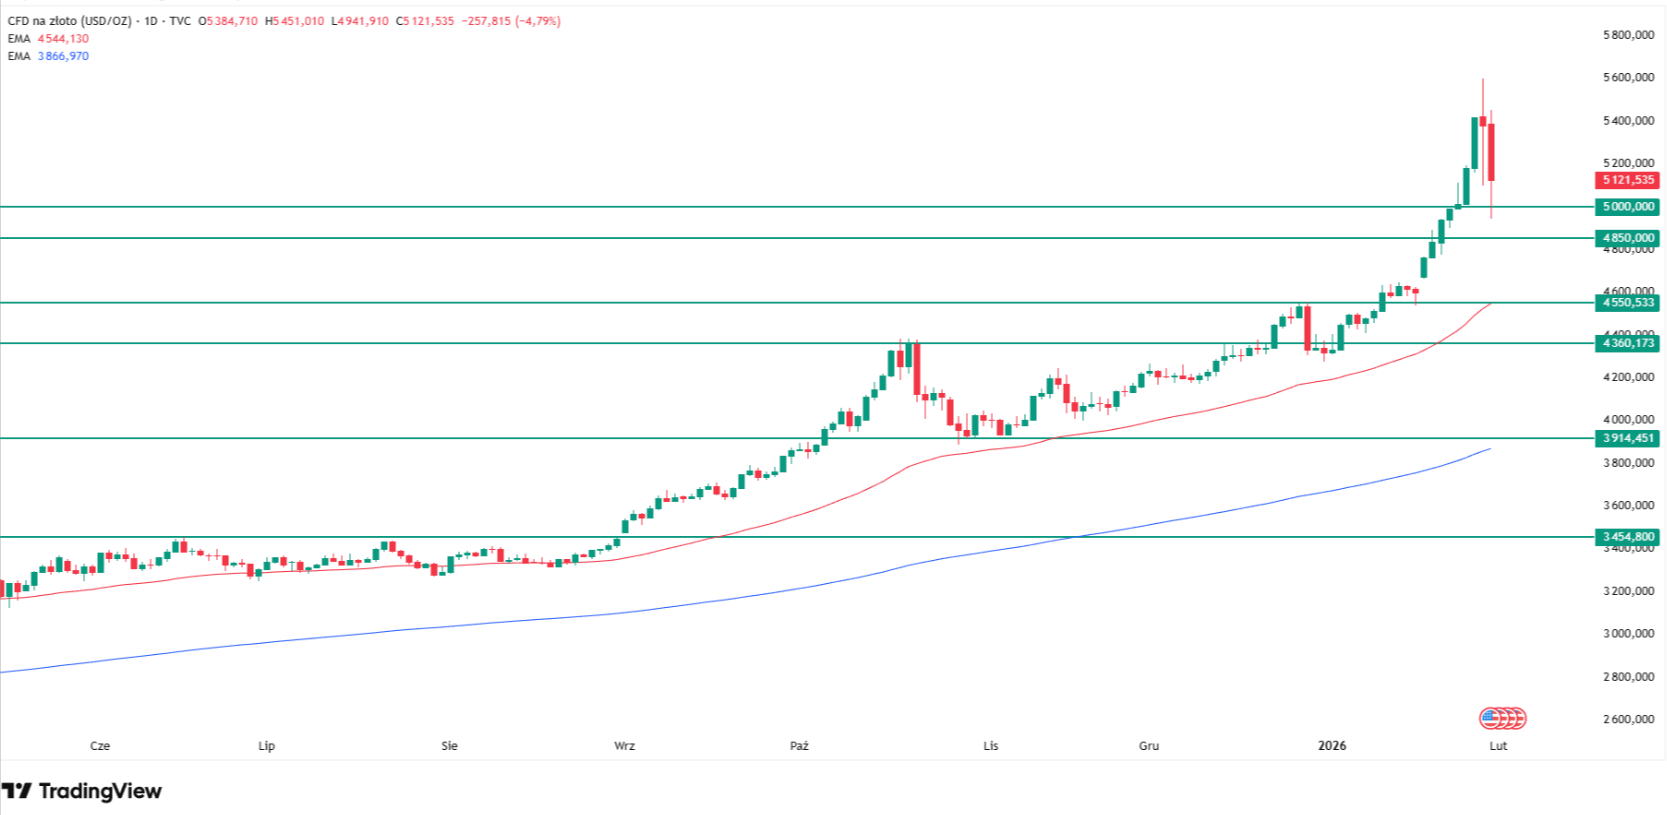
Why gold is going down today? Source: Tradingview.com
Key
Question: Will $5,000 hold
the decline, or will selling accelerate?
According
to my technical analysis, if gold continues falling, my
critical support zone centers on $4,550, representing late 2025
highs that coincide with the 50-day exponential moving average (50 EMA).
This zone extends down to $4,360 per ounce, the October 2025 peak.
We've
finally established a clear resistance zone at $5,400-5,450 per ounce—the
area where Thursday's all-time high was rejected.
Silver's Technical Structure
Silver on Friday is down
just under 14%. At a critical moment during the session, however,
it plunged by over 17%, starting from the $120 level and
stopping near the round psychological support level of $100 per ounce.
Throughout this period, silver is still up approximately 40%
year-to-date.
Why silver is going down today? Source: Tradingview.com
Resistance
zone on
silver's chart is currently defined by peaks first tested on January 26 in
the $112-117 range.
My primary
support at $100 per ounce extends down to $93, the January
14 peak. Even if silver breaks lower, we have another broad support
zone between $70-80 per ounce, established by late 2025 highs and
reinforced by the 50-day exponential moving average (50 EMA).
Key Technical Levels Table
Metal
Current Price
Intraday Low
Key Support
Extended Support
Resistance
Gold
$5,090
$4,941
$5,000
$4,550-$4,360 (50 EMA)
$5,400-$5,450
Silver
$100
$95
$100
$93-$70 (50 EMA zone)
$112-$117
The
technical picture suggests both metals are testing critical psychological
levels that held during the December correction. Gold's ability to maintain
above $5,000 and silver's defense of $100 will
be crucial in determining whether this represents a buyable dip or the start of
a deeper retracement toward the extended support zones.
What Happens Next? Price
Predictions for Gold and Silver
Bull Case: Support Holds,
December Playbook Repeats
If gold
stabilizes above $5,000 and silver defends $100,
we could see a scenario similar to mid-December when both metals bounced
sharply from comparable technical levels. The fundamental drivers remain
powerfully supportive:
Central bank buying continues unabated, with
the Polish central bank leading recent accumulation
Dollar weakness at multi-year lows (near
early 2022 levels) despite Fed policy uncertainty
Geopolitical fragmentation accelerating with
EU-India trade deals and UK-China dialogue
ETF inflows remained robust
throughout January despite today's selloff
Both metals remain dramatically
higher year-to-date (+18% gold, +40% silver)
Bear Case: Extended
Correction to Test Deeper Support
If $5,000
fails for gold or $100 breaks for silver, the next
support zones come into focus:
Gold: $4,550-$4,360 (50 EMA
confluence with late 2025/October 2025 peaks)
Silver: $93 down to $70-$80 (50
EMA zone, late 2025 highs)
A decline
to these levels would represent a 10-15% correction from current prices—painful
but historically normal after 20%+ monthly rallies. The April 2013 crash saw
gold fall 25% over several months before finding a bottom,
though that occurred in a very different fundamental environment.
Gold and Silver Price
Predictions Table
Gold Price Forecasts for 2026
Institution
Target Price
Timeframe
Previous Forecast
Key Drivers
UBS
$6,200
Q1-Q3 2026
$5,000
Historic
investment demand, central bank buying, geopolitical risks
45-year
cup-and-handle breakout, fiat currency pressure
FAQ: Gold and Silver Crash
Explained
Why is gold falling today?
Gold fell
as much as 8% on January 30, 2026 due to profit-taking after hitting $5,595
(all-time high) Thursday, combined with uncertainty around President Trump's
Fed Chair announcement. Kevin Warsh's expected nomination signals potentially
less aggressive monetary stimulus, pressuring non-yielding assets. Despite the
correction, gold remains up 18% year-to-date.
What is the gold price
now?
As of
Friday afternoon European time, gold trades around $5,180 per ounce,
down 4.77% from Thursday's close but recovered from an intraday low of $4,941.
The metal is testing critical psychological support at $5,000.
Why is silver crashing
today?
Silver
plunged 17% peak-to-trough (from $120 to $95) in history's most volatile
session since August 2020. The crash reflects extreme profit-taking after
silver's 40% year-to-date gain, Fed Chair uncertainty, and silver's typical
pattern of amplifying gold's moves. The metal currently trades just below $100.
Will gold fall below
$5,000?
If $5,000
fails, the next major support sits at $4,550-$4,360 (50-day
EMA zone, late 2025 highs). However, experts like Pepperstone's Ahmad Assiri
note corrections after 20%+ rallies are "normal and unlikely to be
deep" absent major shifts in geopolitics or dollar strength. Central bank
buying and ETF inflows remain supportive.
When was the last time
gold and silver fell this hard?
Gold's 8%
drop matches the April 15, 2013 crash (-9%, biggest in 30 years) and exceeds
October 2025's -6% decline. Silver's 17% plunge surpasses December 29, 2025
(-8.7%), August 2020 (-16.85%), and approaches only March 2020 COVID panic
levels. This ranks among the worst precious metals crashes in modern history.
Should I buy gold now?
This
depends entirely on your risk tolerance and time horizon. Current prices offer
a 10-15% discount from Thursday's highs, and fundamental drivers (dollar
weakness, geopolitical fragmentation, central bank buying) remain intact.
Gold
plunged as much as 8% on Friday, January 30, 2026, testing $4,941
per ounce level during European trading hours. Silver price experienced
an even more dramatic collapse, crashing over 17% from
Thursday's peak of $120 down to $95 per ounce in
what traders described as a "capitulation event".
While both
metals have recovered slightly from their intraday lows, gold now trading
around $5,180 (down 4.77%) and silver hovering just below the
psychological $100 level, the volatility remains extremely
elevated. This sudden reversal comes mere hours after both metals tested
all-time highs: gold touched $5,595 and silver reached $120.45
per ounce on Thursday.
The crash
represents the most severe single-day decline in over a decade for
both metals. In this article, I examine why silver price is falling and why
gold is going down, analyzing XAU/USD and XAG/USD charts.
Silver and Gold Price:
When Did Metals Last Fall This Hard?
The
magnitude of Friday's collapse rivals the worst single-day crashes in modern
precious metals history. The last time gold fell with comparable force
was April 15, 2013, when it plummeted 9% (losing
$140.30) to $1,361.10. the biggest one-day fall in 30 years at
that time. On that same infamous day, silver crashed 11%, shedding
$2.97 to close at $23.361 per ounce.
Silver's
trauma is even fresher. On December 29, 2025, the white metal
logged its worst day since February 2021, plunging 8.7% after
breaching $80 per ounce. The intraday swing was even more vicious—15%
peak-to-trough, representing the biggest high-to-low change going
back to August 2020, when silver dropped 16.85%.
Follow
me on X for more gold, silver and commodity market analysis: @ChmielDk
Why Silver And Gold Prices
Are Going Down?
Friday's
precious metals massacre isn't the result of a single catalyst but rather a
perfect storm of powerful forces that simultaneously hammered the market after
months of uninterrupted gains.
Fed Chair Uncertainty
Triggers Risk Reassessment
President
Trump's announcement that he would name a new Federal Reserve Chair on Friday
created immediate market turbulence. Speculation centered on Kevin
Warsh, a former Fed governor known for advocating "regime change"
at the central bank and calling for lower interest rates. The uncertainty
around monetary policy direction triggered a broad repricing of non-yielding
assets like gold and silver.
Konstantinos
Chrysikos, Head of Customer Relationship Management at Kudotrade, explained
that "gold pulled back toward the USD 5,000 level on Friday, as
investors reassessed positioning ahead of the expected announcement of the next
chair of the Federal Reserve." Despite the dramatic intraday
correction, he emphasized the metal "remains on track to close both
the week and the month higher."
Profit-Taking After
Record-Breaking Rally
Gold had
tested $5,595 per ounce just hours before the crash, while
silver touched $120.45, both representing all-time highs achieved
on January 29. After seven consecutive sessions of gains and
gold's 20%+ monthly surge marking its strongest performance in
decades, the market was severely overextended.
Ahmad
Assiri, Research Strategist at Pepperstone, provided crucial context: "gold
has gained more than 20% since the start of the month, marking its strongest
monthly performance in decades. Moves of this magnitude are rare and are
certainly not the result of short term speculation alone. They point instead to
a genuine reallocation of capital."
Government Shutdown
Averted - Removing One Gold Tailwind
Kathleen
Brooks, Research Director at XTB, observed that "the momentum rally
faces challenges at dizzy heights" after "extreme price
moves across asset classes on Thursday." She highlighted that "the
prospect of another US government shutdown appears to have been averted" through
a bipartisan funding deal.
Brooks
noted this development "should be good for risk sentiment, and it
is a massive relief for consumer and business confidence as we move through
Q1." Paradoxically, reduced political chaos removed one of gold's
key support pillars, the fear premium that had been priced into the metal
throughout January.
Dollar Weakness Paradox
and Positioning Reassessment
Assiri
highlighted a critical market anomaly: the US dollar is "trading
near its lowest levels in years, around levels last seen in early 2022." This
move "cannot be explained solely by interest rate differentials
but also reflects a confidence issue tied to recent actions and signals from
the US administration".
Silver and Gold Technical
Analysis: Critical Support and Resistance Levels
The violent
price action has reset the technical landscape for both metals, with key levels
now coming into sharp focus that will determine whether this correction extends
or finds a floor.
The sudden
drop follows Thursday's test of historical highs at the $5,600 level,
after which came the long-awaited downward correction and profit-taking. So
far, however, we have stopped at the psychological level of $5,000,
which will now likely play the role of an important support level.
Gold has
behind it as many as seven consecutive up sessions, and even
despite this correction, it is still up 18% in 2026 alone.
Why gold is going down today? Source: Tradingview.com
Key
Question: Will $5,000 hold
the decline, or will selling accelerate?
According
to my technical analysis, if gold continues falling, my
critical support zone centers on $4,550, representing late 2025
highs that coincide with the 50-day exponential moving average (50 EMA).
This zone extends down to $4,360 per ounce, the October 2025 peak.
We've
finally established a clear resistance zone at $5,400-5,450 per ounce—the
area where Thursday's all-time high was rejected.
Silver's Technical Structure
Silver on Friday is down
just under 14%. At a critical moment during the session, however,
it plunged by over 17%, starting from the $120 level and
stopping near the round psychological support level of $100 per ounce.
Throughout this period, silver is still up approximately 40%
year-to-date.
Why silver is going down today? Source: Tradingview.com
Resistance
zone on
silver's chart is currently defined by peaks first tested on January 26 in
the $112-117 range.
My primary
support at $100 per ounce extends down to $93, the January
14 peak. Even if silver breaks lower, we have another broad support
zone between $70-80 per ounce, established by late 2025 highs and
reinforced by the 50-day exponential moving average (50 EMA).
Key Technical Levels Table
Metal
Current Price
Intraday Low
Key Support
Extended Support
Resistance
Gold
$5,090
$4,941
$5,000
$4,550-$4,360 (50 EMA)
$5,400-$5,450
Silver
$100
$95
$100
$93-$70 (50 EMA zone)
$112-$117
The
technical picture suggests both metals are testing critical psychological
levels that held during the December correction. Gold's ability to maintain
above $5,000 and silver's defense of $100 will
be crucial in determining whether this represents a buyable dip or the start of
a deeper retracement toward the extended support zones.
What Happens Next? Price
Predictions for Gold and Silver
Bull Case: Support Holds,
December Playbook Repeats
If gold
stabilizes above $5,000 and silver defends $100,
we could see a scenario similar to mid-December when both metals bounced
sharply from comparable technical levels. The fundamental drivers remain
powerfully supportive:
Central bank buying continues unabated, with
the Polish central bank leading recent accumulation
Dollar weakness at multi-year lows (near
early 2022 levels) despite Fed policy uncertainty
Geopolitical fragmentation accelerating with
EU-India trade deals and UK-China dialogue
ETF inflows remained robust
throughout January despite today's selloff
Both metals remain dramatically
higher year-to-date (+18% gold, +40% silver)
Bear Case: Extended
Correction to Test Deeper Support
If $5,000
fails for gold or $100 breaks for silver, the next
support zones come into focus:
Gold: $4,550-$4,360 (50 EMA
confluence with late 2025/October 2025 peaks)
Silver: $93 down to $70-$80 (50
EMA zone, late 2025 highs)
A decline
to these levels would represent a 10-15% correction from current prices—painful
but historically normal after 20%+ monthly rallies. The April 2013 crash saw
gold fall 25% over several months before finding a bottom,
though that occurred in a very different fundamental environment.
Gold and Silver Price
Predictions Table
Gold Price Forecasts for 2026
Institution
Target Price
Timeframe
Previous Forecast
Key Drivers
UBS
$6,200
Q1-Q3 2026
$5,000
Historic
investment demand, central bank buying, geopolitical risks
45-year
cup-and-handle breakout, fiat currency pressure
FAQ: Gold and Silver Crash
Explained
Why is gold falling today?
Gold fell
as much as 8% on January 30, 2026 due to profit-taking after hitting $5,595
(all-time high) Thursday, combined with uncertainty around President Trump's
Fed Chair announcement. Kevin Warsh's expected nomination signals potentially
less aggressive monetary stimulus, pressuring non-yielding assets. Despite the
correction, gold remains up 18% year-to-date.
What is the gold price
now?
As of
Friday afternoon European time, gold trades around $5,180 per ounce,
down 4.77% from Thursday's close but recovered from an intraday low of $4,941.
The metal is testing critical psychological support at $5,000.
Why is silver crashing
today?
Silver
plunged 17% peak-to-trough (from $120 to $95) in history's most volatile
session since August 2020. The crash reflects extreme profit-taking after
silver's 40% year-to-date gain, Fed Chair uncertainty, and silver's typical
pattern of amplifying gold's moves. The metal currently trades just below $100.
Will gold fall below
$5,000?
If $5,000
fails, the next major support sits at $4,550-$4,360 (50-day
EMA zone, late 2025 highs). However, experts like Pepperstone's Ahmad Assiri
note corrections after 20%+ rallies are "normal and unlikely to be
deep" absent major shifts in geopolitics or dollar strength. Central bank
buying and ETF inflows remain supportive.
When was the last time
gold and silver fell this hard?
Gold's 8%
drop matches the April 15, 2013 crash (-9%, biggest in 30 years) and exceeds
October 2025's -6% decline. Silver's 17% plunge surpasses December 29, 2025
(-8.7%), August 2020 (-16.85%), and approaches only March 2020 COVID panic
levels. This ranks among the worst precious metals crashes in modern history.
Should I buy gold now?
This
depends entirely on your risk tolerance and time horizon. Current prices offer
a 10-15% discount from Thursday's highs, and fundamental drivers (dollar
weakness, geopolitical fragmentation, central bank buying) remain intact.
Damian Chmiel is a Senior Analyst & Editor at Finance Magnates with more than 15 years of experience in the CFD and online trading industry. Active as both a trader and journalist since 2010, he focuses on broker coverage, fintech innovation, and regulatory developments across Europe, the Middle East, and Asia.
His work includes interviews with C-level leaders at major brokerages and fintech platforms, as well as co-authoring Finance Magnates’ quarterly industry benchmarking reports. Damian’s reporting is data-driven, market-aware, and grounded in direct industry engagement. His analysis and commentary have also been cited by external media outlets, including Investing.com, Binance, The Asset, Stockhead, and Dispatch.
Education:
MA in Finance and Accounting, Cracow University of Economics
Inside the Prediction Markets: $1.6B Institutional Inflow Meets a Federal Crackdown
Featured Videos
FP Markets Winner Spotlight 🏆 | Global Broker of the Year 2025 #Trading #Broker #Innovation #Shorts
FP Markets Winner Spotlight 🏆 | Global Broker of the Year 2025 #Trading #Broker #Innovation #Shorts
FP Markets Winner Spotlight 🏆 | Global Broker of the Year 2025 #Trading #Broker #Innovation #Shorts
FP Markets Winner Spotlight 🏆 | Global Broker of the Year 2025 #Trading #Broker #Innovation #Shorts
FP Markets takes the spotlight as Global Broker of the Year 2025 at the Finance Magnates Awards.
Martin Stoilov, Head of Client Experience, shares that trust, innovation, and people played a key role in the company’s success, supported by a strong foundation of integrity and client-centricity.
Following this milestone, FP Markets continues to focus on growth, technology investment, and its core values of transparency and excellence.
👉 Be part of FM Awards 2026: https://awards.financemagnates.com/#nominate
In this video, we review @HolaPrimeMarketsOfficial, a multi-asset forex and CFDs broker offering different account types, trading platforms, and flexible trading conditions.
We cover the broker’s overall offering, including account options, trading environment, platforms like MT4 and MT5, and additional services such as managed accounts and fast withdrawals.
Watch the full video to see if Hola Prime Markets fits your trading needs.
📣 Stay up to date with the latest in finance and trading. Follow Finance Magnates for industry news, insights, and global event coverage.
Connect with us:
🔗 LinkedIn: /financemagnates
👍 Facebook: /financemagnates
📸 Instagram: https://www.instagram.com/financemagnates
🐦 X: https://x.com/financemagnates
🎥 TikTok: https://www.tiktok.com/tag/financemagnates
▶️ YouTube: /@financemagnates_official
#HolaPrime #ForexBroker #CFDTrading #FinanceMagnates #Trading #Forex #BrokerReview
Hola Prime Review: What You Need to Know | Full Breakdown by Finance Magnates
Hola Prime Review: What You Need to Know | Full Breakdown by Finance Magnates
Hola Prime Review: What You Need to Know | Full Breakdown by Finance Magnates
Hola Prime Review: What You Need to Know | Full Breakdown by Finance Magnates
Hola Prime Review: What You Need to Know | Full Breakdown by Finance Magnates
Hola Prime Review: What You Need to Know | Full Breakdown by Finance Magnates
In this video, we review @HolaPrime_Global, a proprietary trading firm offering evaluation programs and performance-based payouts in simulated market environments.
We cover how the challenge model works, including account types, profit splits (up to 95%), trading rules, and what it takes to reach a funded account. You’ll also learn about available platforms like MT4, MT5, cTrader, and more, along with insights into payouts, support, and trading conditions.
Watch the full video to see if Hola Prime fits your trading style.
📣 Stay up to date with the latest in finance and trading. Follow Finance Magnates for industry news, insights, and global event coverage.
Connect with us:
🔗 LinkedIn: /financemagnates
👍 Facebook: /financemagnates
📸 Instagram: https://www.instagram.com/financemagnates
🐦 X: https://x.com/financemagnates
🎥 TikTok: https://www.tiktok.com/tag/financemagnates
▶️ YouTube: /@financemagnates_official
#HolaPrime #PropFirm #Trading #FinanceMagnates #Forex #FuturesTrading #TradingReview #PropFirmReview
Axi Winner Spotlight 🏆 | Global Most Innovative Broker 2025 #Innovation #Trading #Fintech #Broker
Axi Winner Spotlight 🏆 | Global Most Innovative Broker 2025 #Innovation #Trading #Fintech #Broker
Axi Winner Spotlight 🏆 | Global Most Innovative Broker 2025 #Innovation #Trading #Fintech #Broker
Axi Winner Spotlight 🏆 | Global Most Innovative Broker 2025 #Innovation #Trading #Fintech #Broker
Axi Winner Spotlight 🏆 | Global Most Innovative Broker 2025 #Innovation #Trading #Fintech #Broker
Axi Winner Spotlight 🏆 | Global Most Innovative Broker 2025 #Innovation #Trading #Fintech #Broker
Axi takes the spotlight at the Finance Magnates Awards, winning Global Most Innovative Broker 2025.
Olivia Xenofontos and Ivanna Openko share how the team will feel: proud, motivated, and ready to keep delivering.
They also describe the night as well-organized, focused, and enjoyable for all.
👉 Be part of FM Awards 2026.
Recognition that matters.
Built on transparency.
Driven by the industry.
The Finance Magnates Awards 2026.
Nominations are now open.
🔗 https://awards.financemagnates.com/?utm_source=SM&utm_medium=social&utm_campaign=recognition-matters
Recognition that matters.
Built on transparency.
Driven by the industry.
The Finance Magnates Awards 2026.
Nominations are now open.
🔗 https://awards.financemagnates.com/?utm_source=SM&utm_medium=social&utm_campaign=recognition-matters
Recognition that matters.
Built on transparency.
Driven by the industry.
The Finance Magnates Awards 2026.
Nominations are now open.
🔗 https://awards.financemagnates.com/?utm_source=SM&utm_medium=social&utm_campaign=recognition-matters
Recognition that matters.
Built on transparency.
Driven by the industry.
The Finance Magnates Awards 2026.
Nominations are now open.
🔗 https://awards.financemagnates.com/?utm_source=SM&utm_medium=social&utm_campaign=recognition-matters
Recognition that matters.
Built on transparency.
Driven by the industry.
The Finance Magnates Awards 2026.
Nominations are now open.
🔗 https://awards.financemagnates.com/?utm_source=SM&utm_medium=social&utm_campaign=recognition-matters
Recognition that matters.
Built on transparency.
Driven by the industry.
The Finance Magnates Awards 2026.
Nominations are now open.
🔗 https://awards.financemagnates.com/?utm_source=SM&utm_medium=social&utm_campaign=recognition-matters