

$67,822. That is where Bitcoin (BTC) trades on March 31, 2026, the final session of a quarter that erased approximately $20,000 per coin. BTC opened 2026 at $87,508 and has since fallen roughly 23%, making Q1 2026 the third-worst opening quarter since 2013. Only Q1 2018 (-49.7%) and Q1 2014 (-37.4%) produced steeper losses, and both preceded confirmed bear market cycles.
The March 30 daily close came in at $66,691, already below the $67,000 level that analysts flagged as the line separating a normal correction from a structural breakdown. A red first half of 2026 is now nearly locked in: with BTC roughly 23% below its January 1 price, the coin would need a 30%+ compound rally in Q2 just to close H1 flat. That is not a recovery scenario. That is a statistical near-impossibility. This bitcoin price prediction examines where BTC goes from here, based on my over 15 years of experience as an analyst and trader.
Follow me on X for real-time market analysis: @ChmielDk
Why Bitcoin Is Going Down? War, the Fed, and ETF Stress
The Q1 damage was not driven by a single event but by a compounding stack of pressure. The US-Iran conflict, now in its fifth week, remains the dominant macro driver. As the earlier analysis covering Bitcoin's four-session drop below $63,000 documented, the military escalation sent capital flooding into traditional safe havens while crypto traded with equities, not against them.
The Federal Reserve remains on hold at 3.5%-3.75%. Elevated oil prices from the Strait of Hormuz closure are keeping inflation expectations sticky, removing any near-term prospect of rate cuts. The dollar's strength compounds the problem for dollar-denominated risk assets. CME FedWatch pricing shows markets have pushed the first expected cut to the second half of 2026 at the earliest.
- Why Is Bitcoin Crashing? How Low Can BTC Go and Bitcoin Price Prediction 2026
- Why Is Bitcoin Going Down? How Low Can BTC Go and What Are Analyst Bitcoin Price Predictions
- Why Is Bitcoin Surging? BTC Price Tests $72K but Price Prediction Still Suggests 30% Drop to $50K
Joel Kruger, crypto strategist at LMAX, described the current environment as a market "caught between lingering bearish pressure from the multi-month pullback and emerging medium-term demand from value-oriented buyers." The sentiment data reinforces that assessment. The crypto Fear & Greed Index sits at 11 as of March 31, having hit a record low of 5 on February 6. That reading exceeded the extremes seen during the Terra/Luna collapse in 2022 (which bottomed at 6), underscoring the severity of the confidence shock.
ETF dynamics have shifted from tailwind to headwind. Standard Chartered's Geoff Kendrick, head of digital assets research, warned in his February 12 note that ETF investors sitting on losses are more likely to reduce exposure than accumulate. The bank cut its 2026 year-end Bitcoin forecast from $150,000 to $100,000 in that note, the second downgrade in three months. As the January bitcoin price prediction for 2026 noted, the range of institutional forecasts had already widened dramatically from the post-ATH euphoria, spanning $75,000 to $225,000.
Bitcoin Technical Analysis: Bear Flag Targets $50,000
My chart of BTC/USD reveals a clear bearish flag formation. The pole was drawn from mid-January through the February lows below $60,000, a sharp, high-momentum decline that set the structure. The current correction, moving upward inside a sloping regression channel, forms the flag itself. This is a textbook continuation pattern in a downtrend.
For the pattern to confirm, price needs to break below the lower boundary of the regression channel, which aligns with the $63,000 area. A daily close below that level would generate a sell signal and confirm the flag breakdown, projecting further downside in the direction of the primary trend.
The broader consolidation structure reinforces the bearish setup. The range has been defined by $60,000 support on the floor and $74,000-$75,000 resistance at the ceiling, a level that coincides with last year's April lows. As the February 26 analysis warned, a break of the $60,000 floor opens a direct path to $50,000, my primary bearish target and the August 2024 lows.
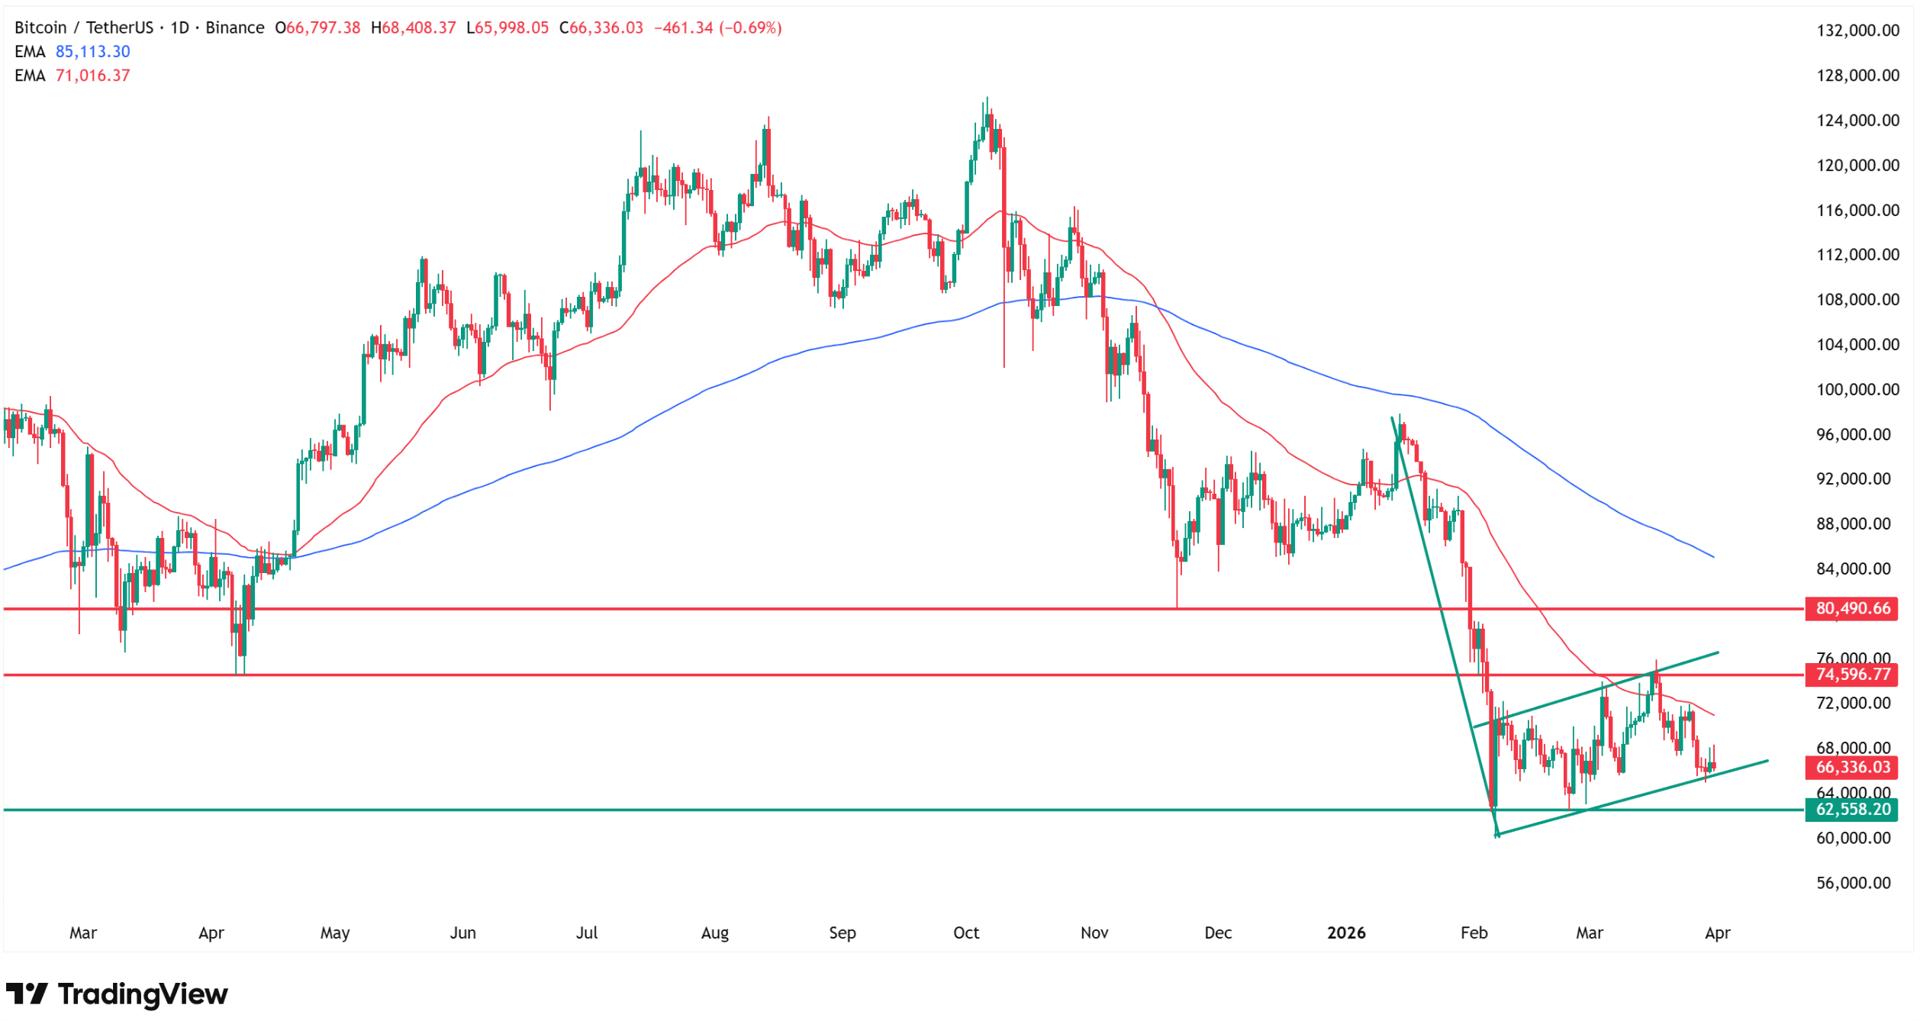
Two exponential moving averages define the current trend dynamics. The 50 EMA sits at $71,000, pressing down from above and capping every meaningful rally attempt this quarter. The 200 EMA at $85,000 is the main trend separator, the line that divides a bull market from a bear market. Bitcoin has traded below this level since early February, and as long as it remains there, the trend is unambiguously down. Higher resistance levels, including $80,000 (November 2025 lows) and everything above, are irrelevant while price sits 20% below the 200 EMA.
Kruger's technical assessment aligns with this framework. He noted that "Bitcoin needs to reclaim the $72,000 level to signal a potential shift in near-term momentum, with stronger resistance seen toward $76,000." Failure to break higher, he added, "keeps the risk tilted toward a continuation of the broader corrective phase."
Level | Type | Notes |
$85,000 | 200 EMA (resistance) | Main trend separator, bull/bear dividing line |
$80,000 | Resistance | November 2025 lows |
$74,000-$75,000 | Resistance / Consolidation ceiling | April 2025 lows |
$71,000 | 50 EMA (resistance) | Capping rallies since February |
$67,000 | Near-term pivot | March close threshold, red H1 trigger |
$63,000 | Bear flag breakdown trigger | Confirmation level for continuation pattern |
$60,000-$62,000 | Support / Consolidation floor | October 2024 lows, tested multiple times |
$50,000 | Primary bearish target | August 2024 lows, flag measured move |
My directional bias is bearish. The structure favors continuation lower, and until Bitcoin reclaims the 200 EMA, rally attempts are corrective moves within a downtrend, not trend reversals. The March 16 analysis covering the $74,500 test identified the same structural risk: the eight-session winning streak was consistent with a lower high formation, not a genuine recovery.
Bitcoin Price Predictions: Where Analysts See BTC Heading
The analyst community is broadly aligned that a confirmed bottom has not been established. The debate centers on depth, not direction.
Fidelity's Jurrien Timmer sees the current correction finding support in the $65,000-$75,000 range, consistent with a standard bear year within the four-year halving cycle. K33 Research is more specific, identifying $60,000 as the likely cycle bottom and projecting consolidation between $60,000 and $75,000 before any sustained recovery materializes.
The bearish outliers carry institutional weight. Canary Capital's Steven McClurg warned Bitcoin could reach $50,000 by summer 2026, while Standard Chartered's Kendrick, after two consecutive forecast downgrades, now warns of a near-term drop to $50,000 before a recovery to his revised $100,000 year-end target. As the March 4 analysis established, the structural case for a sustained recovery above $88,000 requires either a Fed pivot, Clarity Act passage, or material de-escalation in Middle East tensions. None of those catalysts are imminent.
On the bull side, those year-end forecasts assume H2 improvement. The Eric Trump $1 million prediction analysis from February covered the extreme upper end of the range, while the more grounded optimists cluster around $100,000-$150,000 by December, contingent on macro conditions turning favorable.
Kruger offered a balanced read from the trading floor. While the "pace of downside has notably slowed, reinforcing the sense of consolidation rather than capitulation," he cautioned that depressed sentiment indicators, "from a contrarian standpoint, also suggest the balance of risks may be gradually skewing back toward the upside." That view requires patience. It is not a near-term buy signal.
Source | Target / Range | Timeframe | Key Assumption |
Fidelity (Timmer) | $65,000-$75,000 support | Current cycle | Standard bear year in 4-year cycle |
K33 Research | $60,000 bottom, $60K-$75K range | 2026 | Consolidation before recovery |
Standard Chartered (Kendrick) | $50,000 near-term, $100,000 year-end | 2026 | ETF outflows ease, H2 recovery |
Canary Capital (McClurg) | $50,000 | Summer 2026 | Macro stress continues |
My analysis (Chmiel) | $50,000 primary target | If $63K breaks | Bear flag measured move |
LMAX (Kruger) | $72,000 reclaim needed for shift | Near-term | Momentum inflection point |
The 2018 Parallel: Why This Time Comparison Matters
The 2018 comparison is not just narrative convenience. Both cycles share structural DNA: a post-peak euphoria followed by relentless Q1 deleveraging, no relief rally in February, and price action that resembled a controlled collapse rather than a healthy correction. In 2018, Bitcoin fell from roughly $20,000 at its December 2017 peak to approximately $3,200 by December 2018, an 84% drawdown. The 2026 cycle peaked near $126,000 in October 2025, and the February 2026 trough hit approximately $60,000, a drawdown of 45-52% so far.
As CryptoSlate's Liam Wright noted, "2026 is not in a state where unconditional seasonality should be trusted." The calendar does not reset the damage.
Metric | 2018 Bear Market | 2022 Bear Market | 2026 (So Far) |
Cycle Peak | $20,000 (Dec 2017) | $69,000 (Nov 2021) | $126,000 (Oct 2025) |
Trough Price | $3,200 (Dec 2018) | $15,500 (Nov 2022) | $60,000 (Feb 2026)* |
Max Drawdown | 84% | 78% | 45-52%* |
Q1 Return | 49.7% | Mixed | -23% |
Fear & Greed Low | 11 | 6 (Terra/Luna) | 5 (record low) |
Primary Trigger | ICO bubble burst | FTX/Terra/Luna collapse | Cycle correction + macro |
*Ongoing; figures as of March 31, 2026.
The critical difference is structural maturity. No major exchange has collapsed in 2026, no protocol has imploded, and spot Bitcoin ETFs continue to function as institutional on-ramps. The February 5 analysis of the crypto selloff to 2026 lows highlighted that BlackRock's IBIT was still absorbing hundreds of millions in single sessions even as prices crashed. This cycle's pain is macro-driven, not systemic. That distinction matters for recovery timing but does not prevent further downside in the interim.
Historical data from 2016-2025 shows that years with negative first-half returns never finished positive. If that pattern holds, 2026 would need to be a clean break from every prior comparable cycle, something with zero precedent in the modern sample.
Bitcoin Price Prediction FAQ
Why is Bitcoin going down in 2026?
Bitcoin's decline is driven by compounding macro pressures: the US-Iran conflict pushing risk-off sentiment, the Fed holding rates at 3.5%-3.75% with no near-term cut expected, a strong US dollar, and ETF investors reducing exposure rather than accumulating. Q1 2026 finished down approximately 23%, the worst opening quarter since 2018. As the January analysis of Bitcoin's six-session losing streak documented, tariff threats and geopolitical stress have driven capital away from crypto since the start of the year.
How low can Bitcoin go in 2026?
My technical analysis identifies $50,000 as the primary bearish target if the bear flag breakdown confirms below $63,000. That level represents the August 2024 lows. Standard Chartered and Canary Capital both project $50,000 as a plausible near-term floor, while K33 Research places the cycle bottom at $60,000. The January analysis targeting a 25% decline below $70,000 identified the 200-week EMA as a critical long-term support that has since been tested.
Is Bitcoin in a bear market?
By conventional definition, yes. BTC has declined over 45% from its October 2025 all-time high of $126,000 and trades well below its 200-day EMA. Q1 2026's 23% loss places it among the three worst first quarters on record, alongside confirmed bear market periods (2014 and 2018). Approximately 46% of circulating Bitcoin supply is currently underwater.
What is the Bitcoin price prediction for end of 2026?
Forecasts range widely. Standard Chartered targets $100,000 year-end (cut from $150,000 in February). Fidelity sees support at $65,000-$75,000 as the base for recovery. The bull case requires a Fed pivot, regulatory clarity, or geopolitical de-escalation in H2. The bear case, if $60,000 breaks, projects $50,000 or lower.
Will Q2 2026 be better for Bitcoin?
Historically, Q2 has delivered the opposite performance of Q1 in eight of the past thirteen years. Macro triggers to watch include Fed rate decisions, sustained ETF inflow stabilization, and whether the Fear & Greed Index can push sustainably above 20-25, the level that in prior cycles marked seller exhaustion. The March 24 analysis noted that nothing structurally changed despite weekend volatility, and the $60,000-$72,000 consolidation range remains the defining structure.


