XRP falls for the third straight session to $1.90, erasing the entire mid-year rally and down 50% from July's $3.67 peak amid fragile market sentiment.
My technical analysis shows a bearish regression channel with targets at $1.62 (14% downside) and $1.25 (34% drop) after the death cross.
Market split between panic-selling and stealth-accumulation scenarios as XRP posts a 13% YTD loss.
Why is XRP going down today? Let's check current technical analysis and XRP price predictions
XRP price
is falling for a third consecutive session today (Tuesday), 23 December 2025,
dropping back below the $1.90 level and hovering near its lowest prices since
April, marking eight-month lows.
From this
year's July peak, when one XRP traded at $3.67, the price has already halved,
and on a year-to-date basis, XRP is down roughly 13%, effectively erasing the
dynamic mid-year rally that captivated traders.
According
to my technical analysis, the chart suggests the cryptocurrency can fall even
lower, with two clear downside targets now in focus. In this article, I examine how low XRP price can go and analyze the XRP/USDT daily chart.
The broader
cryptocurrency market is under pressure as total market capitalization fell
2.4% over the past 24 hours to $3.06 trillion, with
Bitcoin declining 2.4% to around $87,780 and most large-cap tokens posting
losses. XRP is mirroring this risk-off move but with sharper percentage
declines typical of its high-beta profile. The token closed Monday at $1.90,
down from $1.93 the prior session and marking a steady deterioration from the
$2.20+ zone that held through much of late November.
XRP price today. Source: CoinMarketCap.com
"The
current correction demonstrates the fragility of this market and its continued
susceptibility to panic selling," says Farzam Ehsani, CEO of crypto
exchange VALR. He outlines two scenarios: either a very large player such as a
fund, bank or state is preparing a significant purchase, making the decline
potentially artificial and setting up a sharp rebound, or the market is
oversaturated and the weakening dollar plus Fed policy have reduced demand for
high-risk assets, implying recovery could take more than a year.
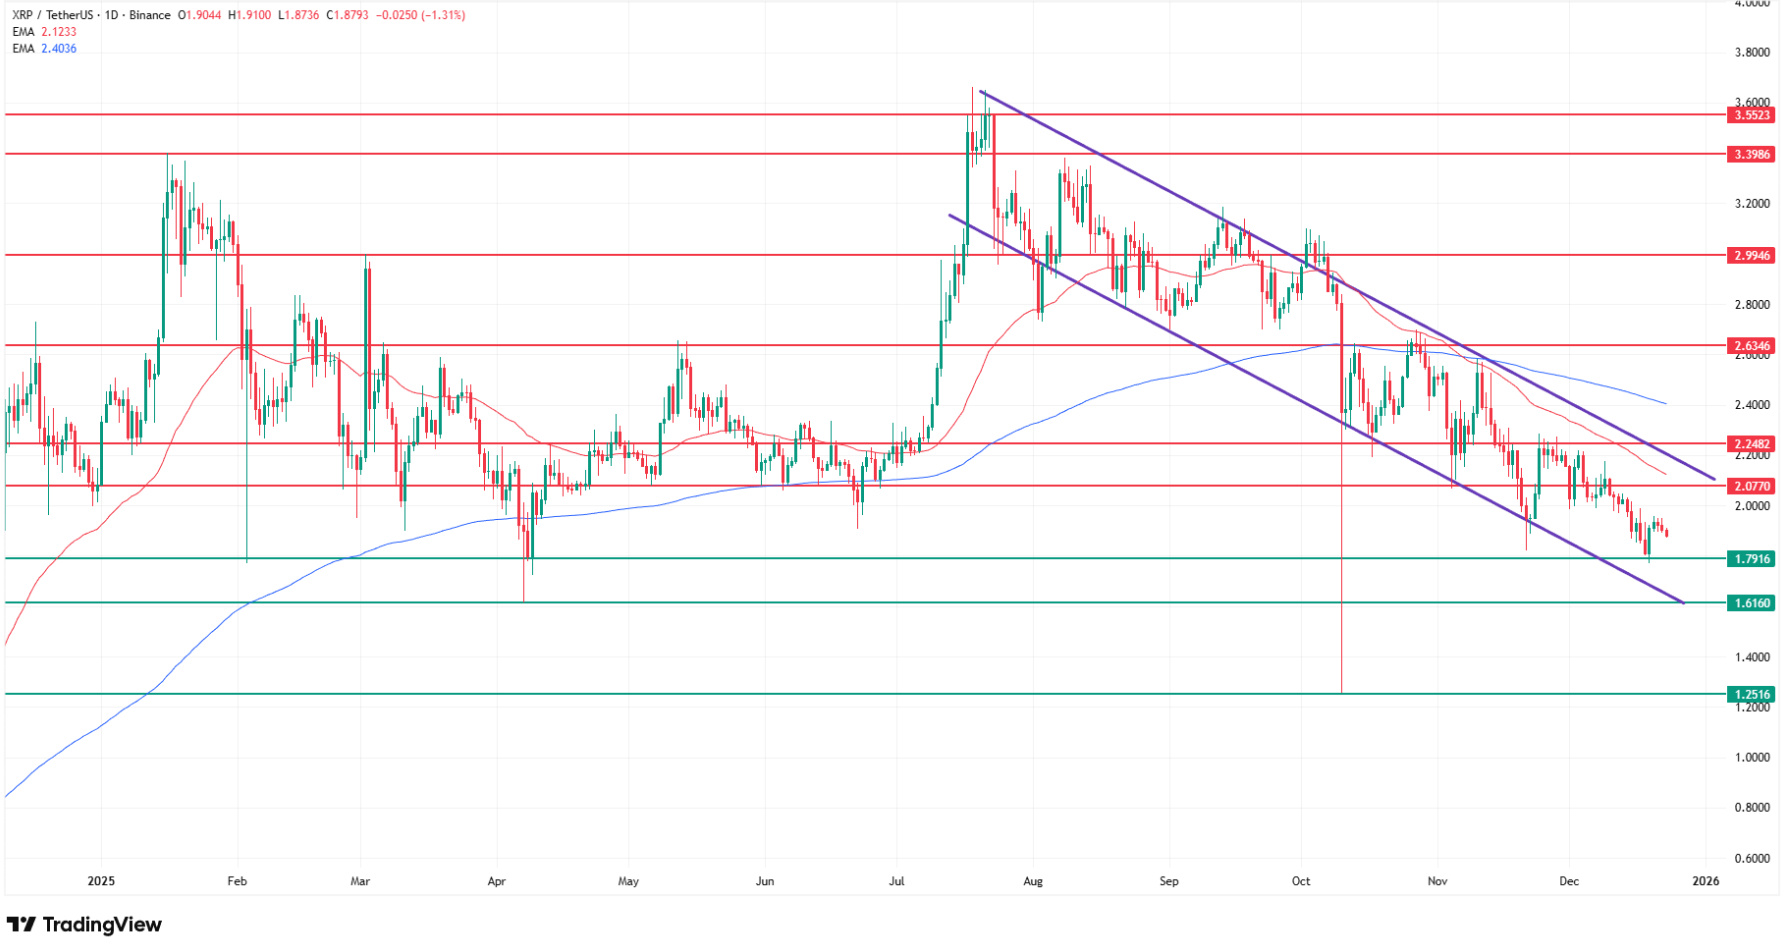
XRP Price Analysis:
Bearish Regression Channel And Death Cross
From my
technical view, XRP has been making fresh lows session after session, prompting
me to refresh the chart with updated levels and a bearish regression
channel that has been in place uninterrupted since July. The lower
boundary of this channel was last tested in late February, and price is now
gravitating back toward that zone. Currently, XRP is using a local
support area around $1.80, tested just last week, with prior contacts on 21
November and several sessions in April.
According
to my technical analysis, the far more important level lies at $1.62,
where the lower edge of the regression channel coincides with
the lows from eight months ago, representing one of the lowest prices of the
year. This is my first bearish target. The ultimate
downside objective sits at $1.25, the low from the October
10 flash crash, when XRP briefly tested and bounced within the November
2024 supply–demand accumulation zone. Analysts note that the October crash
marked a significant bearish shift, erasing roughly $1.3 trillion in total
crypto market value.
From the
current price near $1.90, XRP could fall approximately 14% to reach the
first target at $1.62 and as much as 34% to hit the second
target at $1.25. Supporting this bearish outlook is the moving
average grid: price trades well below both the 50-day and 200-day
MAs, and the pair formed a death cross at the beginning of
November, a classic technical signal of deteriorating momentum.
While my
base case remains tilted to the downside, it's important to map the resistance
ladder that would need to be reclaimed for any meaningful recovery.
According
to my technical analysis, the first substantial resistance zone spans
$2.07 to $2.25, combining the upper edge of the regression channel,
the 50-day moving average, and a cluster of local highs and lows
from 2025. This band has repeatedly capped rallies in recent weeks.
Above that,
the next resistance level sits around $2.64, the May 2025 high,
followed by the psychological $3.00 threshold, which also marks the
March 2025 peak. The final resistance band lies at $3.40–$3.55,
representing this year's July highs from which the current downtrend
originated.
Only a
sustained breakout above these zones, especially a decisive move through $2.25
and then $2.64, would invalidate the current bearish XRP price prediction and
signal a potential trend reversal.
XRP Price Prediction 2025,
2026
My short-
to medium-term XRP price prediction centers on the two downside targets
outlined above:
$1.62 as
the primary objective (aligned
with the regression channel floor and April lows),
The path
and timing to these levels will depend on how quickly the current local support
at $1.80 gives way and whether broader crypto sentiment continues to
deteriorate.
Several
factors could invalidate this bearish setup. A strong reversal
above the $2.07–$2.25 resistance band, coupled with reclaiming the 50-day
moving average and breaking back above the upper edge of the regression
channel, would suggest that buyers have regained control.
Potential
catalysts for such a reversal include clearer regulatory frameworks (despite
the recent Senate delay pushing crypto legislation to 2026), a macro shift
toward easier Fed policy, a broad-based crypto rally led by Bitcoin, or large
on-chain accumulation becoming visible in whale wallet data.
Kruger's
assessment that "crypto markets remain in consolidation mode"
underscores that until a clearer catalyst emerges, whether from Fed policy,
institutional flows, or breakthrough adoption news, XRP and the broader market
are likely to continue drifting within defined ranges, vulnerable to downside
breakouts.
XRP Price Analysis, FAQ
Why is XRP going down
today?
XRP is
going down because it's part of a broader 2.4% crypto market selloff, with
risk-off sentiment and year-end profit-taking weighing on all major tokens.
Additionally, XRP's 50% drawdown from July and inability to sustain gains
despite SEC victory and ETF inflows reflect fragile sentiment and ongoing
distribution by early holders.
Is XRP in a bear market
now?
Yes. XRP is
down 13% year-to-date and 50% from its July peak, trading within a bearish
regression channel with a confirmed death cross. While these are classic
bear-market signals, the token has outperformed Bitcoin (-18%) and Ethereum
(-27%) in 2025, suggesting a correction within a longer-term consolidation
rather than a full structural bear phase.
How low can XRP price go
in this cycle?
According
to my technical analysis, XRP can fall approximately 14% from current levels to
the first target at $1.62, and as much as 34% to the ultimate bearish objective
at $1.25. These levels correspond to the lower edge of the regression channel,
April 2025 lows, and the October flash-crash zone respectively.
Can XRP recover after this
crash?
XRP can
recover if broader crypto sentiment stabilizes, macro conditions improve, or a
major catalyst such as renewed institutional buying or regulatory clarity
emerges. A sustained break above $2.25 resistance and reclaiming the 50-day
moving average would signal that buyers have regained control and invalidate
the current bearish setup.
Before you go, please also check my other XRP price prediction articles:
XRP price
is falling for a third consecutive session today (Tuesday), 23 December 2025,
dropping back below the $1.90 level and hovering near its lowest prices since
April, marking eight-month lows.
From this
year's July peak, when one XRP traded at $3.67, the price has already halved,
and on a year-to-date basis, XRP is down roughly 13%, effectively erasing the
dynamic mid-year rally that captivated traders.
According
to my technical analysis, the chart suggests the cryptocurrency can fall even
lower, with two clear downside targets now in focus. In this article, I examine how low XRP price can go and analyze the XRP/USDT daily chart.
The broader
cryptocurrency market is under pressure as total market capitalization fell
2.4% over the past 24 hours to $3.06 trillion, with
Bitcoin declining 2.4% to around $87,780 and most large-cap tokens posting
losses. XRP is mirroring this risk-off move but with sharper percentage
declines typical of its high-beta profile. The token closed Monday at $1.90,
down from $1.93 the prior session and marking a steady deterioration from the
$2.20+ zone that held through much of late November.
XRP price today. Source: CoinMarketCap.com
"The
current correction demonstrates the fragility of this market and its continued
susceptibility to panic selling," says Farzam Ehsani, CEO of crypto
exchange VALR. He outlines two scenarios: either a very large player such as a
fund, bank or state is preparing a significant purchase, making the decline
potentially artificial and setting up a sharp rebound, or the market is
oversaturated and the weakening dollar plus Fed policy have reduced demand for
high-risk assets, implying recovery could take more than a year.
XRP Price Analysis:
Bearish Regression Channel And Death Cross
From my
technical view, XRP has been making fresh lows session after session, prompting
me to refresh the chart with updated levels and a bearish regression
channel that has been in place uninterrupted since July. The lower
boundary of this channel was last tested in late February, and price is now
gravitating back toward that zone. Currently, XRP is using a local
support area around $1.80, tested just last week, with prior contacts on 21
November and several sessions in April.
According
to my technical analysis, the far more important level lies at $1.62,
where the lower edge of the regression channel coincides with
the lows from eight months ago, representing one of the lowest prices of the
year. This is my first bearish target. The ultimate
downside objective sits at $1.25, the low from the October
10 flash crash, when XRP briefly tested and bounced within the November
2024 supply–demand accumulation zone. Analysts note that the October crash
marked a significant bearish shift, erasing roughly $1.3 trillion in total
crypto market value.
From the
current price near $1.90, XRP could fall approximately 14% to reach the
first target at $1.62 and as much as 34% to hit the second
target at $1.25. Supporting this bearish outlook is the moving
average grid: price trades well below both the 50-day and 200-day
MAs, and the pair formed a death cross at the beginning of
November, a classic technical signal of deteriorating momentum.
While my
base case remains tilted to the downside, it's important to map the resistance
ladder that would need to be reclaimed for any meaningful recovery.
According
to my technical analysis, the first substantial resistance zone spans
$2.07 to $2.25, combining the upper edge of the regression channel,
the 50-day moving average, and a cluster of local highs and lows
from 2025. This band has repeatedly capped rallies in recent weeks.
Above that,
the next resistance level sits around $2.64, the May 2025 high,
followed by the psychological $3.00 threshold, which also marks the
March 2025 peak. The final resistance band lies at $3.40–$3.55,
representing this year's July highs from which the current downtrend
originated.
Only a
sustained breakout above these zones, especially a decisive move through $2.25
and then $2.64, would invalidate the current bearish XRP price prediction and
signal a potential trend reversal.
XRP Price Prediction 2025,
2026
My short-
to medium-term XRP price prediction centers on the two downside targets
outlined above:
$1.62 as
the primary objective (aligned
with the regression channel floor and April lows),
The path
and timing to these levels will depend on how quickly the current local support
at $1.80 gives way and whether broader crypto sentiment continues to
deteriorate.
Several
factors could invalidate this bearish setup. A strong reversal
above the $2.07–$2.25 resistance band, coupled with reclaiming the 50-day
moving average and breaking back above the upper edge of the regression
channel, would suggest that buyers have regained control.
Potential
catalysts for such a reversal include clearer regulatory frameworks (despite
the recent Senate delay pushing crypto legislation to 2026), a macro shift
toward easier Fed policy, a broad-based crypto rally led by Bitcoin, or large
on-chain accumulation becoming visible in whale wallet data.
Kruger's
assessment that "crypto markets remain in consolidation mode"
underscores that until a clearer catalyst emerges, whether from Fed policy,
institutional flows, or breakthrough adoption news, XRP and the broader market
are likely to continue drifting within defined ranges, vulnerable to downside
breakouts.
XRP Price Analysis, FAQ
Why is XRP going down
today?
XRP is
going down because it's part of a broader 2.4% crypto market selloff, with
risk-off sentiment and year-end profit-taking weighing on all major tokens.
Additionally, XRP's 50% drawdown from July and inability to sustain gains
despite SEC victory and ETF inflows reflect fragile sentiment and ongoing
distribution by early holders.
Is XRP in a bear market
now?
Yes. XRP is
down 13% year-to-date and 50% from its July peak, trading within a bearish
regression channel with a confirmed death cross. While these are classic
bear-market signals, the token has outperformed Bitcoin (-18%) and Ethereum
(-27%) in 2025, suggesting a correction within a longer-term consolidation
rather than a full structural bear phase.
How low can XRP price go
in this cycle?
According
to my technical analysis, XRP can fall approximately 14% from current levels to
the first target at $1.62, and as much as 34% to the ultimate bearish objective
at $1.25. These levels correspond to the lower edge of the regression channel,
April 2025 lows, and the October flash-crash zone respectively.
Can XRP recover after this
crash?
XRP can
recover if broader crypto sentiment stabilizes, macro conditions improve, or a
major catalyst such as renewed institutional buying or regulatory clarity
emerges. A sustained break above $2.25 resistance and reclaiming the 50-day
moving average would signal that buyers have regained control and invalidate
the current bearish setup.
Before you go, please also check my other XRP price prediction articles:
Damian Chmiel is a Senior Analyst & Editor at Finance Magnates with more than 15 years of experience in the CFD and online trading industry. Active as both a trader and journalist since 2010, he focuses on broker coverage, fintech innovation, and regulatory developments across Europe, the Middle East, and Asia.
His work includes interviews with C-level leaders at major brokerages and fintech platforms, as well as co-authoring Finance Magnates’ quarterly industry benchmarking reports. Damian’s reporting is data-driven, market-aware, and grounded in direct industry engagement. His analysis and commentary have also been cited by external media outlets, including Investing.com, Binance, The Asset, Stockhead, and Dispatch.
Education:
MA in Finance and Accounting, Cracow University of Economics
Inside the Prediction Markets: $1.6B Institutional Inflow Meets a Federal Crackdown
Featured Videos
FP Markets Winner Spotlight 🏆 | Global Broker of the Year 2025 #Trading #Broker #Innovation #Shorts
FP Markets Winner Spotlight 🏆 | Global Broker of the Year 2025 #Trading #Broker #Innovation #Shorts
FP Markets Winner Spotlight 🏆 | Global Broker of the Year 2025 #Trading #Broker #Innovation #Shorts
FP Markets Winner Spotlight 🏆 | Global Broker of the Year 2025 #Trading #Broker #Innovation #Shorts
FP Markets takes the spotlight as Global Broker of the Year 2025 at the Finance Magnates Awards.
Martin Stoilov, Head of Client Experience, shares that trust, innovation, and people played a key role in the company’s success, supported by a strong foundation of integrity and client-centricity.
Following this milestone, FP Markets continues to focus on growth, technology investment, and its core values of transparency and excellence.
👉 Be part of FM Awards 2026: https://awards.financemagnates.com/#nominate
In this video, we review @HolaPrimeMarketsOfficial, a multi-asset forex and CFDs broker offering different account types, trading platforms, and flexible trading conditions.
We cover the broker’s overall offering, including account options, trading environment, platforms like MT4 and MT5, and additional services such as managed accounts and fast withdrawals.
Watch the full video to see if Hola Prime Markets fits your trading needs.
📣 Stay up to date with the latest in finance and trading. Follow Finance Magnates for industry news, insights, and global event coverage.
Connect with us:
🔗 LinkedIn: /financemagnates
👍 Facebook: /financemagnates
📸 Instagram: https://www.instagram.com/financemagnates
🐦 X: https://x.com/financemagnates
🎥 TikTok: https://www.tiktok.com/tag/financemagnates
▶️ YouTube: /@financemagnates_official
#HolaPrime #ForexBroker #CFDTrading #FinanceMagnates #Trading #Forex #BrokerReview
Hola Prime Review: What You Need to Know | Full Breakdown by Finance Magnates
Hola Prime Review: What You Need to Know | Full Breakdown by Finance Magnates
Hola Prime Review: What You Need to Know | Full Breakdown by Finance Magnates
Hola Prime Review: What You Need to Know | Full Breakdown by Finance Magnates
Hola Prime Review: What You Need to Know | Full Breakdown by Finance Magnates
Hola Prime Review: What You Need to Know | Full Breakdown by Finance Magnates
In this video, we review @HolaPrime_Global, a proprietary trading firm offering evaluation programs and performance-based payouts in simulated market environments.
We cover how the challenge model works, including account types, profit splits (up to 95%), trading rules, and what it takes to reach a funded account. You’ll also learn about available platforms like MT4, MT5, cTrader, and more, along with insights into payouts, support, and trading conditions.
Watch the full video to see if Hola Prime fits your trading style.
📣 Stay up to date with the latest in finance and trading. Follow Finance Magnates for industry news, insights, and global event coverage.
Connect with us:
🔗 LinkedIn: /financemagnates
👍 Facebook: /financemagnates
📸 Instagram: https://www.instagram.com/financemagnates
🐦 X: https://x.com/financemagnates
🎥 TikTok: https://www.tiktok.com/tag/financemagnates
▶️ YouTube: /@financemagnates_official
#HolaPrime #PropFirm #Trading #FinanceMagnates #Forex #FuturesTrading #TradingReview #PropFirmReview
Axi Winner Spotlight 🏆 | Global Most Innovative Broker 2025 #Innovation #Trading #Fintech #Broker
Axi Winner Spotlight 🏆 | Global Most Innovative Broker 2025 #Innovation #Trading #Fintech #Broker
Axi Winner Spotlight 🏆 | Global Most Innovative Broker 2025 #Innovation #Trading #Fintech #Broker
Axi Winner Spotlight 🏆 | Global Most Innovative Broker 2025 #Innovation #Trading #Fintech #Broker
Axi Winner Spotlight 🏆 | Global Most Innovative Broker 2025 #Innovation #Trading #Fintech #Broker
Axi Winner Spotlight 🏆 | Global Most Innovative Broker 2025 #Innovation #Trading #Fintech #Broker
Axi takes the spotlight at the Finance Magnates Awards, winning Global Most Innovative Broker 2025.
Olivia Xenofontos and Ivanna Openko share how the team will feel: proud, motivated, and ready to keep delivering.
They also describe the night as well-organized, focused, and enjoyable for all.
👉 Be part of FM Awards 2026.
Recognition that matters.
Built on transparency.
Driven by the industry.
The Finance Magnates Awards 2026.
Nominations are now open.
🔗 https://awards.financemagnates.com/?utm_source=SM&utm_medium=social&utm_campaign=recognition-matters
Recognition that matters.
Built on transparency.
Driven by the industry.
The Finance Magnates Awards 2026.
Nominations are now open.
🔗 https://awards.financemagnates.com/?utm_source=SM&utm_medium=social&utm_campaign=recognition-matters
Recognition that matters.
Built on transparency.
Driven by the industry.
The Finance Magnates Awards 2026.
Nominations are now open.
🔗 https://awards.financemagnates.com/?utm_source=SM&utm_medium=social&utm_campaign=recognition-matters
Recognition that matters.
Built on transparency.
Driven by the industry.
The Finance Magnates Awards 2026.
Nominations are now open.
🔗 https://awards.financemagnates.com/?utm_source=SM&utm_medium=social&utm_campaign=recognition-matters
Recognition that matters.
Built on transparency.
Driven by the industry.
The Finance Magnates Awards 2026.
Nominations are now open.
🔗 https://awards.financemagnates.com/?utm_source=SM&utm_medium=social&utm_campaign=recognition-matters
Recognition that matters.
Built on transparency.
Driven by the industry.
The Finance Magnates Awards 2026.
Nominations are now open.
🔗 https://awards.financemagnates.com/?utm_source=SM&utm_medium=social&utm_campaign=recognition-matters