Gold is trading at $4,493 per ounce as of March 30, 2026, up $115 from the previous session but still roughly 20% below the all-time high of $5,595 set on January 29. The question of how high can gold go has rarely been more divisive.
The yellow metal has shed more than $1,100 in two months, endured its worst weekly decline since March 2020, and yet every major Wall Street commodity desk has maintained or raised its year-end target.
At the same time, Robert Kiyosaki, the author of "Rich Dad Poor Dad" with 2.4 million X followers, has issued his most extreme gold price prediction yet: $35,000 per ounce. The gap between that number and the institutional consensus tells you everything about the current market psychology.
Follow me on X for real-time market analysis: @ChmielDk
Why Gold Dropped 20% From Its January Peak?
The correction from $5,595 to below $4,100 at the worst point last Monday was driven by three converging forces, none of which changed the long-term structural picture for gold but all of which hit the market simultaneously.
First, the Federal Reserve. The March FOMC dot plot trimmed 2026 rate cut projections from two to one, after February's producer price index came in at +0.7%, well above consensus. CME FedWatch now prices zero rate cuts for the remainder of 2026. Higher-for-longer rates raise the opportunity cost of holding gold, and the 10-year Treasury yield pushing to 4.40% created direct competition for safe-haven capital.
Second, the US dollar. The Dollar Index climbed above 100.2, its highest since May 2025, as the Iran conflict paradoxically strengthened the greenback through safe-haven flows. A stronger dollar makes gold more expensive for buyers in non-dollar currencies, reducing global demand.
Ben McMillan, Chief Investment Officer at IDX Advisors, described the longer-term backdrop on Yahoo Finance in January: "80 percent of all US dollars in existence have been printed since Covid. This is a structural tailwind behind gold, it's a fundamental repricing." That structural thesis has not changed, but the short-term monetary mechanics have swung against bullion.
Third, the oil-inflation feedback loop. The partial closure of the Strait of Hormuz pushed Brent crude toward $84 per barrel. Normally, geopolitical conflict supports gold. This time, the oil spike reignited inflation fears, which in turn forced the Fed to stay hawkish, which pressured gold through the monetary channel.
As I noted in my analysis of why gold was crashing last week, gold is being sold during an active conflict precisely because that conflict is making the Fed's job harder.
Kiyosaki's $35,000 Gold Price Prediction: Context and Credibility
Robert Kiyosaki's March 16 post, which generated over 681,000 views on X, frames gold, silver, Bitcoin , and Ethereum as the ultimate beneficiaries of what he calls "the biggest bubble bust in history." His exact words: "I predict gold will hit $35,000 an ounce one year after the gold bubble goes pop." In the same post, he set $200 silver, $750,000 Bitcoin, and $95,000 Ethereum as post-crash targets.
As the Finance Magnates coverage from March 17 established, Kiyosaki's forecast differs from institutional gold price predictions in one critical way: it requires a systemic financial collapse as the catalyst. His $35,000 target represents a roughly 680% increase from current prices, which would imply either a complete collapse in the US dollar or a hyperinflationary event.
The broader collection of Kiyosaki's market calls shows a consistent pattern of predicting asset prices through the lens of fiat currency failure.
For context, Kiyosaki's Bitcoin prediction of $1 million by 2035 follows the same logic, as does his $200 silver call. These are not traditional market forecasts. They are conditional predictions that depend on a specific macroeconomic scenario unfolding. Investors should evaluate them accordingly.
How High Can Gold Go? XAU/USDT Technical Analysis
Based on my over 15 years of experience as an analyst and trader, the technical picture on gold has not changed materially despite the dramatic correction. Price action is consolidating in a narrow channel between clearly defined support and resistance.
The $4,360 support level has been actively tested since the pin bar reversal from last Monday, when price briefly dropped to $4,100 intraday before recovering sharply. That pin bar, with its long lower wick rejecting the 200-day moving average near $4,200, was the kind of session-specific signal that only shows up when you are watching the chart in real time.
- Why Is Gold Surging? How High Can Gold Go and Gold Price Prediction 2026
- Retail Investors Turn Cooler on AI Stocks as Gold Ownership Hits Three-Year High
- Why Is Gold Falling? XAU/USD Price Is Going Down for the 9th Session as Gold Price Predictions Remain Bearish
Sellers exhausted themselves at exactly the right level. On the upside, local resistance sits at approximately $4,550, defined by the historical highs from late December 2025.
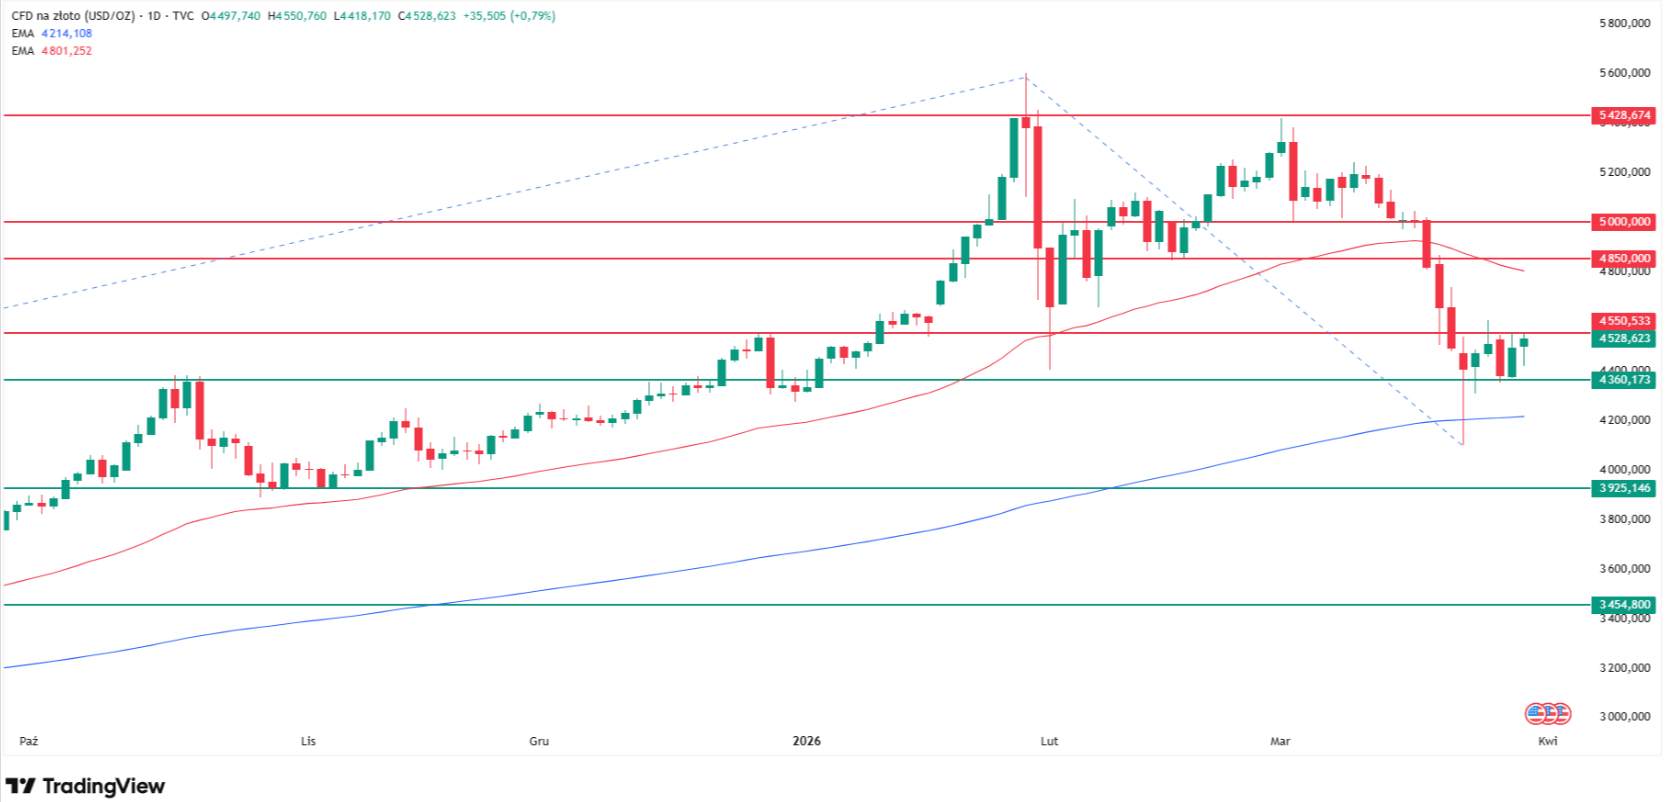
My chart shows the following key levels:
Level | Type | Notes |
$3,500 | Support | H1 2025 highs, ultimate structural floor |
$4,000 | Support | November 2025 lows |
$4,360 | Support | Active, tested since March 24 pin bar |
$4,550 | Resistance | Local, late December 2025 historical highs |
$4,800-$4,850 | Resistance | 50 EMA convergence zone |
$5,000 | Resistance | Psychological level |
$5,430 | Resistance | January 28 session highs, major structural cap |
The January 28 session high at $5,430 remains the most important resistance level on the chart. Gold briefly traded at $5,600 the following day but failed to hold that price, which means $5,430 is the confirmed structural ceiling until a sustained close above it says otherwise. As established in my comprehensive gold price prediction analysis from February, the $4,550-$5,420 range defines the noise. What matters is which boundary breaks first.
My directional bias is neutral at this price. The range between $4,360 and $4,550 is too narrow for a definitive call. A break above $4,550 opens the path toward the 50 EMA at $4,800 and then the psychological $5,000 level. A break below $4,360, and particularly below $4,000, would signal that the 20% correction has further to run.
As I detailed in my analysis of gold's pin bar reversal from March 25, the structural supports that drove gold from $2,600 to $5,600 remain intact. The buyers who stepped in at $4,100-$4,200 last Monday confirmed that.
This week brings two catalysts that could break the range: Fed Chair Powell speaks Monday, and US Nonfarm Payrolls are released Friday, April 3. A dovish surprise from Powell or a weak jobs print below 50,000 could trigger a move toward $4,800. A hawkish tone or strong employment data may push gold back toward $4,000.
Gold Price Predictions 2026: From $4,450 to $10,000
The range of institutional forecasts for how high gold can go in 2026 remains remarkably wide.
Natasha Kaneva, Head of Global Commodities Strategy at J.P. Morgan, stated: "We expect gold demand to push prices toward $5,000 per ounce by year-end 2026." The bank's updated target of $6,300, published February 3, rests on projected central bank purchases of 800 tonnes in 2026.
As the JPMorgan and Deutsche Bank gold forecast analysis from February detailed, Deutsche Bank's Michael Hsueh maintained his $6,000 target through the crash, calling the selloff "a tactical move" rather than a structural shift.
Bart Melek, Managing Director and Head of Commodity Strategy at TD Securities, put it plainly after the correction: "Fundamentally, me and the team still like gold here." His base case targets a $5,000 quarterly average with a technical ceiling around $5,455.
On the bear side, Nigel Green, CEO of the deVere Group, warned of material downside risks in February: "Gold remains one of the few unleveraged sovereign assets. For governments under political or financial strain, the temptation to liquidate reserves is real." HSBC and Standard Chartered have year-end targets at $4,450 and $4,488, respectively, both of which the market has already traded through during the recent lows.
The Goldman Sachs gold price prediction analysis published in January placed the bank's year-end target at $5,400, citing private-sector diversification and central bank buying momentum. Goldman's Senior Commodities Analyst Lina Thomas noted "significant upside risk to the forecast."
Source | Target | Notes |
JPMorgan | $6,300 | Feb 2026, based on 800 tonnes central bank buying |
Wells Fargo | $6,100-$6,300 | Feb 2026, structural bull case |
UBS | $6,200 | Mid-2026 target, $7,200 upside scenario |
BNP Paribas | $6,000 | Year-end 2026, peak above $6,250 possible |
Goldman Sachs | $5,400 | Jan 2026, "significant upside risk" |
ANZ Bank | $5,800 | Feb 2026, mid-range institutional bull case |
TD Securities | $5,000-$5,455 | Base to technical ceiling |
Reuters poll median (30 analysts) | $4,746 | Highest annual consensus since 2012 |
HSBC | $4,450 | Bear case, published pre-crash |
Saxo Bank | $10,000 | Extreme scenario, "Q-Day" digital asset collapse |
Robert Kiyosaki | $35,000 | Conditional on systemic financial collapse |
The Wall Street consensus clusters between $5,400 and $6,300 for year-end 2026, as the Fibonacci extension analysis targeting $7,300 from February established. The 20% correction has not changed any of the major banks' year-end targets. If anything, it has made those forecasts easier to maintain.
FAQ, Gold Price Analysis
How high can gold go in 2026?
Institutional forecasts for 2026 range from $4,450 (HSBC) to $6,300 (JPMorgan). The Reuters poll median of 30 analysts sits at $4,746, the highest annual consensus on record. Extreme scenarios include Saxo Bank's $10,000 and Kiyosaki's $35,000, though both require specific tail-risk events to materialize. Gold is trading at $4,493 as of March 30, 2026.
Why is Robert Kiyosaki predicting $35,000 gold?
Kiyosaki's March 16 prediction of $35,000 gold is conditional on what he calls "the biggest bubble bust in history." He frames gold, silver, Bitcoin, and Ethereum as beneficiaries of a systemic financial collapse. His target represents a 680% increase from current prices and requires either dollar collapse or hyperinflation, placing it far outside the Wall Street consensus of $5,400-$6,300.
What is the gold price today?
Gold is trading at $4,493 per ounce as of March 30, 2026. This represents a roughly 20% decline from the all-time high of $5,595 set on January 29, 2026, but remains approximately 45% above March 2025 levels when gold was near $3,100.
Will gold reach $5,000 again in 2026?
Most institutional analysts expect gold to reclaim $5,000. JPMorgan's Natasha Kaneva projects prices pushing toward $5,000 by year-end. Key catalysts include potential Fed rate cuts, continued central bank buying projected at 585 tonnes per quarter, and ETF inflows estimated at 250 tonnes for the year. However, a hawkish Fed and stronger dollar remain headwinds.
Is gold a good investment after a 20% correction?
The 20% pullback from $5,595 to below $4,100 is the largest correction in the current bull cycle. Historically, corrections of this magnitude within secular bull markets have preceded new highs. Every major Wall Street bank has maintained its year-end target through the selloff. However, short-term risks remain, including the Fed's hawkish stance, rising Treasury yields, and Middle East-driven oil inflation.