The World Gold Council's Gold Outlook 2026 projects a 5-20% correction in gold to $3,360-$3,990 if Trump's reflation policies succeed.
My technical analysis confirms that the WGC $3,300-$3,440 target aligns with the April-August support level.
Gold price is
trading at $4,191 per ounce today (Tuesday) December 9, 2025, holding near the
elevated levels that defined 2025's historic rally. After surging 61% this year
with over 50 all-time highs, the fourth strongest annual return since 1971, gold
now faces a critical question: what will 2026 bring?
According
to the World Gold Council's (WGC) newly released Gold Outlook 2026 report, the
answer depends on whether US President Donald Trump's reflation policies
succeed. In the organization's most bearish scenario, gold price could crash
between 5% and 20% from current $4,200 baseline levels, potentially dropping to
a range of $3,360 to $3,990 per ounce.
In this article I am checking the newest gold price
prediction to try to answer the question: How low can gold go in 2026?
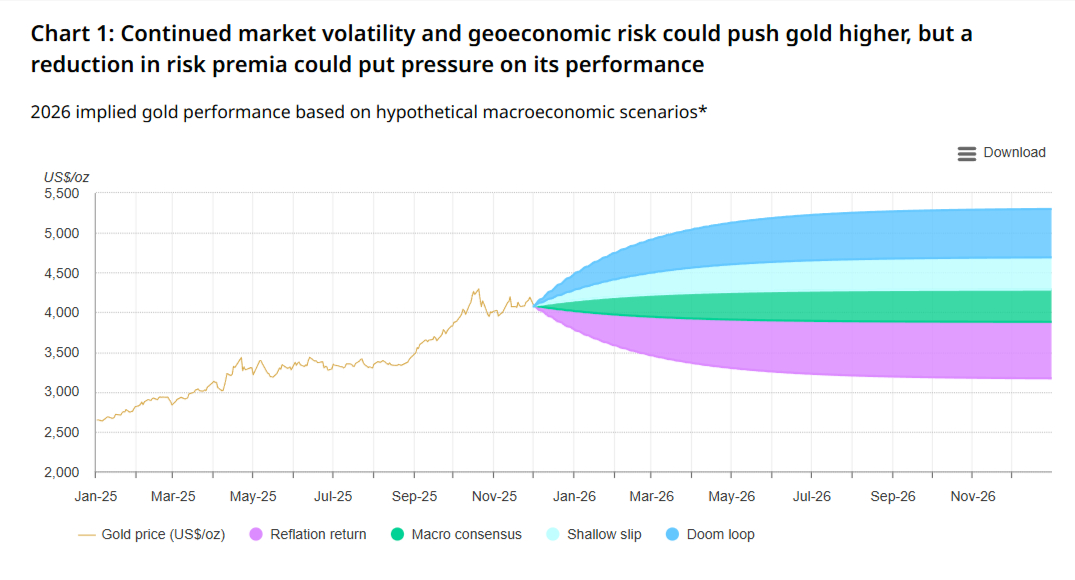
Gold Price Outlook And Four 2026 Scenarios: From +30% Rally to -20% Crash
The World
Gold Council doesn't offer a single prediction for 2026. Instead, the team headed
by Juan Carlos Artigas, Regional CEO (Americas) and Global Head of Research at
the WGC, presents four distinct macroeconomic scenarios in the organization's
Gold Outlook 2026 report, each with dramatically different implications for
gold prices.
"Looking
to 2026, the outlook is shaped by ongoing geoeconomic uncertainty," the
report states. "The gold price broadly reflects macroeconomic consensus
expectations and may remain rangebound if current conditions persist. However,
taking cues from this year, 2026 will likely continue to surprise."
The
baseline "Macro Consensus" scenario assumes current market
expectations play out: global GDP growth remains around 2.7-2.8% in real terms,
the Fed delivers approximately 75 basis points of additional rate cuts, and the
US dollar edges modestly higher. Under these conditions, gold would trade
rangebound between -5% and +5% from current levels, essentially sideways
action.
However,
the WGC emphasizes that "the macroeconomy rarely follows the path that
market consensus dictates." This is where the more extreme scenarios come
into play.
Source: WGC.org
Why Gold Will Crash? The
"Reflation Return" Scenario
The most
bearish outlook for gold in 2026 centers on what the World Gold Council calls
the "Reflation Return" scenario, a situation where President Trump's
fiscal and industrial policies spark stronger-than-expected economic growth.
"On
the flip side, there's also a possibility that the policies set by the Trump
administration succeed, resulting in stronger-than-expected growth linked to
fiscal induced support," according to Juan Carlos Artigas and the WGC
research team in the Gold Outlook 2026 report.
The Reflation Mechanics
The
scenario unfolds in a cascading series of economic developments. "Under
these conditions, reflation likely takes hold, pushing activity higher and
lifting global growth toward a firmer trajectory," the report explains.
As economic
momentum builds, inflation becomes the critical concern. "As inflation
pressures mount, the Fed would be forced to hold or even hike rates in 2026.
This, in turn, would push long-term yields higher and strengthen the US
dollar," Artigas notes.
Using
the WGC's November 2025 baseline of approximately $4,200 per ounce, this
translates to a price range of:
-5%
decline: $3,990 per ounce
-10%
decline: $3,780 per ounce
-15%
decline: $3,570 per ounce
-20%
decline: $3,360 per ounce
The report
specifically identifies gold ETF outflows as a key transmission mechanism.
"Gold ETF holdings could see sustained outflows as investors rotate into
equities and higher-yielding assets. Their magnitude would be a function of the
reduction in gold's risk-induced premium, which has been a mainstay since the
invasion of Ukraine in 2022."
The WGC
concludes that "the combination of higher opportunity costs, risk-on
sentiment, and negative price momentum could create challenging conditions for
gold, reinforcing this as the most bearish scenario in our outlook."
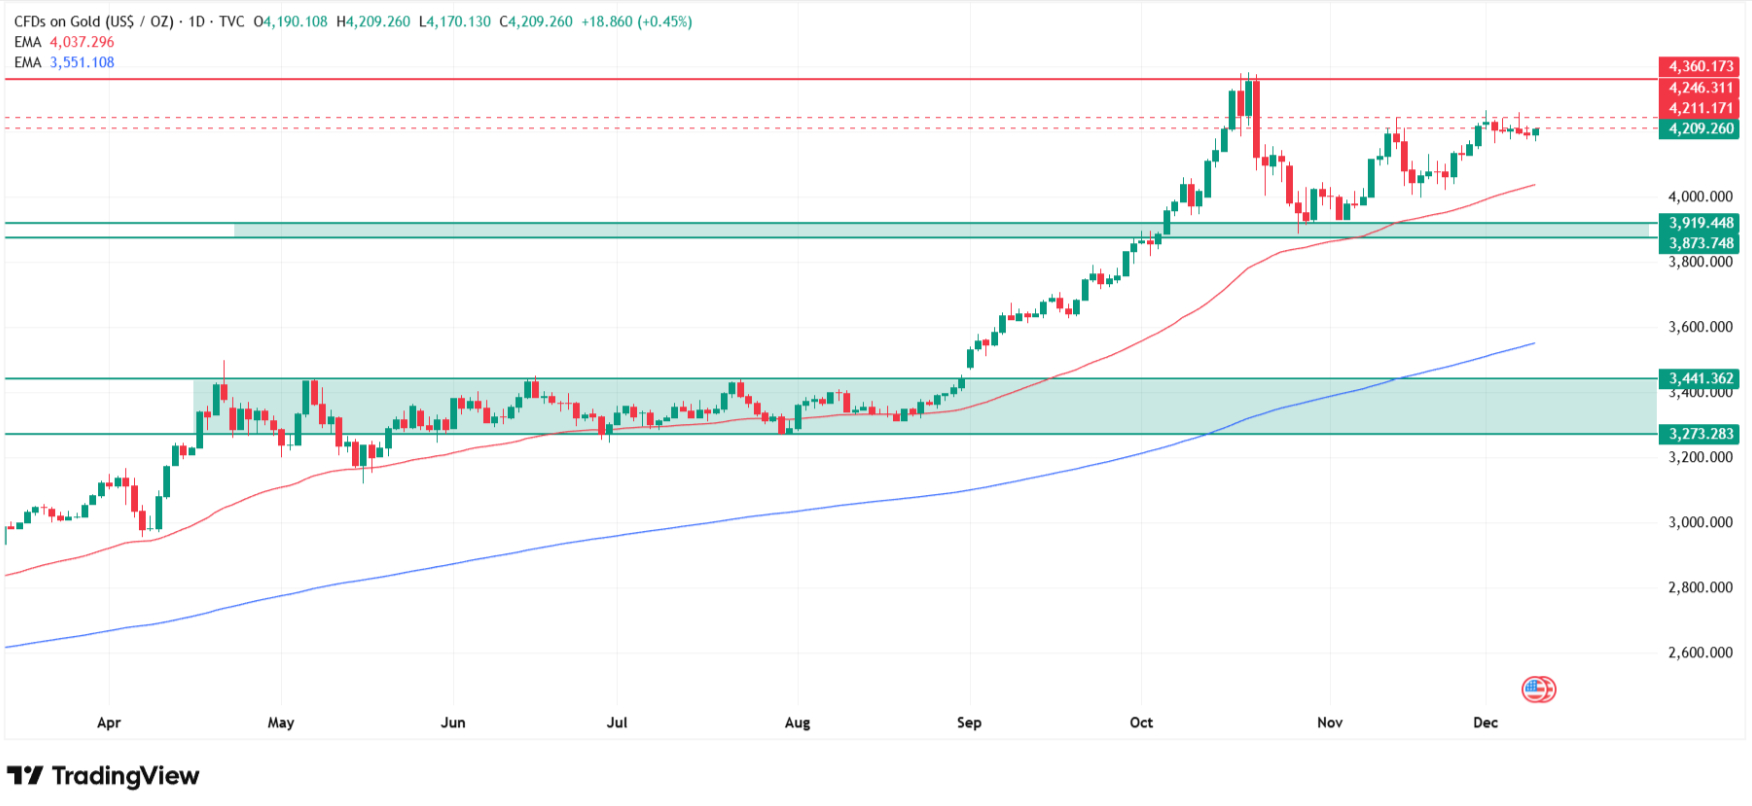
Gold Price Prediction 2026
And $3,300-$3,440 Support Zone
As visible
on my technical analysis chart, the WGC projection aligns remarkably well with
my independently identified support zone between
just under $3,300 per ounce and over $3,440 per ounce, these are the
maximums from the first part of this year drawn from April to August 2025.
This
technical validation is significant. The World Gold Council's fundamental
analysis of macroeconomic scenarios pointing to $3,360-$3,990 under reflation
conditions corresponds almost precisely with my chart-based support levels at
$3,300-$3,440 where gold established multiple highs during the spring and
summer months before the autumn breakout to all-time highs.
Even such a
strong correction wouldn't mean tragedy for the gold market from my
perspective, but only a healthy technical correction and an opportunity to buy
back at more attractive prices. Although this would mean going below the
200-day exponential moving average (200 EMA), if gold began to gradually
decline, the 200 EMA would also find itself at the height of this zone or below
it, so the uptrend would theoretically be maintained.
This is a
critical technical point: A decline to $3,300-$3,440 represents a retest of
previous resistance-turned-support, not a breakdown of the multi-year bull
trend. As long as the 200 EMA descends to meet price at this support zone, the
technical structure of higher lows and higher highs remains intact.
Gold Technical Levels
Under Reflation Scenario
Level
Price
Technical Significance
Current Price
$4,191
Dec 9, 2025, near 2025 highs
November Baseline
~$4,200
WGC projection reference point
-5% Decline
$3,990
Upper end
of reflation correction
-10% Decline
$3,780
Mid-range correction scenario
-15% Decline
$3,570
Deeper correction level
-20% Decline
$3,360
Maximum WGC reflation downside
My Support Zone
$3,300-$3,440
April-August
2025 maximums, key technical base
200 EMA (projected)
~$3,300-$3,400
Would
descend to support on gradual decline
The
alignment between the WGC's $3,360 maximum downside and my $3,300-$3,440
support zone provides dual confirmation, fundamental scenario analysis and
technical chart structure both pointing to the same price region as the likely
floor under bearish conditions.
Even though
the World Gold Council outlines a bearish “Reflation Return” path with a
possible 20% pullback, some of the biggest banks on Wall Street still see gold
significantly higher into 2026.
Goldman Sachs: One of the most aggressive
bulls on Wall Street, Goldman Sachs projects gold could
surge to $5,055 per ounce by late 2026. Their analysts cite
"strong Western ETF inflows" and "continued central bank
buying" as primary drivers. They also note that risks are skewed to
the upside, as private sector diversification into the relatively small
gold market could push prices even higher than their models predict.
Bank of America: BofA has raised its forecast,
targeting $5,000 per ounce by the end of 2026. While they
acknowledge the possibility of short-term corrections, they emphasize that
a 10-15% increase in investment demand could easily elevate prices to this
level.
J.P. Morgan: Taking a longer-term view,
J.P. Morgan sees gold averaging $5,055 by Q4 2026. They have also
issued a conviction call for a multi-year bull market, with a target of $6,000
per ounce by 2028.
UBS: While slightly more
conservative, UBS maintains a bullish stance with a baseline target of $4,200
in the near term. However, they outline a plausible upside scenario where
intensifying geopolitical risks could push the metal to $4,700 by Q1
2026.
ING: Analysts at ING see
fundamental factors pointing to further upside, forecasting prices to
average $4,100 in early 2026 with limited downside risk.
According
to World Gold Council's Gold Outlook 2026 report, gold could decline 5-20% from
~$4,200 November baseline to $3,360-$3,990 range under "Reflation
Return" scenario if Trump policies succeed sparking reflation. As visible
on my technical analysis, this aligns with my support zone $3,300-$3,440
(April-August 2025 maximums).
Why will gold crash?
WGC's
"Reflation Return" scenario projects gold crash if Trump
administration policies succeed creating fiscal-induced growth. "Under
these conditions, reflation likely takes hold, pushing activity higher. As
inflation pressures mount, Fed would be forced to hold or even hike rates in
2026, which would push long-term yields higher and strengthen US dollar,"
per Juan Carlos Artigas.
Will gold fall to $3,300?
Possible
under WGC's "Reflation Return" scenario projecting -20% maximum
decline to $3,360 from $4,200 baseline. As visible on my technical chart, WGC
projection aligns with my support zone $3,300-$3,440 (April-August 2025
maximums where 200 EMA would descend on gradual decline).
Is gold crash coming?
Not
necessarily/ WGC presents four equal scenarios for 2026. "Reflation
Return" crash scenario (-5% to -20%) requires Trump policies succeeding,
reflation, Fed holds/hikes, yields +20bp+, USD materially stronger, risk-on
rotation. But "Shallow Slip" (+5% to +15%) occurs if growth slows/Fed
cuts more, while "Doom Loop" (+15% to +30%) happens in severe
downturn.
Gold price is
trading at $4,191 per ounce today (Tuesday) December 9, 2025, holding near the
elevated levels that defined 2025's historic rally. After surging 61% this year
with over 50 all-time highs, the fourth strongest annual return since 1971, gold
now faces a critical question: what will 2026 bring?
According
to the World Gold Council's (WGC) newly released Gold Outlook 2026 report, the
answer depends on whether US President Donald Trump's reflation policies
succeed. In the organization's most bearish scenario, gold price could crash
between 5% and 20% from current $4,200 baseline levels, potentially dropping to
a range of $3,360 to $3,990 per ounce.
In this article I am checking the newest gold price
prediction to try to answer the question: How low can gold go in 2026?
Gold Price Outlook And Four 2026 Scenarios: From +30% Rally to -20% Crash
The World
Gold Council doesn't offer a single prediction for 2026. Instead, the team headed
by Juan Carlos Artigas, Regional CEO (Americas) and Global Head of Research at
the WGC, presents four distinct macroeconomic scenarios in the organization's
Gold Outlook 2026 report, each with dramatically different implications for
gold prices.
"Looking
to 2026, the outlook is shaped by ongoing geoeconomic uncertainty," the
report states. "The gold price broadly reflects macroeconomic consensus
expectations and may remain rangebound if current conditions persist. However,
taking cues from this year, 2026 will likely continue to surprise."
The
baseline "Macro Consensus" scenario assumes current market
expectations play out: global GDP growth remains around 2.7-2.8% in real terms,
the Fed delivers approximately 75 basis points of additional rate cuts, and the
US dollar edges modestly higher. Under these conditions, gold would trade
rangebound between -5% and +5% from current levels, essentially sideways
action.
However,
the WGC emphasizes that "the macroeconomy rarely follows the path that
market consensus dictates." This is where the more extreme scenarios come
into play.
Source: WGC.org
Why Gold Will Crash? The
"Reflation Return" Scenario
The most
bearish outlook for gold in 2026 centers on what the World Gold Council calls
the "Reflation Return" scenario, a situation where President Trump's
fiscal and industrial policies spark stronger-than-expected economic growth.
"On
the flip side, there's also a possibility that the policies set by the Trump
administration succeed, resulting in stronger-than-expected growth linked to
fiscal induced support," according to Juan Carlos Artigas and the WGC
research team in the Gold Outlook 2026 report.
The Reflation Mechanics
The
scenario unfolds in a cascading series of economic developments. "Under
these conditions, reflation likely takes hold, pushing activity higher and
lifting global growth toward a firmer trajectory," the report explains.
As economic
momentum builds, inflation becomes the critical concern. "As inflation
pressures mount, the Fed would be forced to hold or even hike rates in 2026.
This, in turn, would push long-term yields higher and strengthen the US
dollar," Artigas notes.
Using
the WGC's November 2025 baseline of approximately $4,200 per ounce, this
translates to a price range of:
-5%
decline: $3,990 per ounce
-10%
decline: $3,780 per ounce
-15%
decline: $3,570 per ounce
-20%
decline: $3,360 per ounce
The report
specifically identifies gold ETF outflows as a key transmission mechanism.
"Gold ETF holdings could see sustained outflows as investors rotate into
equities and higher-yielding assets. Their magnitude would be a function of the
reduction in gold's risk-induced premium, which has been a mainstay since the
invasion of Ukraine in 2022."
The WGC
concludes that "the combination of higher opportunity costs, risk-on
sentiment, and negative price momentum could create challenging conditions for
gold, reinforcing this as the most bearish scenario in our outlook."
Gold Price Prediction 2026
And $3,300-$3,440 Support Zone
As visible
on my technical analysis chart, the WGC projection aligns remarkably well with
my independently identified support zone between
just under $3,300 per ounce and over $3,440 per ounce, these are the
maximums from the first part of this year drawn from April to August 2025.
This
technical validation is significant. The World Gold Council's fundamental
analysis of macroeconomic scenarios pointing to $3,360-$3,990 under reflation
conditions corresponds almost precisely with my chart-based support levels at
$3,300-$3,440 where gold established multiple highs during the spring and
summer months before the autumn breakout to all-time highs.
Even such a
strong correction wouldn't mean tragedy for the gold market from my
perspective, but only a healthy technical correction and an opportunity to buy
back at more attractive prices. Although this would mean going below the
200-day exponential moving average (200 EMA), if gold began to gradually
decline, the 200 EMA would also find itself at the height of this zone or below
it, so the uptrend would theoretically be maintained.
This is a
critical technical point: A decline to $3,300-$3,440 represents a retest of
previous resistance-turned-support, not a breakdown of the multi-year bull
trend. As long as the 200 EMA descends to meet price at this support zone, the
technical structure of higher lows and higher highs remains intact.
Gold Technical Levels
Under Reflation Scenario
Level
Price
Technical Significance
Current Price
$4,191
Dec 9, 2025, near 2025 highs
November Baseline
~$4,200
WGC projection reference point
-5% Decline
$3,990
Upper end
of reflation correction
-10% Decline
$3,780
Mid-range correction scenario
-15% Decline
$3,570
Deeper correction level
-20% Decline
$3,360
Maximum WGC reflation downside
My Support Zone
$3,300-$3,440
April-August
2025 maximums, key technical base
200 EMA (projected)
~$3,300-$3,400
Would
descend to support on gradual decline
The
alignment between the WGC's $3,360 maximum downside and my $3,300-$3,440
support zone provides dual confirmation, fundamental scenario analysis and
technical chart structure both pointing to the same price region as the likely
floor under bearish conditions.
Even though
the World Gold Council outlines a bearish “Reflation Return” path with a
possible 20% pullback, some of the biggest banks on Wall Street still see gold
significantly higher into 2026.
Goldman Sachs: One of the most aggressive
bulls on Wall Street, Goldman Sachs projects gold could
surge to $5,055 per ounce by late 2026. Their analysts cite
"strong Western ETF inflows" and "continued central bank
buying" as primary drivers. They also note that risks are skewed to
the upside, as private sector diversification into the relatively small
gold market could push prices even higher than their models predict.
Bank of America: BofA has raised its forecast,
targeting $5,000 per ounce by the end of 2026. While they
acknowledge the possibility of short-term corrections, they emphasize that
a 10-15% increase in investment demand could easily elevate prices to this
level.
J.P. Morgan: Taking a longer-term view,
J.P. Morgan sees gold averaging $5,055 by Q4 2026. They have also
issued a conviction call for a multi-year bull market, with a target of $6,000
per ounce by 2028.
UBS: While slightly more
conservative, UBS maintains a bullish stance with a baseline target of $4,200
in the near term. However, they outline a plausible upside scenario where
intensifying geopolitical risks could push the metal to $4,700 by Q1
2026.
ING: Analysts at ING see
fundamental factors pointing to further upside, forecasting prices to
average $4,100 in early 2026 with limited downside risk.
According
to World Gold Council's Gold Outlook 2026 report, gold could decline 5-20% from
~$4,200 November baseline to $3,360-$3,990 range under "Reflation
Return" scenario if Trump policies succeed sparking reflation. As visible
on my technical analysis, this aligns with my support zone $3,300-$3,440
(April-August 2025 maximums).
Why will gold crash?
WGC's
"Reflation Return" scenario projects gold crash if Trump
administration policies succeed creating fiscal-induced growth. "Under
these conditions, reflation likely takes hold, pushing activity higher. As
inflation pressures mount, Fed would be forced to hold or even hike rates in
2026, which would push long-term yields higher and strengthen US dollar,"
per Juan Carlos Artigas.
Will gold fall to $3,300?
Possible
under WGC's "Reflation Return" scenario projecting -20% maximum
decline to $3,360 from $4,200 baseline. As visible on my technical chart, WGC
projection aligns with my support zone $3,300-$3,440 (April-August 2025
maximums where 200 EMA would descend on gradual decline).
Is gold crash coming?
Not
necessarily/ WGC presents four equal scenarios for 2026. "Reflation
Return" crash scenario (-5% to -20%) requires Trump policies succeeding,
reflation, Fed holds/hikes, yields +20bp+, USD materially stronger, risk-on
rotation. But "Shallow Slip" (+5% to +15%) occurs if growth slows/Fed
cuts more, while "Doom Loop" (+15% to +30%) happens in severe
downturn.
Damian Chmiel is a Senior Analyst & Editor at Finance Magnates with more than 15 years of experience in the CFD and online trading industry. Active as both a trader and journalist since 2010, he focuses on broker coverage, fintech innovation, and regulatory developments across Europe, the Middle East, and Asia.
His work includes interviews with C-level leaders at major brokerages and fintech platforms, as well as co-authoring Finance Magnates’ quarterly industry benchmarking reports. Damian’s reporting is data-driven, market-aware, and grounded in direct industry engagement. His analysis and commentary have also been cited by external media outlets, including Investing.com, Binance, The Asset, Stockhead, and Dispatch.
Education:
MA in Finance and Accounting, Cracow University of Economics
Inside the Prediction Markets: $1.6B Institutional Inflow Meets a Federal Crackdown
Featured Videos
FP Markets Winner Spotlight 🏆 | Global Broker of the Year 2025 #Trading #Broker #Innovation #Shorts
FP Markets Winner Spotlight 🏆 | Global Broker of the Year 2025 #Trading #Broker #Innovation #Shorts
FP Markets Winner Spotlight 🏆 | Global Broker of the Year 2025 #Trading #Broker #Innovation #Shorts
FP Markets Winner Spotlight 🏆 | Global Broker of the Year 2025 #Trading #Broker #Innovation #Shorts
FP Markets takes the spotlight as Global Broker of the Year 2025 at the Finance Magnates Awards.
Martin Stoilov, Head of Client Experience, shares that trust, innovation, and people played a key role in the company’s success, supported by a strong foundation of integrity and client-centricity.
Following this milestone, FP Markets continues to focus on growth, technology investment, and its core values of transparency and excellence.
👉 Be part of FM Awards 2026: https://awards.financemagnates.com/#nominate
In this video, we review @HolaPrimeMarketsOfficial, a multi-asset forex and CFDs broker offering different account types, trading platforms, and flexible trading conditions.
We cover the broker’s overall offering, including account options, trading environment, platforms like MT4 and MT5, and additional services such as managed accounts and fast withdrawals.
Watch the full video to see if Hola Prime Markets fits your trading needs.
📣 Stay up to date with the latest in finance and trading. Follow Finance Magnates for industry news, insights, and global event coverage.
Connect with us:
🔗 LinkedIn: /financemagnates
👍 Facebook: /financemagnates
📸 Instagram: https://www.instagram.com/financemagnates
🐦 X: https://x.com/financemagnates
🎥 TikTok: https://www.tiktok.com/tag/financemagnates
▶️ YouTube: /@financemagnates_official
#HolaPrime #ForexBroker #CFDTrading #FinanceMagnates #Trading #Forex #BrokerReview
Hola Prime Review: What You Need to Know | Full Breakdown by Finance Magnates
Hola Prime Review: What You Need to Know | Full Breakdown by Finance Magnates
Hola Prime Review: What You Need to Know | Full Breakdown by Finance Magnates
Hola Prime Review: What You Need to Know | Full Breakdown by Finance Magnates
Hola Prime Review: What You Need to Know | Full Breakdown by Finance Magnates
Hola Prime Review: What You Need to Know | Full Breakdown by Finance Magnates
In this video, we review @HolaPrime_Global, a proprietary trading firm offering evaluation programs and performance-based payouts in simulated market environments.
We cover how the challenge model works, including account types, profit splits (up to 95%), trading rules, and what it takes to reach a funded account. You’ll also learn about available platforms like MT4, MT5, cTrader, and more, along with insights into payouts, support, and trading conditions.
Watch the full video to see if Hola Prime fits your trading style.
📣 Stay up to date with the latest in finance and trading. Follow Finance Magnates for industry news, insights, and global event coverage.
Connect with us:
🔗 LinkedIn: /financemagnates
👍 Facebook: /financemagnates
📸 Instagram: https://www.instagram.com/financemagnates
🐦 X: https://x.com/financemagnates
🎥 TikTok: https://www.tiktok.com/tag/financemagnates
▶️ YouTube: /@financemagnates_official
#HolaPrime #PropFirm #Trading #FinanceMagnates #Forex #FuturesTrading #TradingReview #PropFirmReview
Axi Winner Spotlight 🏆 | Global Most Innovative Broker 2025 #Innovation #Trading #Fintech #Broker
Axi Winner Spotlight 🏆 | Global Most Innovative Broker 2025 #Innovation #Trading #Fintech #Broker
Axi Winner Spotlight 🏆 | Global Most Innovative Broker 2025 #Innovation #Trading #Fintech #Broker
Axi Winner Spotlight 🏆 | Global Most Innovative Broker 2025 #Innovation #Trading #Fintech #Broker
Axi Winner Spotlight 🏆 | Global Most Innovative Broker 2025 #Innovation #Trading #Fintech #Broker
Axi Winner Spotlight 🏆 | Global Most Innovative Broker 2025 #Innovation #Trading #Fintech #Broker
Axi takes the spotlight at the Finance Magnates Awards, winning Global Most Innovative Broker 2025.
Olivia Xenofontos and Ivanna Openko share how the team will feel: proud, motivated, and ready to keep delivering.
They also describe the night as well-organized, focused, and enjoyable for all.
👉 Be part of FM Awards 2026.
Recognition that matters.
Built on transparency.
Driven by the industry.
The Finance Magnates Awards 2026.
Nominations are now open.
🔗 https://awards.financemagnates.com/?utm_source=SM&utm_medium=social&utm_campaign=recognition-matters
Recognition that matters.
Built on transparency.
Driven by the industry.
The Finance Magnates Awards 2026.
Nominations are now open.
🔗 https://awards.financemagnates.com/?utm_source=SM&utm_medium=social&utm_campaign=recognition-matters
Recognition that matters.
Built on transparency.
Driven by the industry.
The Finance Magnates Awards 2026.
Nominations are now open.
🔗 https://awards.financemagnates.com/?utm_source=SM&utm_medium=social&utm_campaign=recognition-matters
Recognition that matters.
Built on transparency.
Driven by the industry.
The Finance Magnates Awards 2026.
Nominations are now open.
🔗 https://awards.financemagnates.com/?utm_source=SM&utm_medium=social&utm_campaign=recognition-matters
Recognition that matters.
Built on transparency.
Driven by the industry.
The Finance Magnates Awards 2026.
Nominations are now open.
🔗 https://awards.financemagnates.com/?utm_source=SM&utm_medium=social&utm_campaign=recognition-matters
Recognition that matters.
Built on transparency.
Driven by the industry.
The Finance Magnates Awards 2026.
Nominations are now open.
🔗 https://awards.financemagnates.com/?utm_source=SM&utm_medium=social&utm_campaign=recognition-matters