Silver fell 3.8% to $76.55 per ounce on April 21, 2026, the steepest single-day drop in a month, as the Iran ceasefire nears expiry.
Technical chart shows $80 capping rallies, with $70 and the 200 EMA near $65 as the next supports. A break opens $54.50 and Fibonacci targets $20.
Silver price forecasts span a $20 bear case to BofA's $309 bull target, with Citi at $150 and the Reuters poll averaging $79.50.
Why silver price is going down today and what are the newest silver price forecasts?
Silver
traded at $76.55 per ounce on Tuesday, April 21, 2026, down 3.8% in the
steepest single-day drop in a month, as markets weighed the approaching US-Iran
ceasefire expiry and Federal Reserve Chair nominee Kevin Warsh's Senate
confirmation hearing.
The white
metal now sits 37% below the $121.64 all-time high set on January 29, and
roughly 15% below pre-Iran war levels. The Dollar Index has climbed to 98.47
while Brent crude holds near $95, a dual headwind for non-yielding bullion.
This week's
catalysts are stacked. Wednesday marks the ceasefire deadline, with the second
round of US-Iran negotiations still unconfirmed, and Warsh is testifying on
Capitol Hill under pressure from Sen. Thom Tillis to block the vote over the
DOJ's Powell probe.
Follow
me on X for real-time silver market analysis: @ChmielDk
Why Silver Price Is Going
Down? Iran Ceasefire, Warsh Hearing, and a Stronger Dollar
The Tuesday
selloff is driven by three overlapping forces: a firmer dollar, rising
inflation expectations from elevated oil, and uncertainty over whether Warsh's
Fed inherits a more hawkish stance than markets priced in. Bas Kooijman, CEO
and Asset Manager at DHF Capital S.A., framed the setup in his Tuesday note.
"With
the current ceasefire nearing expiration, uncertainty around a potential
extension is keeping investors cautious," said Bas Kooijman, CEO and Asset
Manager at DHF Capital S.A. Kooijman added that any dovish signal from Warsh's
testimony could compress Treasury yields and provide a supportive backdrop for
silver.
The Iran
ceasefire expires Wednesday with no confirmation either side will extend it.
President Trump said Tuesday he "expects to be bombing" Iran if talks
collapse, while the Strait of Hormuz remains largely shut. Since the Iran war
began, silver has plunged over 15%, as geopolitical risks clash with resilient
US consumer activity and the Fed's 3.50-3.75% hold. Retail sales jumped 1.7% in
March, the strongest monthly gain in a year.
As I wrote
in my March crash analysis, the hawkish Fed hold in March,
which revised 2026 dot-plot projections down to just one cut, hit silver harder
than gold. That amplification dynamic is repeating today.
The four
forces driving Tuesday's silver selloff:
Dollar Index at 98.47, directly pressuring silver
priced in dollars
Brent crude near $95 lifting inflation expectations
and Treasury yields
Iran ceasefire expiring
Wednesday with
no extension confirmed by either side
Warsh Senate hearing creating policy uncertainty
ahead of the May 15 Powell transition
The Physical Market
Paradox: Sixth Straight Silver Deficit Meets Paper Selling
The paper
market is selling while the physical market keeps tightening. That divergence
has defined silver for most of 2026 and has not reversed on this pullback.
Key
physical data points going into the Tuesday selloff:
2026 silver market deficit projected at 46.3M oz, up 15%
from 40.3M oz in 2025, per the Silver Institute and Metals Focus April 15
report
Stock drawdown reached 762M oz from global
above-ground inventories since 2021 to cover the cumulative deficit
Coin and bar demand forecast to rise 18% in 2026,
supported by a recovery in US retail buying
Industrial fabrication forecast to drop 3% to a
four-year low, with the Iran war cited as a downside risk to global growth
As I wrote
in my April COMEX analysis, registered silver inventory has
fallen to 76M oz, just 13.4% coverage of open interest. That gap between paper
pricing and physical availability is the core structural argument behind Bank
of America's $135-$309 target range for 2026.
Very little
has changed on my daily chart despite the 3.8% move. Silver remains pinned
inside the broad consolidation range it has held since the January 30 flash
crash. The 50-day exponential moving average sits near $80 and is actively
capping every rally attempt. Below spot, the $70 round-number support has held
three times this year and is reinforced by the 200-day EMA at $65.
My
directional bias is neutral with a bearish tilt, contingent on whether $70
holds on a fourth test. Below $70, the next meaningful floor on my chart is
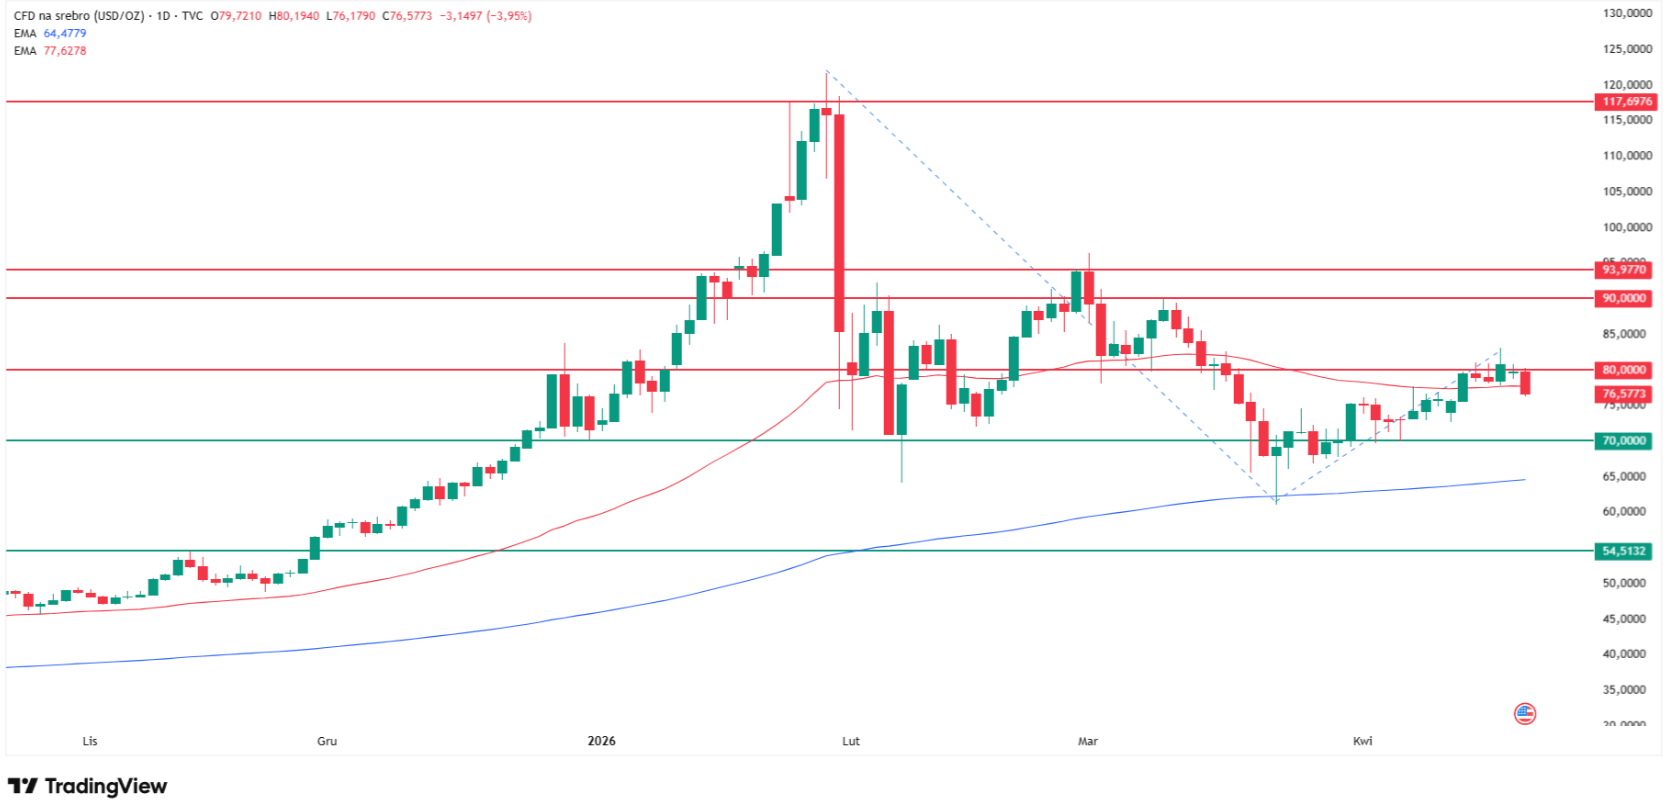
$54.50, the October 2025 breakout zone. Above spot, silver would need to
reclaim $80 on a daily close before $90-$94 (the February highs) comes back
into play, and only an $80 monthly close would reopen the path toward the $120
all-time high.
Why silver price is going down today? Source: Tradingview.com
Key silver price levels
(XAG/USD spot, April 21, 2026):
Level
Type
Notes
$120
Resistance
January 29 all-time high
$90-$94
Resistance
February consolidation highs
$80
Resistance
50-day EMA, active cap
$70
Support
Tested three times in 2026
$65
Support
200-day EMA
$54.50
Support
October 2025 breakout zone
$20
Fib target
1.618 extension bear case
How Low Can Silver Go?
Silver Price Prediction 2026 From $20 Bear Case to $309 Bull
Forecasts
for silver in 2026 span a range so wide it verges on non-informative, which is
itself a signal about how broken the pricing mechanism has become. On the bull
side, Bank of America's Michael Widmer holds a $135-$309 target based on
gold-to-silver ratio compression. Citigroup projects $150-$170 within three
months if the ratio returns to its 2011 low of 32:1. Macro strategist David
Hunter targets $180 by Q2, and Robert Kiyosaki calls for $200 under his fiat
debasement thesis.
On the
base-case side, the Reuters poll of 30 analysts sets the 2026 median at $79.50,
just above current spot. JPMorgan holds the most conservative major-bank call
at $81 average. As the FinanceMagnates.com Citi target
report from January detailed, Citigroup described silver as a higher-beta version of gold when it
tested $120 before the January 30 crash erased 36% in a single session.
Kooijman
maintains a constructive medium-term view despite the pullback. He argues that
silver could see increased demand while supply shrinks this year, with the
sixth consecutive annual deficit providing a structural floor under any further
downside. That dynamic mirrors the amplification pattern the FinanceMagnates.com report on
the March Iran-driven gold and silver selloff detailed, where physical tightness
eventually absorbed the paper selling.
Silver price prediction table (2026):
Source
Target
Notes
Bank of
America (Michael Widmer)
$135-$309
Gold/silver ratio compression
Citigroup
$150-$170
3-month target, ratio at 32:1
David Hunter
$180
Q2 2026, macro strategist
Robert Kiyosaki
$200
2026, fiat debasement thesis
Reuters poll (30 analysts)
$79.50
2026 average median
JPMorgan
$81
2026 average
My chart bear case
$54.50
If $70 support fails
My Fibonacci extension
$20
1.618 downside extension
As my April 20 gold analysis established, even gold carries a
28% downside risk to $3,400 in a reflation scenario. Silver's higher beta means
it will move further in both directions.
Silver Price Prediction
FAQ
Why is silver falling
today, April 21, 2026?
Silver fell
3.8% to $76.55 per ounce on Tuesday, pressured by a Dollar Index above 98 and
Brent crude near $95 lifting Treasury yields. Markets are weighing Wednesday's
US-Iran ceasefire expiry and Kevin Warsh's Senate confirmation hearing, where
any hawkish signal would further raise the opportunity cost of holding
non-yielding silver. Since the Iran war began, silver is down over 15%.
How low can silver go in
2026?
My chart
identifies four progressive downside zones: $70 (tested three times), $65
(200-day EMA), $54.50 (October 2025 breakout), and a 1.618 Fibonacci extension
at $20. A genuine Fed hold combined with reflation would target the $54.50-$65
zone. The $20 extension is an extreme scenario but represents silver's normal
trading range from 2022 to 2024.
What is the silver price
prediction for 2026?
Institutional
targets span from JPMorgan's $81 average to Bank of America's $309 bull case.
The Reuters poll of 30 analysts sets the 2026 median at $79.50. Citigroup holds
a $150-$170 short-term target, David Hunter targets $180 by Q2, and Robert
Kiyosaki forecasts $200. My chart sees $54.50 as the bear case if $70 fails on
a weekly close.
Will silver recover after
the Iran ceasefire?
The answer
depends on the outcome. An extension or framework agreement would compress
Brent crude, weaken the dollar, and reopen the path toward $80 and $90-$94. A
collapse into renewed conflict would initially spike silver on safe-haven
flows, but as my March 3 analysis documented, silver retraces those spikes
within 48-72 hours as industrial-demand concerns reassert.
Is silver still in a bull
market?
Yes,
structurally. Silver is up roughly 135% year-on-year and the supply deficit is
widening for a sixth straight year. My chart shows silver inside a
consolidation range, not a confirmed downtrend. A weekly close below $70 would
be the first serious warning. A close below $54.50 would end the structural
bull case entirely.
Silver
traded at $76.55 per ounce on Tuesday, April 21, 2026, down 3.8% in the
steepest single-day drop in a month, as markets weighed the approaching US-Iran
ceasefire expiry and Federal Reserve Chair nominee Kevin Warsh's Senate
confirmation hearing.
The white
metal now sits 37% below the $121.64 all-time high set on January 29, and
roughly 15% below pre-Iran war levels. The Dollar Index has climbed to 98.47
while Brent crude holds near $95, a dual headwind for non-yielding bullion.
This week's
catalysts are stacked. Wednesday marks the ceasefire deadline, with the second
round of US-Iran negotiations still unconfirmed, and Warsh is testifying on
Capitol Hill under pressure from Sen. Thom Tillis to block the vote over the
DOJ's Powell probe.
Follow
me on X for real-time silver market analysis: @ChmielDk
Why Silver Price Is Going
Down? Iran Ceasefire, Warsh Hearing, and a Stronger Dollar
The Tuesday
selloff is driven by three overlapping forces: a firmer dollar, rising
inflation expectations from elevated oil, and uncertainty over whether Warsh's
Fed inherits a more hawkish stance than markets priced in. Bas Kooijman, CEO
and Asset Manager at DHF Capital S.A., framed the setup in his Tuesday note.
"With
the current ceasefire nearing expiration, uncertainty around a potential
extension is keeping investors cautious," said Bas Kooijman, CEO and Asset
Manager at DHF Capital S.A. Kooijman added that any dovish signal from Warsh's
testimony could compress Treasury yields and provide a supportive backdrop for
silver.
The Iran
ceasefire expires Wednesday with no confirmation either side will extend it.
President Trump said Tuesday he "expects to be bombing" Iran if talks
collapse, while the Strait of Hormuz remains largely shut. Since the Iran war
began, silver has plunged over 15%, as geopolitical risks clash with resilient
US consumer activity and the Fed's 3.50-3.75% hold. Retail sales jumped 1.7% in
March, the strongest monthly gain in a year.
As I wrote
in my March crash analysis, the hawkish Fed hold in March,
which revised 2026 dot-plot projections down to just one cut, hit silver harder
than gold. That amplification dynamic is repeating today.
The four
forces driving Tuesday's silver selloff:
Dollar Index at 98.47, directly pressuring silver
priced in dollars
Brent crude near $95 lifting inflation expectations
and Treasury yields
Iran ceasefire expiring
Wednesday with
no extension confirmed by either side
Warsh Senate hearing creating policy uncertainty
ahead of the May 15 Powell transition
The Physical Market
Paradox: Sixth Straight Silver Deficit Meets Paper Selling
The paper
market is selling while the physical market keeps tightening. That divergence
has defined silver for most of 2026 and has not reversed on this pullback.
Key
physical data points going into the Tuesday selloff:
2026 silver market deficit projected at 46.3M oz, up 15%
from 40.3M oz in 2025, per the Silver Institute and Metals Focus April 15
report
Stock drawdown reached 762M oz from global
above-ground inventories since 2021 to cover the cumulative deficit
Coin and bar demand forecast to rise 18% in 2026,
supported by a recovery in US retail buying
Industrial fabrication forecast to drop 3% to a
four-year low, with the Iran war cited as a downside risk to global growth
As I wrote
in my April COMEX analysis, registered silver inventory has
fallen to 76M oz, just 13.4% coverage of open interest. That gap between paper
pricing and physical availability is the core structural argument behind Bank
of America's $135-$309 target range for 2026.
Very little
has changed on my daily chart despite the 3.8% move. Silver remains pinned
inside the broad consolidation range it has held since the January 30 flash
crash. The 50-day exponential moving average sits near $80 and is actively
capping every rally attempt. Below spot, the $70 round-number support has held
three times this year and is reinforced by the 200-day EMA at $65.
My
directional bias is neutral with a bearish tilt, contingent on whether $70
holds on a fourth test. Below $70, the next meaningful floor on my chart is
$54.50, the October 2025 breakout zone. Above spot, silver would need to
reclaim $80 on a daily close before $90-$94 (the February highs) comes back
into play, and only an $80 monthly close would reopen the path toward the $120
all-time high.
Why silver price is going down today? Source: Tradingview.com
Key silver price levels
(XAG/USD spot, April 21, 2026):
Level
Type
Notes
$120
Resistance
January 29 all-time high
$90-$94
Resistance
February consolidation highs
$80
Resistance
50-day EMA, active cap
$70
Support
Tested three times in 2026
$65
Support
200-day EMA
$54.50
Support
October 2025 breakout zone
$20
Fib target
1.618 extension bear case
How Low Can Silver Go?
Silver Price Prediction 2026 From $20 Bear Case to $309 Bull
Forecasts
for silver in 2026 span a range so wide it verges on non-informative, which is
itself a signal about how broken the pricing mechanism has become. On the bull
side, Bank of America's Michael Widmer holds a $135-$309 target based on
gold-to-silver ratio compression. Citigroup projects $150-$170 within three
months if the ratio returns to its 2011 low of 32:1. Macro strategist David
Hunter targets $180 by Q2, and Robert Kiyosaki calls for $200 under his fiat
debasement thesis.
On the
base-case side, the Reuters poll of 30 analysts sets the 2026 median at $79.50,
just above current spot. JPMorgan holds the most conservative major-bank call
at $81 average. As the FinanceMagnates.com Citi target
report from January detailed, Citigroup described silver as a higher-beta version of gold when it
tested $120 before the January 30 crash erased 36% in a single session.
Kooijman
maintains a constructive medium-term view despite the pullback. He argues that
silver could see increased demand while supply shrinks this year, with the
sixth consecutive annual deficit providing a structural floor under any further
downside. That dynamic mirrors the amplification pattern the FinanceMagnates.com report on
the March Iran-driven gold and silver selloff detailed, where physical tightness
eventually absorbed the paper selling.
Silver price prediction table (2026):
Source
Target
Notes
Bank of
America (Michael Widmer)
$135-$309
Gold/silver ratio compression
Citigroup
$150-$170
3-month target, ratio at 32:1
David Hunter
$180
Q2 2026, macro strategist
Robert Kiyosaki
$200
2026, fiat debasement thesis
Reuters poll (30 analysts)
$79.50
2026 average median
JPMorgan
$81
2026 average
My chart bear case
$54.50
If $70 support fails
My Fibonacci extension
$20
1.618 downside extension
As my April 20 gold analysis established, even gold carries a
28% downside risk to $3,400 in a reflation scenario. Silver's higher beta means
it will move further in both directions.
Silver Price Prediction
FAQ
Why is silver falling
today, April 21, 2026?
Silver fell
3.8% to $76.55 per ounce on Tuesday, pressured by a Dollar Index above 98 and
Brent crude near $95 lifting Treasury yields. Markets are weighing Wednesday's
US-Iran ceasefire expiry and Kevin Warsh's Senate confirmation hearing, where
any hawkish signal would further raise the opportunity cost of holding
non-yielding silver. Since the Iran war began, silver is down over 15%.
How low can silver go in
2026?
My chart
identifies four progressive downside zones: $70 (tested three times), $65
(200-day EMA), $54.50 (October 2025 breakout), and a 1.618 Fibonacci extension
at $20. A genuine Fed hold combined with reflation would target the $54.50-$65
zone. The $20 extension is an extreme scenario but represents silver's normal
trading range from 2022 to 2024.
What is the silver price
prediction for 2026?
Institutional
targets span from JPMorgan's $81 average to Bank of America's $309 bull case.
The Reuters poll of 30 analysts sets the 2026 median at $79.50. Citigroup holds
a $150-$170 short-term target, David Hunter targets $180 by Q2, and Robert
Kiyosaki forecasts $200. My chart sees $54.50 as the bear case if $70 fails on
a weekly close.
Will silver recover after
the Iran ceasefire?
The answer
depends on the outcome. An extension or framework agreement would compress
Brent crude, weaken the dollar, and reopen the path toward $80 and $90-$94. A
collapse into renewed conflict would initially spike silver on safe-haven
flows, but as my March 3 analysis documented, silver retraces those spikes
within 48-72 hours as industrial-demand concerns reassert.
Is silver still in a bull
market?
Yes,
structurally. Silver is up roughly 135% year-on-year and the supply deficit is
widening for a sixth straight year. My chart shows silver inside a
consolidation range, not a confirmed downtrend. A weekly close below $70 would
be the first serious warning. A close below $54.50 would end the structural
bull case entirely.
Damian Chmiel is a Senior Analyst & Editor at Finance Magnates with more than 15 years of experience in the CFD and online trading industry. Active as both a trader and journalist since 2010, he focuses on broker coverage, fintech innovation, and regulatory developments across Europe, the Middle East, and Asia.
His work includes interviews with C-level leaders at major brokerages and fintech platforms, as well as co-authoring Finance Magnates’ quarterly industry benchmarking reports. Damian’s reporting is data-driven, market-aware, and grounded in direct industry engagement. His analysis and commentary have also been cited by external media outlets, including Investing.com, Binance, The Asset, Stockhead, and Dispatch.
Education:
MA in Finance and Accounting, Cracow University of Economics
This New Bitcoin Price Prediction Shows BTC May Drop 25% After $60K Break
Featured Videos
FM Daily Brief – 10 July 2026
FM Daily Brief – 10 July 2026
FM Daily Brief – 10 July 2026
FM Daily Brief – 10 July 2026
Today is Friday, the 10th of July 2026, and here are our main stories: US brokers posted record trading volumes in June, Tradeify's co-founders detail the firm's rapid growth, and the Genius Act's stablecoin deadline is ten days out.
Today is Friday, the 10th of July 2026, and here are our main stories: US brokers posted record trading volumes in June, Tradeify's co-founders detail the firm's rapid growth, and the Genius Act's stablecoin deadline is ten days out.
Today is Friday, the 10th of July 2026, and here are our main stories: US brokers posted record trading volumes in June, Tradeify's co-founders detail the firm's rapid growth, and the Genius Act's stablecoin deadline is ten days out.
Today is Friday, the 10th of July 2026, and here are our main stories: US brokers posted record trading volumes in June, Tradeify's co-founders detail the firm's rapid growth, and the Genius Act's stablecoin deadline is ten days out.
Today is Thursday, the 9th of July 2026 and here’s our main stories: Capital dot com's trading volumes slipped, while average trade size jumped. Trive loses its Australian license. And European lawmakers eye new rules for DeFi and staking.
Today is Thursday, the 9th of July 2026 and here’s our main stories: Capital dot com's trading volumes slipped, while average trade size jumped. Trive loses its Australian license. And European lawmakers eye new rules for DeFi and staking.
Today is Thursday, the 9th of July 2026 and here’s our main stories: Capital dot com's trading volumes slipped, while average trade size jumped. Trive loses its Australian license. And European lawmakers eye new rules for DeFi and staking.
Today is Thursday, the 9th of July 2026 and here’s our main stories: Capital dot com's trading volumes slipped, while average trade size jumped. Trive loses its Australian license. And European lawmakers eye new rules for DeFi and staking.
Today is Thursday, the 9th of July 2026 and here’s our main stories: Capital dot com's trading volumes slipped, while average trade size jumped. Trive loses its Australian license. And European lawmakers eye new rules for DeFi and staking.
Today is Thursday, the 9th of July 2026 and here’s our main stories: Capital dot com's trading volumes slipped, while average trade size jumped. Trive loses its Australian license. And European lawmakers eye new rules for DeFi and staking.
Match2Pay on Crypto Payments, Stablecoins & Faster Broker Integrations
Match2Pay on Crypto Payments, Stablecoins & Faster Broker Integrations
Match2Pay on Crypto Payments, Stablecoins & Faster Broker Integrations
Match2Pay on Crypto Payments, Stablecoins & Faster Broker Integrations
Match2Pay on Crypto Payments, Stablecoins & Faster Broker Integrations
Match2Pay on Crypto Payments, Stablecoins & Faster Broker Integrations
Are crypto payments really risky for brokers, or is the industry working with outdated assumptions?
In this exclusive Finance Magnates interview from iFX Expo International 2026, Adonis Adoni, News Editor at Finance Magnates, speaks with Andrey Kalashnikov, Head of Match2Pay, about how brokers can improve payment efficiency, reduce costs, and simplify crypto payment infrastructure.
The conversation explores why many firms are paying more than necessary by using multiple crypto providers, how one-click wallet integrations are improving the client deposit experience, and why stablecoins are changing the way finance teams view crypto payments.
In this interview you'll learn:
- Why relying only on card payments could be limiting your business
- The hidden costs of using multiple crypto payment providers
- How one-click crypto payments improve conversion and user experience
- How Match2Pay enables integrations in as little as 24–48 hours
- Why stablecoins eliminate most volatility concerns for finance teams
- How blockchain analytics and AML screening help reduce payment risk
- What brokers should consider when choosing a crypto payment infrastructure
Key Quote:
"It's a mistake to completely rely on traditional payments and not look for alternative methods to optimize your payments." — Andrey Kalashnikov
If you're a broker, payment provider, fintech executive, or compliance professional, this interview offers practical insights into the future of crypto payments.
#FinanceMagnates #Match2Pay #CryptoPayments #Fintech #Forex #CFD #Brokerage #Stablecoins #Blockchain #Payments #iFXExpo #DigitalAssets
FM Daily Brief – 8 July 2026
FM Daily Brief – 8 July 2026
FM Daily Brief – 8 July 2026
FM Daily Brief – 8 July 2026
FM Daily Brief – 8 July 2026
FM Daily Brief – 8 July 2026
Today is Wednesday, the 8th of July 2026, and here's our main stories: IG Group proposes a Jersey holding company as first-half revenue jumps eighteen percent. Coinbase wins UK approval for stocks and derivatives. And Plus500 taps a UAE finfluencer.
Today is Wednesday, the 8th of July 2026, and here's our main stories: IG Group proposes a Jersey holding company as first-half revenue jumps eighteen percent. Coinbase wins UK approval for stocks and derivatives. And Plus500 taps a UAE finfluencer.
Today is Wednesday, the 8th of July 2026, and here's our main stories: IG Group proposes a Jersey holding company as first-half revenue jumps eighteen percent. Coinbase wins UK approval for stocks and derivatives. And Plus500 taps a UAE finfluencer.
Today is Wednesday, the 8th of July 2026, and here's our main stories: IG Group proposes a Jersey holding company as first-half revenue jumps eighteen percent. Coinbase wins UK approval for stocks and derivatives. And Plus500 taps a UAE finfluencer.
Today is Wednesday, the 8th of July 2026, and here's our main stories: IG Group proposes a Jersey holding company as first-half revenue jumps eighteen percent. Coinbase wins UK approval for stocks and derivatives. And Plus500 taps a UAE finfluencer.
Today is Wednesday, the 8th of July 2026, and here's our main stories: IG Group proposes a Jersey holding company as first-half revenue jumps eighteen percent. Coinbase wins UK approval for stocks and derivatives. And Plus500 taps a UAE finfluencer.
Stress-tested Liquidity, Gold Volatility & Dubai Growth | Andreas Kapsos, CEO of Match-Prime
Stress-tested Liquidity, Gold Volatility & Dubai Growth | Andreas Kapsos, CEO of Match-Prime
Stress-tested Liquidity, Gold Volatility & Dubai Growth | Andreas Kapsos, CEO of Match-Prime
Stress-tested Liquidity, Gold Volatility & Dubai Growth | Andreas Kapsos, CEO of Match-Prime
Stress-tested Liquidity, Gold Volatility & Dubai Growth | Andreas Kapsos, CEO of Match-Prime
Stress-tested Liquidity, Gold Volatility & Dubai Growth | Andreas Kapsos, CEO of Match-Prime
How do liquidity providers perform when markets are under extreme pressure?
In this exclusive interview from iFX EXPO International 2026, Finance Magnates Editor-in-Chief Yam Yehoshua speaks with Andreas Kapsos, CEO of Match-Prime Liquidity, about the recent stress-tested Liquidity conducted by the company, the impact of January's historic gold market volatility, and why Dubai remains a key growth hub for the industry.
In this interview, you'll learn:
- How Match-Prime stress-tested its liquidity during major market events
- What brokers should look for in a liquidity provider during volatile markets
- Lessons from the industry's gold trading surge
- Why collaboration between liquidity providers became critical
- The challenges faced by new market entrants
- How Match-Prime's Dubai office supports growth across the Middle East and Asia
- Why face-to-face relationships still matter in institutional trading
If you're a broker, liquidity provider, fintech executive, or active in the online trading industry, this interview offers valuable insights into today's market infrastructure and risk management.
#MatchPrime #Liquidity #Forex #CFD #GoldTrading #LiquidityProvider #PrimeBrokerage #RiskManagement #Dubai #TradingInfrastructure #BrokerTechnology #iFXEXPO #FinanceMagnates #Fintech #CapitalMarkets